Aerosol Printing and Graphics Market Snapshot (2023 to 2033)

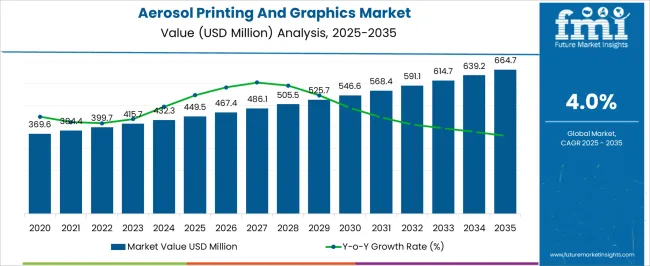
Global aerosol printing and graphics market demand is anticipated to be valued at US$ 414 million in the current year 2023. According to FMI forecasts, the overall market is anticipated to grow at a CAGR of 4.2% over the years from 2023 to 2033. In addition to this, the report estimates the overall market to be valued at US$ 624.7 million by 2033. Growth is attributed to evolving printing technology. From 2018 to 2022, a CAGR of 3.4% was registered for the land mobile radio system market.

Aerosol Jet Printing (AJP) is a particularly innovative technology for the selective deposition of materials at micron-scale onto any or also the non-flat, flexible, or 3D substrate. AJ printing works by spraying out an aerosol – a suspension of small liquid droplets in air - in a process that parallels spray painting. Unlike spray paint, however, this aerosol is very precisely deposited, supported by a series of steps that ensure a small, focused beam of material.

Due to growing preferences and demand for high-quality graphical printing for aerosol, there has been substantial growth in the aerosol printing and graphics market. Demand for aerosol printing is continuously growing with the increase in convenience packaging and the trend for preference of customers for aesthetic value. Aerosol printing and graphics is endlessly growing, with equipment manufacturers eying towards a flourishing market of printing. Recent years have seen an upsurge in demand for printing due to an increase in manufacturing activities across the globe, and this trend is expected to grow over the forecast period 2023 to 2033.

North America is considered a highly lucrative market for the aerosol printing and graphics market, driven primarily by the presence of many manufacturers in the region. Simultaneously, fluctuations in the prices of printing raw materials are acting as significant growth barriers.

Report Attributes or Data Points Details
Global Aerosol Printing and Graphics Market Valuation in 2022 US$ 397.3 million
Estimated Global Market Share in 2023 US$ 414 million
Forecasted Global Market Size by 2033 US$ 624.7 million
Projected Global Market Growth Rate from 2023 to 2033 4.2% CAGR
Historical Market Growth Rate from 2018 to 2022 3.4% CAGR

Don't pay for what you don't need

Customize your report by selecting specific countries or regions and save 30%!

What are Some Prominent Drivers Spearheading Aerosol Printing and Graphics Market Growth?

The global aerosol printing and graphics market is anticipated to witness significant growth owing to the demand for the usage of printing for aerosol printing and graphics in the pharmaceuticals and the personal care industry. Aerosol printing and graphics also provide protection from pollution and moisture, giving this market an advantage.

Due to changes in the lifestyle and convenience of the customers in emerging economies across the world, the scenario has triggered the growth of the aerosol printing and graphics market. In addition, growth in the market for aerosol cans by consumers across the globe is a key factor making a positive impact on the growth of the market.

What are the Challenges Faced by the Aerosol Printing and Graphics Industry?

Although the aerosol printing and graphics market has numerous end-uses, numerous obstacles likely pose a challenge to market growth. The primary challenge faced by the aerosol printing and graphics market is due to fluctuations in the prices of printing ink materials market. The environmentally hazardous nature of selenium, which is used in printers, and stringent government regulations restrain the growth of the market. Also, the availability of inkjet technology as its substitute is a major challenging factor to the growth of the market.
Ismail Sutaria
Ismail Sutaria

Principal Consultant

Talk to Analyst

Find your sweet spots for generating winning opportunities in this market.

Why is North America Emerging as an Opportunistic Aerosol Printing and Graphics Market?

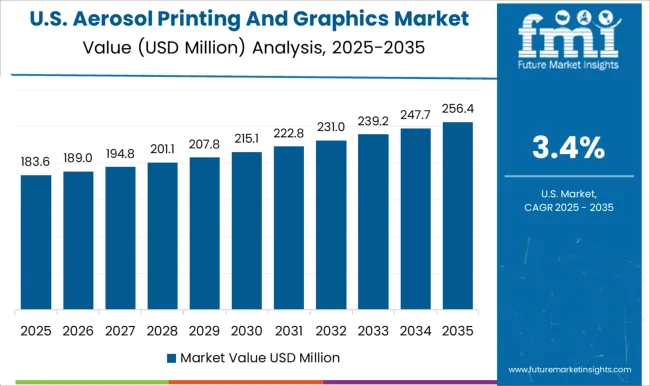
North America was the fastest growing market for the market, and the trend is expected to continue into the forecast period owing to the modern advancements in the field of printing industries in the region. According to FMI, North America accounted for 18% of the global market share in 2022.

The reason for the high demand is the presence of major key players in aerosol packaging in the United States. Key players such as Ball Corporation and others have strong footprints along with strong production capacity in the United States. For instance, in June 2022 - Based on the growing aluminum can demand worldwide, Ball Corporation expanded its operations in South America, landing in Peru with a new manufacturing plant in the city of Chilca. The operation will have a production capacity of over 1 billion beverage cans annually and will start in 2023.

Furthermore, rising disposable income and spending on healthcare products by individuals in the United States are the factors that lead to lifting the demand for pharmaceutical products that also include aerosol packaging.

Regional Market Comparison Global Market Share in Percentage
North America 18%
Europe 12%

How is Europe Contributing to the Growth of the Aerosol Printing and Graphics Market?

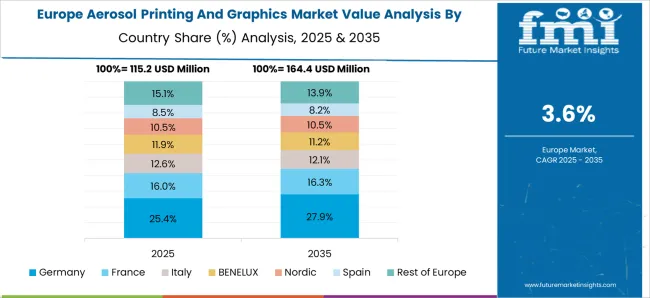
According to Future Market Insights, Europe accounts for a 12% share of the total global market in 2022. The rising demand for personal care and cosmetics products in Europe boosts the growth of the market in the region.

In Western Europe, France, Germany, and the UK are expected to be the utmost attractive market and would have considerable growth in the market over the forecast period. Eastern Europe is also estimated to have sizeable growth in Russia for the market.

Get the data you need at a Fraction of the cost

Personalize your report by choosing insights you need
and save 40%!

Will the Asia Pacific emerge as an Attractive Aerosol Printing and Graphics Market?

In terms of year-on-year growth, the said market share in the Asia Pacific region is the best performing portion as per the new market research report on the global market. Asia Pacific region is expected to account for a significant value share of the global market for aerosol printing and graphics, increase disposable income, and spending power among the customers in the region.

The aerosol printing and graphics market in Asia Pacific is anticipated to expand at a rapid pace during the forecast period due to the increase in disposable income and spending power of customers in the region. China, Japan, and India are the prominent countries of the aerosol printing and graphics market in Asia Pacific.

Start-up Scenario

Casablanca Industries limited, United Aerosol, Printed Electronics Ltd., Eugen Packaging some of the start-up companies operating in aerosol printing and packaging market.
  • Casablanca covers the packaging needs for aerosols of the Indian market. The company has two state of the art manufacturing lines for the production of aluminium cans with 8 color printing at 200 cans/minute. The facility is operating at a staggering capacity of 125 million cans per year, a distinction enjoyed by very few in the market.
  • Likewise, United Aerosol is a prominent manufacturer of three piece tin plate aerosol cans, printed tin plate sheets and associated services. The company is ISO 9001 accredited since 2013, with comprehensive Quality Management System. All aerosol cans are fully compliant to all current Aerosol Standards and are manufactured on high speed production lines with in-house printing and coating equipment.

Market Competition

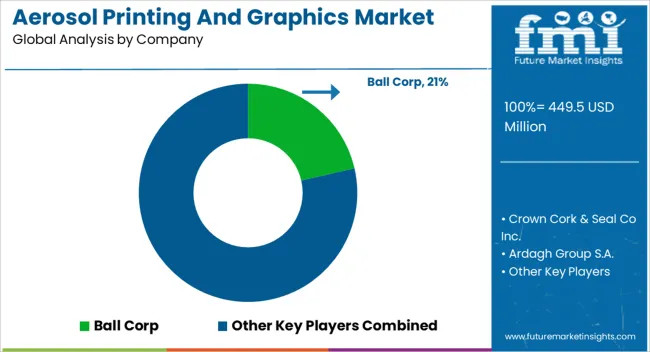
Some of the key participants present in the global aerosol printing and graphics market are Optomec Inc., Nofrill, AMFG, Ball Corp, Crown Cork and Seal Co Inc., Ardagh Group S.A., Montebello Packaging Inc., CCL Container (Hermitage), Inc., EXAL Corporation, etc. among others.

Attributed to the presence of such a high number of participants, the market is highly competitive. While global players such as Ball Corp, Crown Cork and Seal Co Inc, Ardagh Group S.A account for considerable market size, several regional level players are also operating across key growth regions, particularly in the Asia Pacific.

  • In May 2022- Ball Corporation, announced that it will partner in helping Coldplay advance its commitment to making the Music Of The Spheres World Tour as environmentally beneficial as possible. Ball will provide its infinitely recyclable Ball Aluminum Cup™ to Coldplay's venues across the United States and select venues internationally – helping to reduce waste and strengthen refill and recycling.
  • In November 2021- Ardagh Group announce the acquisition of Consol Holdings Proprietary Limited has been completed. The acquisition, for $1 billion including net debt assumed in Consol, represents a significant inward investment into the South African and other markets in which Consol operates, with a further ZAR 3 billion ($200 million) investment programme in two new furnaces.

Report Scope

Report Attribute Details
Growth Rate CAGR of 4.2% from 2023 to 2033
Expected Market Value (2023) US$ 414 million
Anticipated Forecast Value (2033) US$ 624.7 million
Base Year for Estimation 2022
Historical Data 2018 to 2022
Forecast Period 2023 to 2033
Quantitative Units Revenue in US$ million and CAGR from 2023 to 2033
Report Coverage Revenue Forecast, Company Ranking, Competitive Landscape, Growth Factors, Trends and Pricing Analysis
Segments Covered
  • Printing Technologies
  • Ink Type
  • End Use
  • Region
Regions Covered
  • North America
  • Latin America
  • Europe
  • East Asia
  • South Asia
  • Oceania
  • Middle East and Africa
Key Countries Profiled
  • United States
  • Canada
  • Mexico
  • Brazil
  • Argentina
  • Chile
  • Peru
  • Germany
  • Italy
  • United Kingdom
  • Spain
  • France
  • Nordic
  • Russia
  • BENELUX
  • Poland
  • China
  • Thailand
  • Malaysia
  • Indonesia
  • Australia
  • New Zealand
  • Japan
  • South Korea
  • GCC
  • South Africa
  • Turkey
Key Companies Profiled
  • Ball Corp
  • Crown Cork and Seal Co Inc.
  • Ardagh Group S.A.
  • Montebello Packaging Inc.
  • CCL Container (Hermitage) Inc.
  • EXAL Corporation
  • Optomec Inc.
  • Nofrill
  • AMFG
Customization Available Upon Request

Key Segments Profiled in the Aerosol Printing and Graphics Industry

By Printing Technologies:

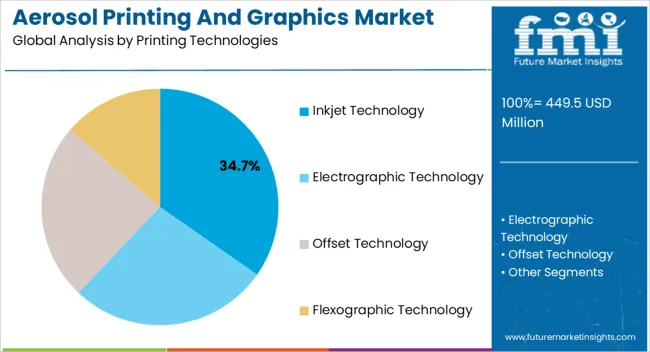
  • Inkjet Technology
  • Electrographic Technology
  • Offset Technology
  • Flexographic Technology

By Ink Type:

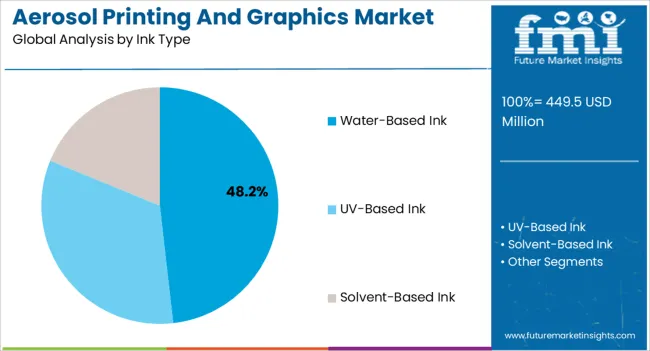
  • Water-based Ink
  • UV-based Ink
  • Solvent-based Ink

By End Use:

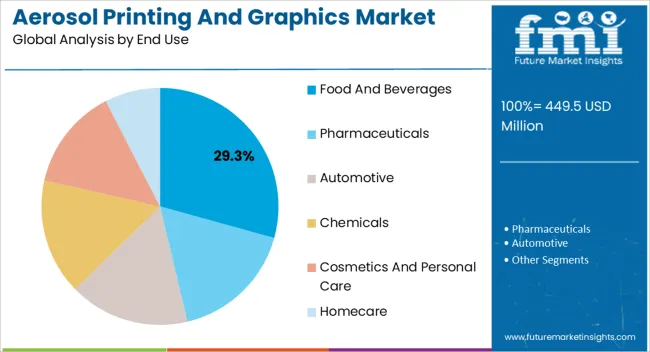
  • Food and Beverages
  • Pharmaceuticals
  • Automotive
  • Chemicals
  • Cosmetics and Personal Care
  • Homecare

By Region:

  • North America
  • Latin America
  • Europe
  • East Asia
  • South Asia
  • Oceania
  • Middle East and Africa

Frequently Asked Questions

What is the Current Market Size of the Aerosol Printing And Graphics Industry?

The current market size of the aerosol printing and graphics industry is US$ 414 million in 2023.

What is the Projected Future Outlook for the Aerosol Printing And Graphics Market?

The aerosol printing and graphics market is anticipated to experience a CAGR of 4.2%, propelling it toward a valuation of US$ 624.7 million by 2033.

Which Region Holds the Dominant Position in the Aerosol Printing And Graphics Market?

North America commands the dominant position in the aerosol printing and graphics market, driven by its innovative packaging and branding demands.

Which Segment is Currently the Dominant one within the Aerosol Printing And Graphics Market by Printing Technologies?

Inkjet printing technology presently dominates the aerosol printing and graphics market, fueled by its versatility, precision, and high-resolution output.

What are the Key Factors Contributing to the Growth of the Aerosol Printing And Graphics Market?

Rising sustainability focus, adoption in promotional campaigns, and evolving customization trends are driving the aerosol printing and graphics market growth.

Table of Content
1. Executive Summary
    1.1. Global Market Outlook
    1.2. Demand-side Trends
    1.3. Supply-side Trends
    1.4. Technology Roadmap Analysis
    1.5. Analysis and Recommendations
2. Market Overview
    2.1. Market Coverage / Taxonomy
    2.2. Market Definition / Scope / Limitations
3. Market Background
    3.1. Market Dynamics
        3.1.1. Drivers
        3.1.2. Restraints
        3.1.3. Opportunity
        3.1.4. Trends
    3.2. Scenario Forecast
        3.2.1. Demand in Optimistic Scenario
        3.2.2. Demand in Likely Scenario
        3.2.3. Demand in Conservative Scenario
    3.3. Opportunity Map Analysis
    3.4. Investment Feasibility Matrix
    3.5. PESTLE and Porter’s Analysis
    3.6. Regulatory Landscape
        3.6.1. By Key Regions
        3.6.2. By Key Countries
    3.7. Regional Parent Market Outlook
4. Global Market Analysis 2018 to 2022 and Forecast, 2023 to 2033
    4.1. Historical Market Size Value (US$ Million) Analysis, 2018 to 2022
    4.2. Current and Future Market Size Value (US$ Million) Projections, 2023 to 2033
        4.2.1. Y-o-Y Growth Trend Analysis
        4.2.2. Absolute $ Opportunity Analysis
5. Global Market Analysis 2018 to 2022 and Forecast 2023 to 2033, By Printing Technologies
    5.1. Introduction / Key Findings
    5.2. Historical Market Size Value (US$ Million) Analysis By Printing Technologies, 2018 to 2022
    5.3. Current and Future Market Size Value (US$ Million) Analysis and Forecast By Printing Technologies, 2023 to 2033
        5.3.1. Inkjet
        5.3.2. Electrographic
        5.3.3. Offset
        5.3.4. Flexographic
    5.4. Y-o-Y Growth Trend Analysis By Printing Technologies, 2018 to 2022
    5.5. Absolute $ Opportunity Analysis By Printing Technologies, 2023 to 2033
6. Global Market Analysis 2018 to 2022 and Forecast 2023 to 2033, By Ink Type
    6.1. Introduction / Key Findings
    6.2. Historical Market Size Value (US$ Million) Analysis By Ink Type, 2018 to 2022
    6.3. Current and Future Market Size Value (US$ Million) Analysis and Forecast By Ink Type, 2023 to 2033
        6.3.1. Water-based
        6.3.2. UV-based
        6.3.3. Solvent-based
    6.4. Y-o-Y Growth Trend Analysis By Ink Type, 2018 to 2022
    6.5. Absolute $ Opportunity Analysis By Ink Type, 2023 to 2033
7. Global Market Analysis 2018 to 2022 and Forecast 2023 to 2033, By End Use 
    7.1. Introduction / Key Findings
    7.2. Historical Market Size Value (US$ Million) Analysis By End Use, 2018 to 2022
    7.3. Current and Future Market Size Value (US$ Million) Analysis and Forecast By End Use, 2023 to 2033
        7.3.1. Food & Beverages
        7.3.2. Pharmaceuticals
        7.3.3. Automotive
        7.3.4. Chemicals
        7.3.5. Cosmetics & Personal Care
        7.3.6. Homecare
    7.4. Y-o-Y Growth Trend Analysis By End Use, 2018 to 2022
    7.5. Absolute $ Opportunity Analysis By End Use, 2023 to 2033
8. Global Market Analysis 2018 to 2022 and Forecast 2023 to 2033, By Region
    8.1. Introduction
    8.2. Historical Market Size Value (US$ Million) Analysis By Region, 2018 to 2022
    8.3. Current Market Size Value (US$ Million) Analysis and Forecast By Region, 2023 to 2033
        8.3.1. North America
        8.3.2. Latin America
        8.3.3. Western Europe
        8.3.4. Eastern Europe
        8.3.5. South Asia and Pacific
        8.3.6. East Asia
        8.3.7. Middle East and Africa
    8.4. Market Attractiveness Analysis By Region
9. North America Market Analysis 2018 to 2022 and Forecast 2023 to 2033, By Country
    9.1. Historical Market Size Value (US$ Million) Trend Analysis By Market Taxonomy, 2018 to 2022
    9.2. Market Size Value (US$ Million) Forecast By Market Taxonomy, 2023 to 2033
        9.2.1. By Country
            9.2.1.1. USA
            9.2.1.2. Canada
        9.2.2. By Printing Technologies
        9.2.3. By Ink Type
        9.2.4. By End Use
    9.3. Market Attractiveness Analysis
        9.3.1. By Country
        9.3.2. By Printing Technologies
        9.3.3. By Ink Type
        9.3.4. By End Use
    9.4. Key Takeaways
10. Latin America Market Analysis 2018 to 2022 and Forecast 2023 to 2033, By Country
    10.1. Historical Market Size Value (US$ Million) Trend Analysis By Market Taxonomy, 2018 to 2022
    10.2. Market Size Value (US$ Million) Forecast By Market Taxonomy, 2023 to 2033
        10.2.1. By Country
            10.2.1.1. Brazil
            10.2.1.2. Mexico
            10.2.1.3. Rest of Latin America
        10.2.2. By Printing Technologies
        10.2.3. By Ink Type
        10.2.4. By End Use
    10.3. Market Attractiveness Analysis
        10.3.1. By Country
        10.3.2. By Printing Technologies
        10.3.3. By Ink Type
        10.3.4. By End Use
    10.4. Key Takeaways
11. Western Europe Market Analysis 2018 to 2022 and Forecast 2023 to 2033, By Country
    11.1. Historical Market Size Value (US$ Million) Trend Analysis By Market Taxonomy, 2018 to 2022
    11.2. Market Size Value (US$ Million) Forecast By Market Taxonomy, 2023 to 2033
        11.2.1. By Country
            11.2.1.1. Germany
            11.2.1.2. UK
            11.2.1.3. France
            11.2.1.4. Spain
            11.2.1.5. Italy
            11.2.1.6. Rest of Western Europe
        11.2.2. By Printing Technologies
        11.2.3. By Ink Type
        11.2.4. By End Use
    11.3. Market Attractiveness Analysis
        11.3.1. By Country
        11.3.2. By Printing Technologies
        11.3.3. By Ink Type
        11.3.4. By End Use
    11.4. Key Takeaways
12. Eastern Europe Market Analysis 2018 to 2022 and Forecast 2023 to 2033, By Country
    12.1. Historical Market Size Value (US$ Million) Trend Analysis By Market Taxonomy, 2018 to 2022
    12.2. Market Size Value (US$ Million) Forecast By Market Taxonomy, 2023 to 2033
        12.2.1. By Country
            12.2.1.1. Poland
            12.2.1.2. Russia
            12.2.1.3. Czech Republic
            12.2.1.4. Romania
            12.2.1.5. Rest of Eastern Europe
        12.2.2. By Printing Technologies
        12.2.3. By Ink Type
        12.2.4. By End Use
    12.3. Market Attractiveness Analysis
        12.3.1. By Country
        12.3.2. By Printing Technologies
        12.3.3. By Ink Type
        12.3.4. By End Use
    12.4. Key Takeaways
13. South Asia and Pacific Market Analysis 2018 to 2022 and Forecast 2023 to 2033, By Country
    13.1. Historical Market Size Value (US$ Million) Trend Analysis By Market Taxonomy, 2018 to 2022
    13.2. Market Size Value (US$ Million) Forecast By Market Taxonomy, 2023 to 2033
        13.2.1. By Country
            13.2.1.1. India
            13.2.1.2. Bangladesh
            13.2.1.3. Australia
            13.2.1.4. New Zealand
            13.2.1.5. Rest of South Asia and Pacific
        13.2.2. By Printing Technologies
        13.2.3. By Ink Type
        13.2.4. By End Use
    13.3. Market Attractiveness Analysis
        13.3.1. By Country
        13.3.2. By Printing Technologies
        13.3.3. By Ink Type
        13.3.4. By End Use
    13.4. Key Takeaways
14. East Asia Market Analysis 2018 to 2022 and Forecast 2023 to 2033, By Country
    14.1. Historical Market Size Value (US$ Million) Trend Analysis By Market Taxonomy, 2018 to 2022
    14.2. Market Size Value (US$ Million) Forecast By Market Taxonomy, 2023 to 2033
        14.2.1. By Country
            14.2.1.1. China
            14.2.1.2. Japan
            14.2.1.3. South Korea
        14.2.2. By Printing Technologies
        14.2.3. By Ink Type
        14.2.4. By End Use
    14.3. Market Attractiveness Analysis
        14.3.1. By Country
        14.3.2. By Printing Technologies
        14.3.3. By Ink Type
        14.3.4. By End Use
    14.4. Key Takeaways
15. Middle East and Africa Market Analysis 2018 to 2022 and Forecast 2023 to 2033, By Country
    15.1. Historical Market Size Value (US$ Million) Trend Analysis By Market Taxonomy, 2018 to 2022
    15.2. Market Size Value (US$ Million) Forecast By Market Taxonomy, 2023 to 2033
        15.2.1. By Country
            15.2.1.1. GCC Countries
            15.2.1.2. South Africa
            15.2.1.3. Israel
            15.2.1.4. Rest of MEA
        15.2.2. By Printing Technologies
        15.2.3. By Ink Type
        15.2.4. By End Use
    15.3. Market Attractiveness Analysis
        15.3.1. By Country
        15.3.2. By Printing Technologies
        15.3.3. By Ink Type
        15.3.4. By End Use
    15.4. Key Takeaways
16. Key Countries Market Analysis
    16.1. USA
        16.1.1. Pricing Analysis
        16.1.2. Market Share Analysis, 2022
            16.1.2.1. By Printing Technologies
            16.1.2.2. By Ink Type
            16.1.2.3. By End Use
    16.2. Canada
        16.2.1. Pricing Analysis
        16.2.2. Market Share Analysis, 2022
            16.2.2.1. By Printing Technologies
            16.2.2.2. By Ink Type
            16.2.2.3. By End Use
    16.3. Brazil
        16.3.1. Pricing Analysis
        16.3.2. Market Share Analysis, 2022
            16.3.2.1. By Printing Technologies
            16.3.2.2. By Ink Type
            16.3.2.3. By End Use
    16.4. Mexico
        16.4.1. Pricing Analysis
        16.4.2. Market Share Analysis, 2022
            16.4.2.1. By Printing Technologies
            16.4.2.2. By Ink Type
            16.4.2.3. By End Use
    16.5. Germany
        16.5.1. Pricing Analysis
        16.5.2. Market Share Analysis, 2022
            16.5.2.1. By Printing Technologies
            16.5.2.2. By Ink Type
            16.5.2.3. By End Use
    16.6. UK
        16.6.1. Pricing Analysis
        16.6.2. Market Share Analysis, 2022
            16.6.2.1. By Printing Technologies
            16.6.2.2. By Ink Type
            16.6.2.3. By End Use
    16.7. France
        16.7.1. Pricing Analysis
        16.7.2. Market Share Analysis, 2022
            16.7.2.1. By Printing Technologies
            16.7.2.2. By Ink Type
            16.7.2.3. By End Use
    16.8. Spain
        16.8.1. Pricing Analysis
        16.8.2. Market Share Analysis, 2022
            16.8.2.1. By Printing Technologies
            16.8.2.2. By Ink Type
            16.8.2.3. By End Use
    16.9. Italy
        16.9.1. Pricing Analysis
        16.9.2. Market Share Analysis, 2022
            16.9.2.1. By Printing Technologies
            16.9.2.2. By Ink Type
            16.9.2.3. By End Use
    16.10. Poland
        16.10.1. Pricing Analysis
        16.10.2. Market Share Analysis, 2022
            16.10.2.1. By Printing Technologies
            16.10.2.2. By Ink Type
            16.10.2.3. By End Use
    16.11. Russia
        16.11.1. Pricing Analysis
        16.11.2. Market Share Analysis, 2022
            16.11.2.1. By Printing Technologies
            16.11.2.2. By Ink Type
            16.11.2.3. By End Use
    16.12. Czech Republic
        16.12.1. Pricing Analysis
        16.12.2. Market Share Analysis, 2022
            16.12.2.1. By Printing Technologies
            16.12.2.2. By Ink Type
            16.12.2.3. By End Use
    16.13. Romania
        16.13.1. Pricing Analysis
        16.13.2. Market Share Analysis, 2022
            16.13.2.1. By Printing Technologies
            16.13.2.2. By Ink Type
            16.13.2.3. By End Use
    16.14. India
        16.14.1. Pricing Analysis
        16.14.2. Market Share Analysis, 2022
            16.14.2.1. By Printing Technologies
            16.14.2.2. By Ink Type
            16.14.2.3. By End Use
    16.15. Bangladesh
        16.15.1. Pricing Analysis
        16.15.2. Market Share Analysis, 2022
            16.15.2.1. By Printing Technologies
            16.15.2.2. By Ink Type
            16.15.2.3. By End Use
    16.16. Australia
        16.16.1. Pricing Analysis
        16.16.2. Market Share Analysis, 2022
            16.16.2.1. By Printing Technologies
            16.16.2.2. By Ink Type
            16.16.2.3. By End Use
    16.17. New Zealand
        16.17.1. Pricing Analysis
        16.17.2. Market Share Analysis, 2022
            16.17.2.1. By Printing Technologies
            16.17.2.2. By Ink Type
            16.17.2.3. By End Use
    16.18. China
        16.18.1. Pricing Analysis
        16.18.2. Market Share Analysis, 2022
            16.18.2.1. By Printing Technologies
            16.18.2.2. By Ink Type
            16.18.2.3. By End Use
    16.19. Japan
        16.19.1. Pricing Analysis
        16.19.2. Market Share Analysis, 2022
            16.19.2.1. By Printing Technologies
            16.19.2.2. By Ink Type
            16.19.2.3. By End Use
    16.20. South Korea
        16.20.1. Pricing Analysis
        16.20.2. Market Share Analysis, 2022
            16.20.2.1. By Printing Technologies
            16.20.2.2. By Ink Type
            16.20.2.3. By End Use
    16.21. GCC Countries
        16.21.1. Pricing Analysis
        16.21.2. Market Share Analysis, 2022
            16.21.2.1. By Printing Technologies
            16.21.2.2. By Ink Type
            16.21.2.3. By End Use
    16.22. South Africa
        16.22.1. Pricing Analysis
        16.22.2. Market Share Analysis, 2022
            16.22.2.1. By Printing Technologies
            16.22.2.2. By Ink Type
            16.22.2.3. By End Use
    16.23. Israel
        16.23.1. Pricing Analysis
        16.23.2. Market Share Analysis, 2022
            16.23.2.1. By Printing Technologies
            16.23.2.2. By Ink Type
            16.23.2.3. By End Use
17. Market Structure Analysis
    17.1. Competition Dashboard
    17.2. Competition Benchmarking
    17.3. Market Share Analysis of Top Players
        17.3.1. By Regional
        17.3.2. By Printing Technologies
        17.3.3. By Ink Type
        17.3.4. By End Use
18. Competition Analysis
    18.1. Competition Deep Dive
        18.1.1. Ball Corp
            18.1.1.1. Overview
            18.1.1.2. Product Portfolio
            18.1.1.3. Profitability by Market Segments
            18.1.1.4. Sales Footprint
            18.1.1.5. Strategy Overview
                18.1.1.5.1. Marketing Strategy
        18.1.2. Crown Cork & Seal Co Inc.
            18.1.2.1. Overview
            18.1.2.2. Product Portfolio
            18.1.2.3. Profitability by Market Segments
            18.1.2.4. Sales Footprint
            18.1.2.5. Strategy Overview
                18.1.2.5.1. Marketing Strategy
        18.1.3. Ardagh Group S.A.
            18.1.3.1. Overview
            18.1.3.2. Product Portfolio
            18.1.3.3. Profitability by Market Segments
            18.1.3.4. Sales Footprint
            18.1.3.5. Strategy Overview
                18.1.3.5.1. Marketing Strategy
        18.1.4. Montebello Packaging Inc.
            18.1.4.1. Overview
            18.1.4.2. Product Portfolio
            18.1.4.3. Profitability by Market Segments
            18.1.4.4. Sales Footprint
            18.1.4.5. Strategy Overview
                18.1.4.5.1. Marketing Strategy
        18.1.5. CCL Container (Hermitage) Inc.
            18.1.5.1. Overview
            18.1.5.2. Product Portfolio
            18.1.5.3. Profitability by Market Segments
            18.1.5.4. Sales Footprint
            18.1.5.5. Strategy Overview
                18.1.5.5.1. Marketing Strategy
        18.1.6. EXAL Corporation
            18.1.6.1. Overview
            18.1.6.2. Product Portfolio
            18.1.6.3. Profitability by Market Segments
            18.1.6.4. Sales Footprint
            18.1.6.5. Strategy Overview
                18.1.6.5.1. Marketing Strategy
        18.1.7. Optomec Inc.
            18.1.7.1. Overview
            18.1.7.2. Product Portfolio
            18.1.7.3. Profitability by Market Segments
            18.1.7.4. Sales Footprint
            18.1.7.5. Strategy Overview
                18.1.7.5.1. Marketing Strategy
        18.1.8. Nofrill
            18.1.8.1. Overview
            18.1.8.2. Product Portfolio
            18.1.8.3. Profitability by Market Segments
            18.1.8.4. Sales Footprint
            18.1.8.5. Strategy Overview
                18.1.8.5.1. Marketing Strategy
        18.1.9. AMFG
            18.1.9.1. Overview
            18.1.9.2. Product Portfolio
            18.1.9.3. Profitability by Market Segments
            18.1.9.4. Sales Footprint
            18.1.9.5. Strategy Overview
                18.1.9.5.1. Marketing Strategy
        18.1.10. The Valspar Corporation
            18.1.10.1. Overview
            18.1.10.2. Product Portfolio
            18.1.10.3. Profitability by Market Segments
            18.1.10.4. Sales Footprint
            18.1.10.5. Strategy Overview
                18.1.10.5.1. Marketing Strategy
19. Assumptions & Acronyms Used
20. Research Methodology
Recommendations

Packaging

Digital Label Printing Market

August 2023

REP-GB-2102

333 pages

Packaging

Inkjet Printers Market

June 2023

REP-GB-5306

270 pages

Explore Packaging Insights

View Reports
Future Market Insights

Aerosol Printing And Graphics Market

Schedule a Call