Aerosol Packaging Market Outlook

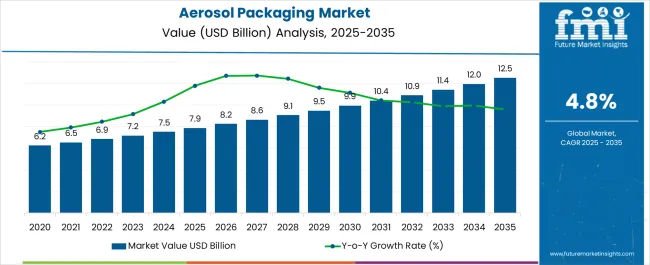
The aerosol packaging market size is projected to be valued at US$ 7.5 billion in 2024 and is expected to rise to US$ 12.3 billion by 2034. The global aerosol packaging market is expected to grow at a rate of 5.0% during the forecast period. In 2023, the market was valued at US$ 7.2 billion.

Attributes Key Statistics
Base Year Value (2024) US$ 7.5 billion
Forecast Value (2034) US$ 12.3 billion
Estimated Growth (2024 to 2034) 5.0% CAGR

Don't pay for what you don't need

Customize your report by selecting specific countries or regions and save 30%!

Consumption Analysis of the Aerosol Packaging Market

  • Cosmetic companies across the world form one of the leading consumer groups for the aerosol packaging market. They utilize aerosol packaging solutions for deodorants, hairsprays, shaving creams, hair mousses, sunscreens, body sprays, etc.
  • Cleaning product manufacturers also use aerosol packaging to manufacture air fresheners, insect repellents, cleaning sprays, furniture polishes, and specialty household products.
  • Apart from these, pharmaceutical companies use aerosol packaging in containerizing inhalers, topical sprays, ointments, pain relievers, nasal sprays, sanitizers, medical disinfectants, and pharmaceutical formulations.
  • Automotive product manufacturers also contribute significantly to the overall market for aerosol packaging. They use this methodology in the encasement of automotive lubricants, tire inflators, rust inhibitors, etc.
  • Aerosol packaging also finds its applications in the electronics industry. Technology companies use aerosol packaging in aerosolized electronic cleaning products and contact cleaners.

Historical Analysis of the Aerosol Packaging Market

The aerosol packaging market heavily relies on consumer demand for goods across different industries. Trends in various industries, such as food and beverage, pharmaceuticals, personal care, e-commerce, etc., also influence the global market. Economic factors, like GDP growth, inflation rates, and unemployment, also play a crucial role in the overall growth of the aerosol packaging market, as these conditions decide the fate of manufacturing industries across the world.

In the last few years, the market for aerosol packaging has seen a series of ups and downs. During the pandemic, as the world faced shutdowns, the manufacturing units worldwide had to cease their operations. This had a negative impact on the aerosol packaging market. However, the incorporation of aerosol containers in the packaging of disinfectants, sanitizers, nasal sprays, etc., rapidly lifted the growth rate.

Post-pandemic, as the world got accustomed to the new normal, the e-commerce sector gained substantial traction in developing and underdeveloped nations. The heightened focus on hygiene and safety during the pandemic also increased the demand for packaging in the healthcare sector. All these factors have collectively led to a stable growth rate in recent years. With technological innovations in this field, the market will have a promising future in the coming years.

Attributes Key Statistics
Market Size (2019) US$ 6.7 billion
Market Value (2023) US$ 7.2 billion
CAGR (2019 to 2023) 7.46%
Ismail Sutaria
Ismail Sutaria

Principal Consultant

Talk to Analyst

Find your sweet spots for generating winning opportunities in this market.

Restraining Factors Adversely Affecting the Aerosol Packaging Market

  • Traditional propellants, such as hydrofluorocarbons (HFCs) and chlorofluorocarbons (CFCs), remain a key challenge in this market due to their contribution to ozone depletion and greenhouse gas emissions.
  • Aerosol cans, if not disposed of properly, can generate a lot of waste, which can cause tremendous harm to the vegetation and soil due to their non-biodegradable nature. This can deter eco-conscious consumers from buying the products.
  • The installation of highly advanced aerosol packaging technologies can incur higher initial costs for manufacturers. This investment becomes one of the most significant hurdles for smaller companies with limited financial resources.
  • The aerosol packaging industry faces rigorous competition from alternative packaging solutions, such as pump sprays, roll-ons, or solid forms, in various industries. This can divert demand away from traditional aerosol packaging.
  • The packaging industry is filled with misconceptions and negative perceptions about aerosol products, particularly in terms of safety, environmental impact, or association with harmful chemicals. This can negatively impact the market growth.

Category-wise Insights

Bottles Continue their Dominance in the Aerosol Packaging Market

Attributes Details
Product Type Bottles
Market share 45.30%

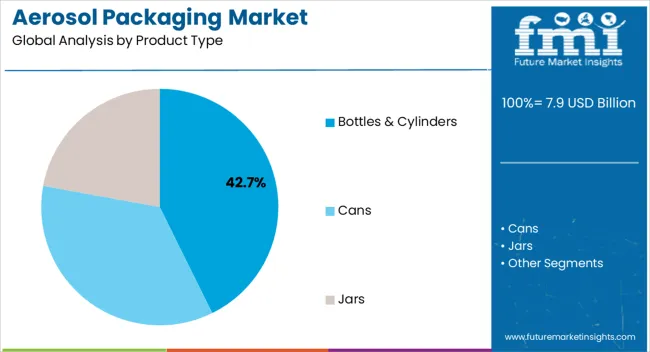
Aerosol products generally consist of liquids, and there is no alternative to bottles that effectively store and dispense the content in the container. The increasing demand for bottles in the aerosol products industry is attributed to their flexibility, catering to diverse applications, spanning from personal care items such as hairsprays and deodorants to household products like air fresheners and cleaning sprays.

On the basis of product type, bottles dominate the global aerosol packaging market with a remarkable share of 45.30%. Bottles are also demanded substantially in the international marketplace because of their capability to offer a high degree of customization and branding opportunities. The labeling and printing options available on bottles facilitate effective branding strategies, enabling companies to create visually appealing and recognizable packaging for their aerosol products.

Aerosol Packaging Solutions Finds its Place in the Personal Care and Cosmetics Industry

Attributes Details
End User Personal Care and Cosmetics
Market share 40.40%

Post-pandemic, the personal care and cosmetics industry has been growing at an exponential rate. Aerosol packaging solutions have firmly established their place in the personal care and cosmetics industry due to their convenience, efficiency, and innovative applications. The surging significance of aerosol packaging solutions in the manufacturing of personal care products, such as deodorants, hairsprays, and cosmetic sprays, has contributed considerably to global market revenue.

Based on end users, the personal care and cosmetics industry dominates the aerosol packaging market with a whopping share of 40.4%. The demand for aerosol packaging solutions in these industries is also because certain products, like hair sprays, utilize aerosol packaging for its ability to deliver fine and even mists, ensuring uniform application and optimal styling results.

Get the data you need at a Fraction of the cost

Personalize your report by choosing insights you need
and save 40%!

Country-wise Insights

The section provides an analysis of the aerosol packaging market by countries, including China, India, the United Kingdom, Thailand, and South Korea. The table presents the CAGR for each country, indicating the expected market growth in that country through 2034.

Countries CAGR
India 7.70%
China 6.80%
Thailand 6.60%
South Korea 5.90%
The United Kingdom 4.50%

Aerosol Packaging Market in India

The India aerosol packaging market is anticipated to retain its dominance by progressing at an annual growth rate of 7.70% till 2034.

The booming e-commerce industry in India has significantly contributed to the growth of the aerosol packaging market. The need for secure and efficient packaging for the safety of products, ranging from beauty and personal care items to household goods, during transit has fuelled the market growth for aerosol packaging solutions. Besides this, the rising disposable income of the Indian middle class has increased consumer spending on a variety of products with sophisticated packaging, such as aerosols.

Aerosol Packaging Market in China

China is another Asian country that is leading this market. Over the next ten years, the demand for aerosol packaging solutions in China is projected to rise at a 6.80% CAGR.

Growing environmental awareness in China has resulted in a shift towards sustainable packaging solutions. To respond to this demand of eco-conscious consumers, manufacturing units are developing eco-friendly alternatives for packaging, such as recyclable materials and propellant innovations. China’s rapid urbanization and evolving lifestyle have also led to the demand for convenient and on-the-go cosmetics, which are packaged using this methodology.

Aerosol Packaging Market in Thailand

In the ASEAN region, Thailand leads the market for aerosol packaging solutions. The market in Thailand is poised to showcase a 6.60% advancement per year from 2024 to 2034.

Thailand is renowned for its robust tourism and hospitality sector in the entire world. Millions of tourists from all over the world flock to the country annually. These tourists often require travel-sized personal care products, such as perfumes, hair sprays, sanitizers, etc. Aerosol-packed containers are the perfect choice for these products, fuelling the overall market.
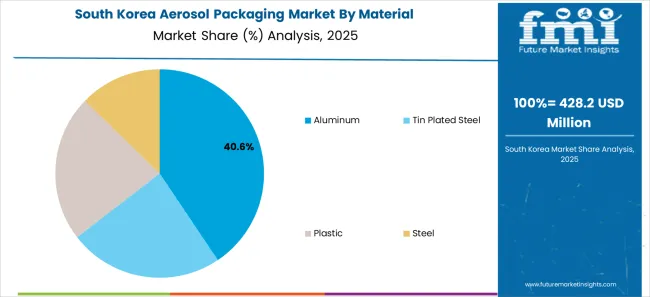
Aerosol Packaging Market in South Korea

The South Korean aerosol packaging market is anticipated to register a CAGR of 5.90% through 2034.

South Korea is a global hub for beauty and skincare innovations. The aerosol packaging market has significantly benefited from the popularity of K-beauty trends. The aerosol packaging methodology is commonly used in the packaging of innovative skincare and cosmetic products, contributing to its growth in the country.

Aerosol Packaging Market in the United Kingdom

In Europe, the United Kingdom aerosol packaging market is anticipated to register a CAGR of 4.50% through 2034.

The United Kingdom is home to the well-to-do population in the world. There is a great demand for premium cosmetics and luxury goods in the domestic market. Aerosol packaging is gaining a lot of impetus in the United Kingdom, as it allows brands to create visually appealing and unique products, enhancing their market presence in a competitive landscape.
Competitive Landscape

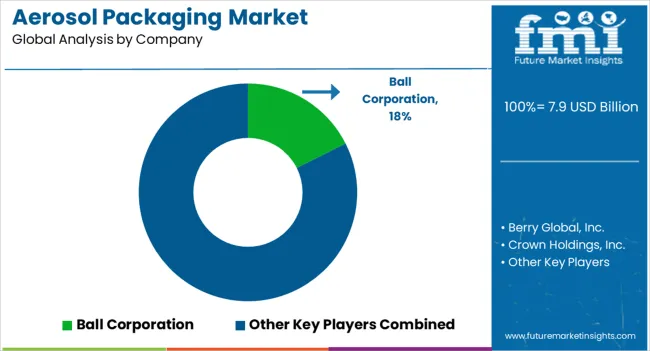
The market for aerosol packaging is filled with numerous players, such as Berry Global Inc., Crown Holdings Inc., Ball Corporation, etc. These companies dominate the majority share of the global market valuation. The said players have a strong foothold and have gained a loyal consumer base. The market is already saturated in terms of innovations. Small brands, though, find it very challenging to sustain in this cut-throat competition due to lower profit margins, limited financial resources, and restricted market expertise.

Recent Developments

  • In 2023, Berry Global Group, Inc., a prominent aerosol packaging company, successfully announced its commitment to achieving net-zero emissions across its global operations and value chain by 2050.
  • In 2023, Novelis Inc. entered into a long-term agreement with Ball Corporation for the supply of aluminum beverage can sheets. Under the contract, Novelis will supply aluminum sheets to Ball Corporation's can-making facilities in North America.
  • Aptar Pharma, a division of AptarGroup, Inc., released APF Futurity, its inaugural metal-free, multi-dose nasal spray pump designed for dispensing nasal saline and similar over-the-counter formulations.

Key Companies in this Market

  • Berry Global, Inc.
  • Crown Holdings, Inc.
  • Ball Corporation
  • CCL Industries Inc.
  • Aptar Group Inc.
  • Silgan Holdings Inc.
  • Montebello Packaging Inc.
  • Exal Corporation
  • Graham Packaging Company
  • Allied Cans Limited
  • Euro Asia Packaging
  • Nampak Ltd.
  • ARYUM Metal
  • TUBEX GmbH
  • Bharat Containers

Key Segments Covered in Aerosol Packaging Industry Research

By Product Type:

  • Cans
  • Bottles & Cylinders
  • Jars

By Material:

  • Aluminum
  • Tin Plated Steel
  • Plastic
  • Steel

By Cap Type:

  • Actuators
  • Trigger Sprayer
  • Fine Mist Sprayer
  • Other Dispensing Caps

By End User:

  • Food and Beverages
  • Personal Care & Cosmetics
  • Aerated Desserts
    • Non-dairy Whipping Creams
    • Edible Oils
    • Salad Dressings
    • Coffee Enhancers
    • Milk Taste Modifiers
    • Cocktail Foam Toppings
    • Others (Coconut Whipped Topping, etc.)
  • Home Care
  • Others (Pharmaceuticals, etc.)

By Region:

  • North America
  • Latin America
  • Europe
  • The Middle East and Africa (MEA)
  • Asia Pacific

Frequently Asked Questions

How Much is the Aerosol Packaging Market Currently Worth?

The global aerosol packaging market is expected to be worth US$ 7.5 billion in 2024.

What is the Sales Forecast for Aerosol Packaging through 2034?

The market for aerosol packaging is expected to reach US$ 12.3 billion by 2034.

At What Rate Is the Aerosol Packaging Market Growing Across the World?

The aerosol packaging market is growing at a rate of 5.0% through 2034.

Who are the Key Manufacturing Companies for Aerosol Packaging?

Berry Global, Inc., Crown Holdings, Inc., and Exal Corporation are key players in the market.

Which is the Widely Preferred Product Type in the Aerosol Packaging Market?

Bottles are the preferred product type in the aerosol packaging market, with a share of 45.3%.

Table of Content
1. Executive Summary
    1.1. Global Market Outlook
    1.2. Demand-side Trends
    1.3. Supply-side Trends
    1.4. Technology Roadmap Analysis
    1.5. Analysis and Recommendations
2. Market Overview
    2.1. Market Coverage / Taxonomy
    2.2. Market Definition / Scope / Limitations
3. Market Background
    3.1. Market Dynamics
        3.1.1. Drivers
        3.1.2. Restraints
        3.1.3. Opportunity
        3.1.4. Trends
    3.2. Scenario Forecast
        3.2.1. Demand in Optimistic Scenario
        3.2.2. Demand in Likely Scenario
        3.2.3. Demand in Conservative Scenario
    3.3. Opportunity Map Analysis
    3.4. Product Life Cycle Analysis
    3.5. Supply Chain Analysis
        3.5.1. Supply Side Participants and their Roles
            3.5.1.1. Producers
            3.5.1.2. Mid-Level Participants (Traders/ Agents/ Brokers)
            3.5.1.3. Wholesalers and Distributors
        3.5.2. Value Added and Value Created at Node in the Supply Chain
        3.5.3. List of Raw Material Suppliers
        3.5.4. List of Existing and Potential Buyer’s
    3.6. Investment Feasibility Matrix
    3.7. Value Chain Analysis
        3.7.1. Profit Margin Analysis
        3.7.2. Wholesalers and Distributors
        3.7.3. Retailers
    3.8. PESTLE and Porter’s Analysis
    3.9. Regulatory Landscape
        3.9.1. By Key Regions
        3.9.2. By Key Countries
    3.10. Regional Parent Market Outlook
    3.11. Production and Consumption Statistics
    3.12. Import and Export Statistics
4. Global Market Analysis 2019 to 2023 and Forecast, 2024 to 2034
    4.1. Historical Market Size Value (US$ Million) & Volume (Units) Analysis, 2019 to 2023
    4.2. Current and Future Market Size Value (US$ Million) & Volume (Units) Projections, 2024 to 2034
        4.2.1. Y-o-Y Growth Trend Analysis
        4.2.2. Absolute $ Opportunity Analysis
5. Global Market Analysis 2019 to 2023 and Forecast 2024 to 2034, By Product Type
    5.1. Introduction / Key Findings
    5.2. Historical Market Size Value (US$ Million) & Volume (Units) Analysis By Product Type, 2019 to 2023
    5.3. Current and Future Market Size Value (US$ Million) & Volume (Units) Analysis and Forecast By Product Type, 2024 to 2034
        5.3.1. Cans
        5.3.2. Bottles & Cylinders
        5.3.3. Jars
    5.4. Y-o-Y Growth Trend Analysis By Product Type, 2019 to 2023
    5.5. Absolute $ Opportunity Analysis By Product Type, 2024 to 2034
6. Global Market Analysis 2019 to 2023 and Forecast 2024 to 2034, By Material
    6.1. Introduction / Key Findings
    6.2. Historical Market Size Value (US$ Million) & Volume (Units) Analysis By Material, 2019 to 2023
    6.3. Current and Future Market Size Value (US$ Million) & Volume (Units) Analysis and Forecast By Material, 2024 to 2034
        6.3.1. Aluminium
        6.3.2. Tin Plated Steel
        6.3.3. Plastic
        6.3.4. Metal
    6.4. Y-o-Y Growth Trend Analysis By Material, 2019 to 2023
    6.5. Absolute $ Opportunity Analysis By Material, 2024 to 2034
7. Global Market Analysis 2019 to 2023 and Forecast 2024 to 2034, By Cap Type
    7.1. Introduction / Key Findings
    7.2. Historical Market Size Value (US$ Million) & Volume (Units) Analysis By Cap Type, 2019 to 2023
    7.3. Current and Future Market Size Value (US$ Million) & Volume (Units) Analysis and Forecast By Cap Type, 2024 to 2034
        7.3.1. Actuators
        7.3.2. Trigger Sprayer
        7.3.3. Fine Mist Sprayer
        7.3.4. Other Dispensing Caps
    7.4. Y-o-Y Growth Trend Analysis By Cap Type, 2019 to 2023
    7.5. Absolute $ Opportunity Analysis By Cap Type, 2024 to 2034
8. Global Market Analysis 2019 to 2023 and Forecast 2024 to 2034, By Capacity
    8.1. Introduction / Key Findings
    8.2. Historical Market Size Value (US$ Million) & Volume (Units) Analysis By Capacity , 2019 to 2023
    8.3. Current and Future Market Size Value (US$ Million) & Volume (Units) Analysis and Forecast By Capacity , 2024 to 2034
        8.3.1. Up to 100 ml
        8.3.2. 101 to 250 ml
        8.3.3. 251 to 500 ml
        8.3.4. 501 to 1,000 ml
        8.3.5. Above 1,000 ml
    8.4. Y-o-Y Growth Trend Analysis By Capacity , 2019 to 2023
    8.5. Absolute $ Opportunity Analysis By Capacity , 2024 to 2034
9. Global Market Analysis 2019 to 2023 and Forecast 2024 to 2034, By End Use
    9.1. Introduction / Key Findings
    9.2. Historical Market Size Value (US$ Million) & Volume (Units) Analysis By End Use , 2019 to 2023
    9.3. Current and Future Market Size Value (US$ Million) & Volume (Units) Analysis and Forecast By End Use , 2024 to 2034
        9.3.1. Cosmetics & Personal Care
        9.3.2. Deodorants & Perfumes
        9.3.3. Hair Care
        9.3.4. Skin Care
        9.3.5. Food
        9.3.6. Oil
        9.3.7. Dairy
        9.3.8. Sauces
        9.3.9. Chemicals
        9.3.10. Paints & Coatings
        9.3.11. Oil & Lubricants
        9.3.12. Others
    9.4. Y-o-Y Growth Trend Analysis By End Use , 2019 to 2023
    9.5. Absolute $ Opportunity Analysis By End Use , 2024 to 2034
10. Global Market Analysis 2019 to 2023 and Forecast 2024 to 2034, By Region
    10.1. Introduction
    10.2. Historical Market Size Value (US$ Million) & Volume (Units) Analysis By Region, 2019 to 2023
    10.3. Current Market Size Value (US$ Million) & Volume (Units) Analysis and Forecast By Region, 2024 to 2034
        10.3.1. North America
        10.3.2. Latin America
        10.3.3. Western Europe
        10.3.4. Eastern Europe
        10.3.5. South Asia and Pacific
        10.3.6. East Asia
        10.3.7. Middle East and Africa
    10.4. Market Attractiveness Analysis By Region
11. North America Market Analysis 2019 to 2023 and Forecast 2024 to 2034, By Country
    11.1. Historical Market Size Value (US$ Million) & Volume (Units) Trend Analysis By Market Taxonomy, 2019 to 2023
    11.2. Market Size Value (US$ Million) & Volume (Units) Forecast By Market Taxonomy, 2024 to 2034
        11.2.1. By Country
            11.2.1.1. USA
            11.2.1.2. Canada
        11.2.2. By Product Type
        11.2.3. By Material
        11.2.4. By Cap Type
        11.2.5. By Capacity
        11.2.6. By End Use
    11.3. Market Attractiveness Analysis
        11.3.1. By Country
        11.3.2. By Product Type
        11.3.3. By Material
        11.3.4. By Cap Type
        11.3.5. By Capacity
        11.3.6. By End Use
    11.4. Key Takeaways
12. Latin America Market Analysis 2019 to 2023 and Forecast 2024 to 2034, By Country
    12.1. Historical Market Size Value (US$ Million) & Volume (Units) Trend Analysis By Market Taxonomy, 2019 to 2023
    12.2. Market Size Value (US$ Million) & Volume (Units) Forecast By Market Taxonomy, 2024 to 2034
        12.2.1. By Country
            12.2.1.1. Brazil
            12.2.1.2. Mexico
            12.2.1.3. Rest of Latin America
        12.2.2. By Product Type
        12.2.3. By Material
        12.2.4. By Cap Type
        12.2.5. By Capacity
        12.2.6. By End Use
    12.3. Market Attractiveness Analysis
        12.3.1. By Country
        12.3.2. By Product Type
        12.3.3. By Material
        12.3.4. By Cap Type
        12.3.5. By Capacity
        12.3.6. By End Use
    12.4. Key Takeaways
13. Western Europe Market Analysis 2019 to 2023 and Forecast 2024 to 2034, By Country
    13.1. Historical Market Size Value (US$ Million) & Volume (Units) Trend Analysis By Market Taxonomy, 2019 to 2023
    13.2. Market Size Value (US$ Million) & Volume (Units) Forecast By Market Taxonomy, 2024 to 2034
        13.2.1. By Country
            13.2.1.1. Germany
            13.2.1.2. UK
            13.2.1.3. France
            13.2.1.4. Spain
            13.2.1.5. Italy
            13.2.1.6. Rest of Western Europe
        13.2.2. By Product Type
        13.2.3. By Material
        13.2.4. By Cap Type
        13.2.5. By Capacity
        13.2.6. By End Use
    13.3. Market Attractiveness Analysis
        13.3.1. By Country
        13.3.2. By Product Type
        13.3.3. By Material
        13.3.4. By Cap Type
        13.3.5. By Capacity
        13.3.6. By End Use
    13.4. Key Takeaways
14. Eastern Europe Market Analysis 2019 to 2023 and Forecast 2024 to 2034, By Country
    14.1. Historical Market Size Value (US$ Million) & Volume (Units) Trend Analysis By Market Taxonomy, 2019 to 2023
    14.2. Market Size Value (US$ Million) & Volume (Units) Forecast By Market Taxonomy, 2024 to 2034
        14.2.1. By Country
            14.2.1.1. Poland
            14.2.1.2. Russia
            14.2.1.3. Czech Republic
            14.2.1.4. Romania
            14.2.1.5. Rest of Eastern Europe
        14.2.2. By Product Type
        14.2.3. By Material
        14.2.4. By Cap Type
        14.2.5. By Capacity
        14.2.6. By End Use
    14.3. Market Attractiveness Analysis
        14.3.1. By Country
        14.3.2. By Product Type
        14.3.3. By Material
        14.3.4. By Cap Type
        14.3.5. By Capacity
        14.3.6. By End Use
    14.4. Key Takeaways
15. South Asia and Pacific Market Analysis 2019 to 2023 and Forecast 2024 to 2034, By Country
    15.1. Historical Market Size Value (US$ Million) & Volume (Units) Trend Analysis By Market Taxonomy, 2019 to 2023
    15.2. Market Size Value (US$ Million) & Volume (Units) Forecast By Market Taxonomy, 2024 to 2034
        15.2.1. By Country
            15.2.1.1. India
            15.2.1.2. Bangladesh
            15.2.1.3. Australia
            15.2.1.4. New Zealand
            15.2.1.5. Rest of South Asia and Pacific
        15.2.2. By Product Type
        15.2.3. By Material
        15.2.4. By Cap Type
        15.2.5. By Capacity
        15.2.6. By End Use
    15.3. Market Attractiveness Analysis
        15.3.1. By Country
        15.3.2. By Product Type
        15.3.3. By Material
        15.3.4. By Cap Type
        15.3.5. By Capacity
        15.3.6. By End Use
    15.4. Key Takeaways
16. East Asia Market Analysis 2019 to 2023 and Forecast 2024 to 2034, By Country
    16.1. Historical Market Size Value (US$ Million) & Volume (Units) Trend Analysis By Market Taxonomy, 2019 to 2023
    16.2. Market Size Value (US$ Million) & Volume (Units) Forecast By Market Taxonomy, 2024 to 2034
        16.2.1. By Country
            16.2.1.1. China
            16.2.1.2. Japan
            16.2.1.3. South Korea
        16.2.2. By Product Type
        16.2.3. By Material
        16.2.4. By Cap Type
        16.2.5. By Capacity
        16.2.6. By End Use
    16.3. Market Attractiveness Analysis
        16.3.1. By Country
        16.3.2. By Product Type
        16.3.3. By Material
        16.3.4. By Cap Type
        16.3.5. By Capacity
        16.3.6. By End Use
    16.4. Key Takeaways
17. Middle East and Africa Market Analysis 2019 to 2023 and Forecast 2024 to 2034, By Country
    17.1. Historical Market Size Value (US$ Million) & Volume (Units) Trend Analysis By Market Taxonomy, 2019 to 2023
    17.2. Market Size Value (US$ Million) & Volume (Units) Forecast By Market Taxonomy, 2024 to 2034
        17.2.1. By Country
            17.2.1.1. GCC Countries
            17.2.1.2. South Africa
            17.2.1.3. Israel
            17.2.1.4. Rest of MEA
        17.2.2. By Product Type
        17.2.3. By Material
        17.2.4. By Cap Type
        17.2.5. By Capacity
        17.2.6. By End Use
    17.3. Market Attractiveness Analysis
        17.3.1. By Country
        17.3.2. By Product Type
        17.3.3. By Material
        17.3.4. By Cap Type
        17.3.5. By Capacity
        17.3.6. By End Use
    17.4. Key Takeaways
18. Key Countries Market Analysis
    18.1. USA
        18.1.1. Pricing Analysis
        18.1.2. Market Share Analysis, 2023
            18.1.2.1. By Product Type
            18.1.2.2. By Material
            18.1.2.3. By Cap Type
            18.1.2.4. By Capacity
            18.1.2.5. By End Use
    18.2. Canada
        18.2.1. Pricing Analysis
        18.2.2. Market Share Analysis, 2023
            18.2.2.1. By Product Type
            18.2.2.2. By Material
            18.2.2.3. By Cap Type
            18.2.2.4. By Capacity
            18.2.2.5. By End Use
    18.3. Brazil
        18.3.1. Pricing Analysis
        18.3.2. Market Share Analysis, 2023
            18.3.2.1. By Product Type
            18.3.2.2. By Material
            18.3.2.3. By Cap Type
            18.3.2.4. By Capacity
            18.3.2.5. By End Use
    18.4. Mexico
        18.4.1. Pricing Analysis
        18.4.2. Market Share Analysis, 2023
            18.4.2.1. By Product Type
            18.4.2.2. By Material
            18.4.2.3. By Cap Type
            18.4.2.4. By Capacity
            18.4.2.5. By End Use
    18.5. Germany
        18.5.1. Pricing Analysis
        18.5.2. Market Share Analysis, 2023
            18.5.2.1. By Product Type
            18.5.2.2. By Material
            18.5.2.3. By Cap Type
            18.5.2.4. By Capacity
            18.5.2.5. By End Use
    18.6. UK
        18.6.1. Pricing Analysis
        18.6.2. Market Share Analysis, 2023
            18.6.2.1. By Product Type
            18.6.2.2. By Material
            18.6.2.3. By Cap Type
            18.6.2.4. By Capacity
            18.6.2.5. By End Use
    18.7. France
        18.7.1. Pricing Analysis
        18.7.2. Market Share Analysis, 2023
            18.7.2.1. By Product Type
            18.7.2.2. By Material
            18.7.2.3. By Cap Type
            18.7.2.4. By Capacity
            18.7.2.5. By End Use
    18.8. Spain
        18.8.1. Pricing Analysis
        18.8.2. Market Share Analysis, 2023
            18.8.2.1. By Product Type
            18.8.2.2. By Material
            18.8.2.3. By Cap Type
            18.8.2.4. By Capacity
            18.8.2.5. By End Use
    18.9. Italy
        18.9.1. Pricing Analysis
        18.9.2. Market Share Analysis, 2023
            18.9.2.1. By Product Type
            18.9.2.2. By Material
            18.9.2.3. By Cap Type
            18.9.2.4. By Capacity
            18.9.2.5. By End Use
    18.10. Poland
        18.10.1. Pricing Analysis
        18.10.2. Market Share Analysis, 2023
            18.10.2.1. By Product Type
            18.10.2.2. By Material
            18.10.2.3. By Cap Type
            18.10.2.4. By Capacity
            18.10.2.5. By End Use
    18.11. Russia
        18.11.1. Pricing Analysis
        18.11.2. Market Share Analysis, 2023
            18.11.2.1. By Product Type
            18.11.2.2. By Material
            18.11.2.3. By Cap Type
            18.11.2.4. By Capacity
            18.11.2.5. By End Use
    18.12. Czech Republic
        18.12.1. Pricing Analysis
        18.12.2. Market Share Analysis, 2023
            18.12.2.1. By Product Type
            18.12.2.2. By Material
            18.12.2.3. By Cap Type
            18.12.2.4. By Capacity
            18.12.2.5. By End Use
    18.13. Romania
        18.13.1. Pricing Analysis
        18.13.2. Market Share Analysis, 2023
            18.13.2.1. By Product Type
            18.13.2.2. By Material
            18.13.2.3. By Cap Type
            18.13.2.4. By Capacity
            18.13.2.5. By End Use
    18.14. India
        18.14.1. Pricing Analysis
        18.14.2. Market Share Analysis, 2023
            18.14.2.1. By Product Type
            18.14.2.2. By Material
            18.14.2.3. By Cap Type
            18.14.2.4. By Capacity
            18.14.2.5. By End Use
    18.15. Bangladesh
        18.15.1. Pricing Analysis
        18.15.2. Market Share Analysis, 2023
            18.15.2.1. By Product Type
            18.15.2.2. By Material
            18.15.2.3. By Cap Type
            18.15.2.4. By Capacity
            18.15.2.5. By End Use
    18.16. Australia
        18.16.1. Pricing Analysis
        18.16.2. Market Share Analysis, 2023
            18.16.2.1. By Product Type
            18.16.2.2. By Material
            18.16.2.3. By Cap Type
            18.16.2.4. By Capacity
            18.16.2.5. By End Use
    18.17. New Zealand
        18.17.1. Pricing Analysis
        18.17.2. Market Share Analysis, 2023
            18.17.2.1. By Product Type
            18.17.2.2. By Material
            18.17.2.3. By Cap Type
            18.17.2.4. By Capacity
            18.17.2.5. By End Use
    18.18. China
        18.18.1. Pricing Analysis
        18.18.2. Market Share Analysis, 2023
            18.18.2.1. By Product Type
            18.18.2.2. By Material
            18.18.2.3. By Cap Type
            18.18.2.4. By Capacity
            18.18.2.5. By End Use
    18.19. Japan
        18.19.1. Pricing Analysis
        18.19.2. Market Share Analysis, 2023
            18.19.2.1. By Product Type
            18.19.2.2. By Material
            18.19.2.3. By Cap Type
            18.19.2.4. By Capacity
            18.19.2.5. By End Use
    18.20. South Korea
        18.20.1. Pricing Analysis
        18.20.2. Market Share Analysis, 2023
            18.20.2.1. By Product Type
            18.20.2.2. By Material
            18.20.2.3. By Cap Type
            18.20.2.4. By Capacity
            18.20.2.5. By End Use
    18.21. GCC Countries
        18.21.1. Pricing Analysis
        18.21.2. Market Share Analysis, 2023
            18.21.2.1. By Product Type
            18.21.2.2. By Material
            18.21.2.3. By Cap Type
            18.21.2.4. By Capacity
            18.21.2.5. By End Use
    18.22. South Africa
        18.22.1. Pricing Analysis
        18.22.2. Market Share Analysis, 2023
            18.22.2.1. By Product Type
            18.22.2.2. By Material
            18.22.2.3. By Cap Type
            18.22.2.4. By Capacity
            18.22.2.5. By End Use
    18.23. Israel
        18.23.1. Pricing Analysis
        18.23.2. Market Share Analysis, 2023
            18.23.2.1. By Product Type
            18.23.2.2. By Material
            18.23.2.3. By Cap Type
            18.23.2.4. By Capacity
            18.23.2.5. By End Use
19. Market Structure Analysis
    19.1. Competition Dashboard
    19.2. Competition Benchmarking
    19.3. Market Share Analysis of Top Players
        19.3.1. By Regional
        19.3.2. By Product Type
        19.3.3. By Material
        19.3.4. By Cap Type
        19.3.5. By Capacity
        19.3.6. By End Use
20. Competition Analysis
    20.1. Competition Deep Dive
        20.1.1. Berry Global, Inc.
            20.1.1.1. Overview
            20.1.1.2. Product Portfolio
            20.1.1.3. Profitability by Market Segments
            20.1.1.4. Sales Footprint
            20.1.1.5. Strategy Overview
                20.1.1.5.1. Marketing Strategy
                20.1.1.5.2. Product Strategy
                20.1.1.5.3. Channel Strategy
        20.1.2. Crown Holdings, Inc.
            20.1.2.1. Overview
            20.1.2.2. Product Portfolio
            20.1.2.3. Profitability by Market Segments
            20.1.2.4. Sales Footprint
            20.1.2.5. Strategy Overview
                20.1.2.5.1. Marketing Strategy
                20.1.2.5.2. Product Strategy
                20.1.2.5.3. Channel Strategy
        20.1.3. Ball Corporation
            20.1.3.1. Overview
            20.1.3.2. Product Portfolio
            20.1.3.3. Profitability by Market Segments
            20.1.3.4. Sales Footprint
            20.1.3.5. Strategy Overview
                20.1.3.5.1. Marketing Strategy
                20.1.3.5.2. Product Strategy
                20.1.3.5.3. Channel Strategy
        20.1.4. CCL Industries Inc.
            20.1.4.1. Overview
            20.1.4.2. Product Portfolio
            20.1.4.3. Profitability by Market Segments
            20.1.4.4. Sales Footprint
            20.1.4.5. Strategy Overview
                20.1.4.5.1. Marketing Strategy
                20.1.4.5.2. Product Strategy
                20.1.4.5.3. Channel Strategy
        20.1.5. Aptar Group Inc.
            20.1.5.1. Overview
            20.1.5.2. Product Portfolio
            20.1.5.3. Profitability by Market Segments
            20.1.5.4. Sales Footprint
            20.1.5.5. Strategy Overview
                20.1.5.5.1. Marketing Strategy
                20.1.5.5.2. Product Strategy
                20.1.5.5.3. Channel Strategy
        20.1.6. Silgan Holdings Inc.
            20.1.6.1. Overview
            20.1.6.2. Product Portfolio
            20.1.6.3. Profitability by Market Segments
            20.1.6.4. Sales Footprint
            20.1.6.5. Strategy Overview
                20.1.6.5.1. Marketing Strategy
                20.1.6.5.2. Product Strategy
                20.1.6.5.3. Channel Strategy
        20.1.7. Montebello Packaging Inc.
            20.1.7.1. Overview
            20.1.7.2. Product Portfolio
            20.1.7.3. Profitability by Market Segments
            20.1.7.4. Sales Footprint
            20.1.7.5. Strategy Overview
                20.1.7.5.1. Marketing Strategy
                20.1.7.5.2. Product Strategy
                20.1.7.5.3. Channel Strategy
        20.1.8. Exal Corporation
            20.1.8.1. Overview
            20.1.8.2. Product Portfolio
            20.1.8.3. Profitability by Market Segments
            20.1.8.4. Sales Footprint
            20.1.8.5. Strategy Overview
                20.1.8.5.1. Marketing Strategy
                20.1.8.5.2. Product Strategy
                20.1.8.5.3. Channel Strategy
        20.1.9. Graham Packaging Company
            20.1.9.1. Overview
            20.1.9.2. Product Portfolio
            20.1.9.3. Profitability by Market Segments
            20.1.9.4. Sales Footprint
            20.1.9.5. Strategy Overview
                20.1.9.5.1. Marketing Strategy
                20.1.9.5.2. Product Strategy
                20.1.9.5.3. Channel Strategy
        20.1.10. Allied Cans Limited
            20.1.10.1. Overview
            20.1.10.2. Product Portfolio
            20.1.10.3. Profitability by Market Segments
            20.1.10.4. Sales Footprint
            20.1.10.5. Strategy Overview
                20.1.10.5.1. Marketing Strategy
                20.1.10.5.2. Product Strategy
                20.1.10.5.3. Channel Strategy
        20.1.11. TUBEX GmbH.
            20.1.11.1. Overview
            20.1.11.2. Product Portfolio
            20.1.11.3. Profitability by Market Segments
            20.1.11.4. Sales Footprint
            20.1.11.5. Strategy Overview
                20.1.11.5.1. Marketing Strategy
                20.1.11.5.2. Product Strategy
                20.1.11.5.3. Channel Strategy
        20.1.12. Nampak Ltd.
            20.1.12.1. Overview
            20.1.12.2. Product Portfolio
            20.1.12.3. Profitability by Market Segments
            20.1.12.4. Sales Footprint
            20.1.12.5. Strategy Overview
                20.1.12.5.1. Marketing Strategy
                20.1.12.5.2. Product Strategy
                20.1.12.5.3. Channel Strategy
        20.1.13. Bharat Containers
            20.1.13.1. Overview
            20.1.13.2. Product Portfolio
            20.1.13.3. Profitability by Market Segments
            20.1.13.4. Sales Footprint
            20.1.13.5. Strategy Overview
                20.1.13.5.1. Marketing Strategy
                20.1.13.5.2. Product Strategy
                20.1.13.5.3. Channel Strategy
21. Assumptions & Acronyms Used
22. Research Methodology
Recommendations

Packaging

Pharmaceutical Container Market

October 2023

REP-GB-9410

333 pages

Packaging

Aluminum Aerosol Cans Market

February 2023

REP-GB-2165

141 pages

Explore Packaging Insights

View Reports
Future Market Insights

Aerosol Packaging Market

Schedule a Call