

- Market Size (2026)
- USD 2.5 Bn
- Forecast (2036)
- USD 6.3 Bn
- CAGR (2026 to 2036)
- 9.6%
How big is Agriculture Imaging Systems Market in 2026?
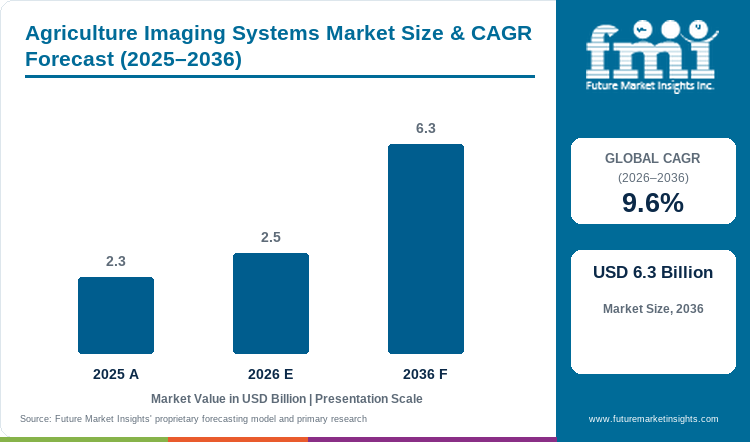
The agriculture imaging systems market is valued at USD 2.5 billion in 2026 and is projected to reach USD 6.3 billion by 2036, growing at a 9.6% CAGR.
The agriculture imaging systems market stood at USD 2.3 Billion in 2025, is estimated at USD 2.5 Billion in 2026, and is forecast to reach USD 6.3 Billion by 2036 at a 9.6% CAGR from 2026 to 2036.
Revenue moves as growers and agronomy teams shift imagery from occasional scouting evidence into recurring field decisions. The market rises from USD 2.5 Billion in 2026 to USD 6.3 Billion by 2036 at a 9.6% CAGR.
USDA NASS reported in February 2026 that its 2025 Cropland Data Layer used Sentinel-2 plus Landsat 8 and 9 imagery at 10-meter resolution. The classification uses visible and infrared spectral information to produce annual crop-specific land-cover maps.
That operating example matters because it normalizes repeat image analysis across a large agricultural base. Commercial buyers apply the same logic at farm scale. Capture must be timely and calibrated, then connected to a crop action.
Spending therefore shifts toward systems that combine acquisition with crop-health interpretation and repeat monitoring rather than stand-alone image capture.
Country conversion depends on the route from image to field action. Brazil combines large production areas with public-sector testing: Embrapa Pecuária Sul issued a June 2024 procurement that included a fixed-wing drone with an aerographic and multispectral sensor.
In the USA, annual national crop mapping demonstrates a mature remote-sensing reference point, yet suppliers still have to fit farm software and equipment workflows. Australia favors broad-area satellite monitoring where distance makes continuous ground scouting costly.
Geoscience Australia reported in October 2024 that a Queensland provider used Digital Earth Australia information to help manage more than 20 million hectares. France is building Sentinel-2 observations into official yield analysis.
Across these settings, interest converts into purchases when imagery is accurate enough for agronomy decisions and easy enough to move into existing farm operations.
Key Takeaways of Agriculture Imaging Systems Market
- The market is estimated at USD 2.5 Billion in 2026 and is forecast to reach USD 6.3 Billion by 2036 at a 9.6% CAGR.
- Multispectral imaging leads in 2026. Drone-mounted platforms lead in 2026.
- Crop health monitoring leads in 2026. Large farms lead in 2026. Subscription analytics leads in 2026.
- Driver: Growers and agronomy teams need faster visibility into crop variability before treatment and scouting windows close.
- Restraint: Image accuracy, calibration discipline and integration effort can weaken confidence in the operational result.
- Opportunity: Providers can convert more image capture into recurring revenue by delivering decision-ready analytics into existing farm workflows. Brazil has the highest profiled country CAGR at 10.2%, compared with France at 7.9%.
Analyst Perspective
Commercial separation will come from converting calibrated imagery into a timely farm action. Sensor breadth matters only when the output is stable enough for repeated comparison.
- Nandini Roy Choudhury, Principal Consultant, Future Market Insights
How is the Agriculture Imaging Systems Market segmented?
The agriculture imaging systems market is segmented by Imaging Type, Platform, Application, End Use, and Sales Model.
The agriculture imaging systems market uses five segment axes with region as the geographic split.
Imaging type covers multispectral imaging, hyperspectral imaging, thermal imaging, RGB crop imaging, and LiDAR/3D imaging.
Platform covers drone-mounted, satellite-enabled, tractor/sprayer mounted, fixed field cameras, and handheld systems.
Application covers crop health monitoring, yield estimation, irrigation management, disease/pest detection, and variable-rate input planning.
End use covers large farms, agronomy service providers, plantations, research institutes, and agri-input companies.
Sales model covers subscription analytics, hardware sale, service bureau, and platform bundle.
What makes Multispectral imaging central to the Imaging Type category?
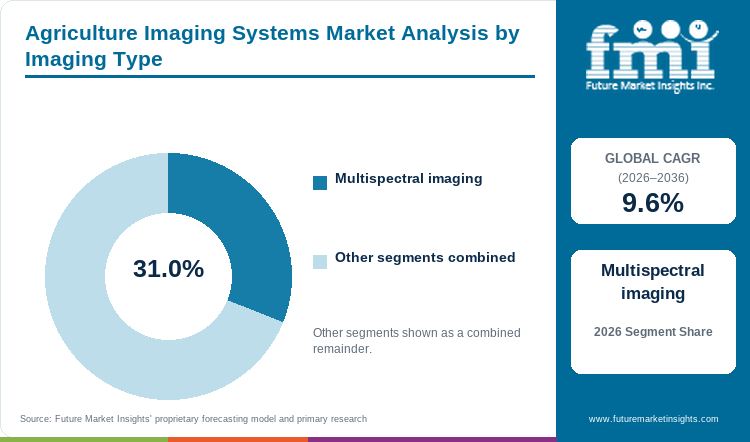
Multispectral imaging leads because crop monitoring needs contrast beyond visible RGB without the operating burden of full hyperspectral analysis. Red-edge and near-infrared information makes vegetation differences measurable while payload size and processing remain practical for recurring farm use.
This middle ground suits scouting programs that compare crop response across growth stages. It also works across drone and satellite workflows because common vegetation indices can be interpreted by agronomy software.
DJI announced the Mavic 3 Multispectral in November 2022 with an RGB camera and four multispectral bands. Those bands cover green, red, red-edge and near-infrared wavelengths. The commercial value comes from stable spectral contrast that can be converted into a field decision.
- Multispectral imaging accounts for 31.0% share in 2026 because it balances vegetation sensitivity with payload practicality and familiar index-based workflows.
- DJI announced in November 2022 that the Mavic 3 Multispectral combines RGB capture with four multispectral bands and RTK positioning for precision-agriculture surveys.
Why does Drone-mounted lead the Platform category?
Drone-mounted systems lead because farm teams control revisit timing and can collect detail at the field scale. A flight can follow a storm, scouting alert or treatment decision instead of waiting for a fixed external schedule.
The platform is useful when agronomists need plant-level information before a spray or input plan is finalized. Payload flexibility also lets operators replace cameras without redesigning the whole workflow.
John Deere acquired Sentera in May 2025, bringing Sentera's camera systems and FieldAgent software into its digital agriculture portfolio. Sentera cameras, compatible with most major drone platforms, can process high-resolution images into weed maps and prescriptions that move through the John Deere Operations Center. Buyers therefore value the drone less as an aircraft and more as a controllable image-acquisition layer inside agronomy operations.
- Drone-mounted platforms account for 34.0% share in 2026 because they give users direct control over timing, field coverage and sensor choice.
- John Deere announced in May 2025 that Sentera cameras work with most major drone platforms and feed image-derived prescriptions into compatible farm workflows.
How does Crop health monitoring shape the Application category?
Crop health monitoring leads because it creates a recurring reason to image the same field throughout a season. Growers need to see whether emergence, biomass and stress are changing before symptoms are obvious from a road or field edge.
That recurring need supports both high-frequency satellite observation and targeted drone follow-up. It also creates a natural bridge to disease detection, irrigation management and variable-rate input planning without making those uses identical.
Planet reported in April 2024 that its Crop Biomass product combines PlanetScope with Sentinel-1 and Sentinel-2 inputs to provide a consistent daily time series. Repeat visibility is valuable when it directs scouting and intervention before the response window closes.
- Crop health monitoring accounts for 29.0% share in 2026 because it supports repeated observation across the growing season and can trigger several downstream agronomy actions.
- Planet reported in April 2024 that Crop Biomass combines optical and radar information into a daily time series intended for crop monitoring and in-season management.
What supports Large farms in the End Use category?
Large farms lead because fixed acquisition costs and recurring analytics fees can be spread over more hectares. Field variability also raises the value of prioritizing where scouts or operators should go first.
The strongest economics appear when imagery narrows the area that needs inspection or treatment rather than adding another map to the farm office. Larger operators are also more likely to require integration with existing farm management systems.
Geoscience Australia reported in October 2024 that Cibo Labs uses Digital Earth Australia information to help graziers manage more than 20 million hectares. That example shows how broad-area image products become useful when they are embedded in routine land-management decisions at scale.
- Large farms account for 32.0% share in 2026 because acreage scale improves the economics of repeat imaging and increases the value of targeted scouting.
- Geoscience Australia reported in October 2024 that Digital Earth Australia information supports Cibo Labs services used to manage more than 20 million hectares.
What drives Subscription analytics in the Sales Model category?
Subscription analytics leads because recurring image capture produces more value when users can compare current conditions with prior observations and receive timely interpretation. A subscription aligns payment with in-season use and reduces the need to buy every layer of infrastructure upfront.
Providers can also maintain algorithms, imagery feeds and integrations as crop conditions change. Planet reported in April 2024 that Crop Biomass can be delivered through a Subscriptions API as a consistent daily time series. This model fits agronomy teams that want repeat access instead of a single mapping project.
Renewal still depends on whether the analysis changes scouting, input or harvest decisions enough to justify recurring spend.
- Subscription analytics accounts for 38.0% share in 2026 because recurring monitoring creates repeat demand for interpretation, delivery and integration rather than one-time image access.
- Planet reported in April 2024 that Crop Biomass can be delivered through a Subscriptions API, illustrating how agricultural image products can be embedded in recurring software workflows.
What are the drivers, restraints, and opportunities in the Agriculture Imaging Systems Market?
In the agriculture imaging systems market, the key driver is the need of growers and agronomy teams for faster visibility into crop variability before treatment and scouting windows close, making multispectral imaging the leading imaging type since it delivers vegetation-sensitive red-edge and near-infrared contrast without the payload and processing burden of full hyperspectral analysis, the key restraint is that image accuracy and calibration discipline can weaken confidence in the operational result, since variable ambient illumination and radiometric correction method choice can change measured outcomes even when crop conditions have not changed, and the key opportunity is converting image capture into recurring revenue by packaging imagery as a decision service, such as weed classification, prescription-map exports or daily biomass time series, rather than delivering a stand-alone map, so that acquisition links directly into farm software and machinery execution.
- Driver: Growers and agronomy teams need faster visibility into crop variability before treatment and scouting windows close.
- Restraint: Image accuracy, calibration discipline and integration effort can weaken confidence in the operational result.
- Opportunity: Providers can convert more image capture into recurring revenue by delivering decision-ready analytics into existing farm workflows.
The demand driver is the cost of making field decisions with incomplete visibility. Remote sensing lets agronomy teams rank where to scout and where a treatment may be needed before blanket action is taken.
USDA NASS reported in February 2026 that its 2025 Cropland Data Layer used multiple satellite sources and spectral bands for annual crop-specific classification at 10-meter resolution. That public program is not a farm purchasing proxy, but it demonstrates the operational maturity of repeat agricultural image analysis.
Commercial demand strengthens when farm buyers can apply a similar observation loop at field scale and receive the result early enough to influence an in-season decision.
The principal restraint appears between image capture and confidence in the measurement. Wang and co-authors reported in Biosystems Engineering in December 2024 that changing ambient illumination can affect the accuracy and reliability of UAV multispectral observations.
Their comparison showed that radiometric correction method choice materially changes performance under variable light. This matters commercially because a farm team must trust that a change in an index reflects crop condition rather than acquisition conditions.
Calibration panels, sensor setup and processing therefore add operating discipline. Integration with farm records adds another step. These frictions can delay purchase or reduce renewal even when the underlying need for better field visibility remains.
The strongest opportunity is to package imagery as a decision service rather than a finished map. Sentera announced in January 2025 that SmartScript Weeds added weed classification, stand counts and John Deere Operations Center integration.
Pix4D reported in October 2024 that PIX4Dfields 2.8 added XAG prescription-map exports and AI crop reporting. These examples show the revenue path: capture becomes more valuable when it creates an execution file or a repeated agronomy recommendation.
Providers best placed to capture this opening are those that can combine dependable image acquisition with interpretation and machinery or farm-software connectivity. The opportunity converts into recurring revenue when users can trace the subscription to faster action or lower input waste.
Which country CAGRs are profiled in the Agriculture Imaging Systems Market?
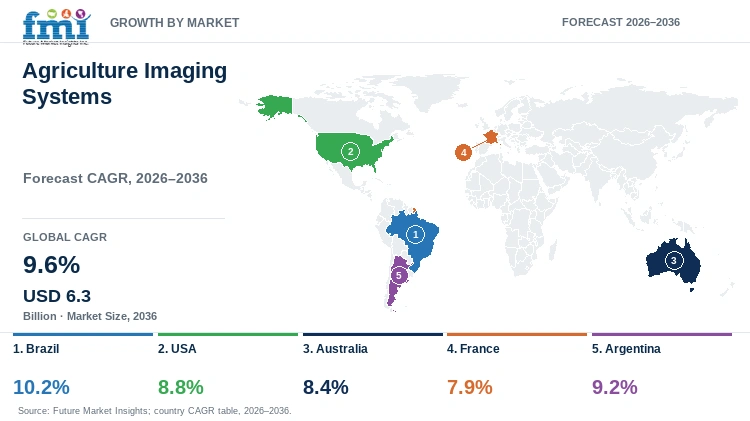
| Country | CAGR |
|---|---|
| Brazil | 10.2% from 2026 to 2036 |
| USA | 8.8% from 2026 to 2036 |
| Australia | 8.4% from 2026 to 2036 |
| France | 7.9% from 2026 to 2036 |
| Argentina | 9.2% from 2026 to 2036 |
How do country-level CAGRs compare in the Agriculture Imaging Systems Market?
The five country CAGRs span 2.3 percentage points from Brazil at 10.2% to France at 7.9% between 2026 and 2036. Brazil forms the top band, while Argentina at 9.2% follows with a still elevated growth profile. The USA at 8.8% and Australia at 8.4% form a middle band separated by only 0.4 percentage points.
France is lower at 7.9% but remains a growth market. These differences indicate different adoption speeds rather than absolute revenue positions. Commercial planning should therefore pair the rate with farm scale, operating structure and the route through which image outputs reach field decisions.
- Brazil leads Argentina by 1.0 percentage point. The gap favors earlier channel investment where suppliers can support large-area monitoring and localized aerial deployment.
- Argentina leads the USA by 0.4 percentage points. The narrow difference shifts attention from headline growth to service economics, buyer access and recurring software use.
- The USA leads Australia by 0.4 percentage points. Both reward workflow integration, but Australia places more weight on scalable coverage across remote production areas.
- Australia leads France by 0.5 percentage points. France can still support durable demand where image outputs fit crop-specific analysis and existing precision-agriculture practices.
CAGR alone cannot identify the largest country opportunity because it does not show the starting revenue base or the cost to acquire and support customers. A faster rate can still sit on a smaller starting market.
Supplier strategy should combine growth rate with acreage economics, crop mix, service requirements and integration burden.
The full market view also covers more than twenty-five additional countries across the fixed regional taxonomy, which matters for companies using the same sensor or analytics stack across several agricultural systems.
Country-wise Analysis
- Brazil: Brazilian buyers often need imaging systems that can cover large fields while still supporting local validation and field-level response. Demand for Agriculture Imaging Systems in Brazil is forecast to expand at 10.2% CAGR from 2026 to 2036. During June 2024 Embrapa Pecuária Sul opened a public procurement for drones and accessories that included a fixed-wing remotely piloted aircraft with an aerographic and multispectral sensor. The friction is not image availability alone; operators must manage calibration, field logistics and the handoff into agronomy decisions. Suppliers can compete by pairing rugged acquisition with local service, repeatable processing and clear integration into crop-management workflows.
- USA: USA farm operations buy imaging when the output fits established digital agronomy and equipment workflows. Demand for Agriculture Imaging Systems in the USA is forecast to expand at 8.8% CAGR from 2026 to 2036. USDA NASS published the 2025 Cropland Data Layer in February 2026 using Sentinel-2 plus Landsat 8 and 9 imagery at 10-meter resolution for crop-specific classification. The local friction is commercial conversion from available imagery into farm-level action with defensible return. Suppliers need timely field resolution, straightforward integration and support for prescriptions or scouting tasks rather than another disconnected map layer.
- Australia: Australian users place a premium on broad-area observation because agricultural assets can be widely dispersed and ground verification is costly. Adoption of Agriculture Imaging Systems in Australia is forecast to expand at 8.4% CAGR from 2026 to 2036. Geoscience Australia reported in October 2024 that Digital Earth Australia supports analysis of vegetation health, water availability and drought, while Cibo Labs uses the information to help manage more than 20 million hectares. The friction is turning continental-scale coverage into decisions at the paddock level. Suppliers should combine dependable satellite baselines with targeted high-resolution capture and practical agronomy interpretation.
- France: French buyers can draw on a mature public earth-observation environment while still requiring farm-level relevance. Demand for Agriculture Imaging Systems in France is forecast to expand at 7.9% CAGR from 2026 to 2036. On 10 July 2026 the French agricultural statistics service Agreste released local soft-wheat yield maps for 2021 to 2025 using Sentinel-2 information and a statistical learning method. The friction lies in translating analytical capability into a repeatable operational benefit for growers and advisors. Suppliers need crop-specific validation, compatible export formats and a clear path from image interpretation to field action.
- Argentina: Argentine adoption is strongly service-oriented because many users access remote sensing through satellite-imagery platforms rather than owning every acquisition layer. Sales of Agriculture Imaging Systems in Argentina are forecast to expand at 9.2% CAGR from 2026 to 2036. A May 2024 French Ministry of Agriculture monitoring note summarized an AgroTIC study that found satellite-imagery services covered 73% of Argentine territory and identified cost, technical complexity and return on investment as recurring barriers. Drone use was stronger in higher-value viticulture. Suppliers can win by keeping subscription economics transparent and by matching resolution to crop value, acreage and advisory workflow.
Who are the notable companies in the Agriculture Imaging Systems Market?
DJI Agriculture and Trimble are profiled. John Deere and Sentera are also covered. and Taranis are also covered. AgEagle and MicaSense / AgEagle are also covered. Planet Labs and Pix4D complete the notable-company set.
Competition is divided by where each company controls the workflow. DJI Agriculture and Trimble connect image-derived decisions with field equipment alongside John Deere.
Sensor design and interpretation determine how useful the image becomes. AgEagle spans drones and sensors while Planet Labs supplies scalable satellite observation and analysis-ready products. Pix4D concentrates on turning drone or satellite images into maps, indices and prescriptions.
The key competitive question is therefore not which company has the most imagery. It is which supplier can deliver sufficient acquisition quality, agronomic interpretation and workflow connectivity for the buyer's operating model.
- Integrated field workflow: DJI Agriculture, Trimble and John Deere compete through hardware ecosystems, connected farm operations and links between sensing and execution.
- Aerial sensing and crop intelligence: Sentera and Taranis compete alongside MicaSense / AgEagle. Their crop-focused cameras support image capture and field-level analysis.
- Scalable imagery and mapping platforms: AgEagle, Planet Labs and Pix4D compete through broader imaging stacks, satellite coverage or software that converts images into operational outputs.
Competitive Benchmarking: Agriculture Imaging Systems Market
| Company | Image Capture Breadth | Agronomic Analytics Depth | Execution Integration | Geographic Reach |
|---|---|---|---|---|
| DJI Agriculture | High | Medium | High | Selected global markets through DJI Agriculture channels |
| Trimble | Medium | High | High | Global precision-agriculture markets through PTx Trimble |
| John Deere | High | High | High | North America with broader Deere precision-agriculture reach |
| Sentera | High | High | High | USA with OEM and farm-platform integrations |
| Taranis | High | High | Medium | USA, Brazil, and Europe |
| AgEagle | High | Medium | High | North America with international drone and sensor channels |
| MicaSense / AgEagle | High | Medium | High | Global sensor distribution and platform integrations |
| Planet Labs | High | High | High | Global satellite coverage with cloud and API delivery |
| Pix4D | Medium | High | High | International software distribution and equipment integrations |
Scoring basis: Image Capture Breadth measures documented control of agriculture-relevant cameras and multispectral sensors. It also covers aerial platforms, satellite observation or multi-source image ingestion.
Key Developments in the Agriculture Imaging Systems Market
- In May 2025, John Deere acquired Sentera to integrate aerial field scouting with its digital agriculture tools. Sentera's cameras and FieldAgent software can turn high-resolution drone images into weed maps and targeted prescriptions that move through John Deere Operations Center. The transaction brings image acquisition closer to machinery execution and shows how equipment platforms are seeking tighter control of the image-to-action workflow.
- During October 2024 Pix4D released PIX4Dfields 2.8 with XAG prescription-map exports, AI crop-growth reporting and support for 15-band sensors. The update lets users convert image-derived zones into variable-rate or spot-spraying missions for compatible XAG drones. The commercial implication is a shorter path between image interpretation and field execution. This raises the value of software interoperability in purchasing decisions.
- In April 2024, Planet Labs enhanced its Crop Biomass product by adding PlanetScope information alongside Sentinel-1 and Sentinel-2 inputs. Planet described the output as a consistent daily time series that can be delivered through its Subscriptions API and used for large-scale crop-growth monitoring. The update strengthens the case for recurring satellite analytics where buyers want frequent observation without maintaining their own complex processing pipeline.
Key Players in the Agriculture Imaging Systems Market
Integrated Field Workflow Platforms
- DJI Agriculture
- Trimble
- John Deere
Aerial Sensing and Crop Intelligence Specialists
- Sentera
- Taranis
- MicaSense / AgEagle
Scalable Imagery and Mapping Platforms
- AgEagle
- Planet Labs
- Pix4D
Agriculture Imaging Systems Market - Report Scope
| Coverage field | Report scope |
|---|---|
| Market breakdown | Imaging Type; Platform; Application; End Use; Sales Model |
| Quantitative Units | USD Billion |
| Market Definition | Revenue includes agriculture imaging hardware, sensors, imaging platforms, analysis software and imaging services sold within the defined segmentation universe. It excludes downstream finished-product revenue and adjacent substitutes that do not sell imaging capability or imaging-derived analytics. |
| Regions Covered | North America; Latin America; Western Europe; Eastern Europe; East Asia; South Asia and Pacific; Middle East and Africa |
| Countries Covered | Brazil; USA; Australia; France; Argentina; more than twenty-five additional countries in the full report |
| Key Companies Profiled | DJI Agriculture; Trimble; John Deere; Sentera; Taranis; AgEagle; MicaSense / AgEagle; Planet Labs; Pix4D |
| Forecast Period | 2026 to 2036 |
| Approach | Hybrid bottom-up and top-down sizing that reconciles supplier activity with end-use demand and country conditions within the defined revenue boundary. |
Agriculture Imaging Systems Market - Research Methodology
| Method | Approach |
|---|---|
| Primary Research | FMI consults imaging-platform providers and agronomy channels. Farm operators explain buying criteria and renewal behavior. The research tests purchase criteria and adoption barriers. |
| Desk Research | FMI reviews agricultural agency sources and peer-reviewed research. Company documentation supports deployment and country conditions. Sources are retained when they support the defined market boundary. |
| Market Sizing and Forecasting | FMI reconciles supplier offers with farm demand and platform adoption. Forecasts reflect replacement and recurring analytics. Country conditions and channel structure are checked against the revenue boundary. |
| Data Validation | Findings are checked against independent evidence. The estimate excludes downstream crop value and adjacent substitutes. Duplicate revenue and unsupported claims are removed. |
Agriculture Imaging Systems Market by Segments
Agriculture Imaging Systems Market segmented by Imaging Type
- Multispectral imaging
- Hyperspectral imaging
- Thermal imaging
- RGB crop imaging
- LiDAR / 3D imaging
Agriculture Imaging Systems Market segmented by Platform
- Drone-mounted
- Satellite-enabled
- Tractor / sprayer mounted
- Fixed field cameras
- Handheld systems
Agriculture Imaging Systems Market segmented by Application
- Crop health monitoring
- Yield estimation
- Irrigation management
- Disease / pest detection
- Variable-rate input planning
Agriculture Imaging Systems Market segmented by End Use
- Large farms
- Agronomy service providers
- Plantations
- Research institutes
- Agri-input companies
Agriculture Imaging Systems Market segmented by Sales Model
- Subscription analytics
- Hardware sale
- Service bureau
- Platform bundle
Agriculture Imaging Systems Market by Region
- North America
- United States
- Canada
- Latin America
- Brazil
- Mexico
- Argentina
- Chile
- Western Europe
- Germany
- France
- United Kingdom
- Italy
- Spain
- Benelux
- Nordics
- Eastern Europe
- Poland
- Czech Republic
- Romania
- Hungary
- East Asia
- China
- Japan
- South Korea
- South Asia and Pacific
- India
- ASEAN
- Australia and New Zealand
- Middle East and Africa
- GCC Countries
- South Africa
- Türkiye
- Israel
Research Sources and Bibliography
- United States Department of Agriculture, National Agricultural Statistics Service (2026, February 27). 2025 Cropland Data Layer.
- Geoscience Australia (2024, October 23). Satellite imagery at work Agriculture.
- Compras.gov.br / Embrapa Pecuária Sul (2024, June 28). Pregão Eletrônico Nº 90006/2024 - Aquisição de Drones e Assessórios para Drones.
- Agreste, Service de la statistique et de la prospective (2026, July 10). Estimer les rendements du blé tendre à l’échelle locale grâce aux images satellitaires.
- Centre d’études et de prospective, Ministère de l’Agriculture (2024, May 30). Les usages de la télédétection en agriculture en Argentine.
- Wang, Y.; Kootstra, G.; Yang, Z.; and Khan, H. A. (2024, November 15). UAV multispectral remote sensing for agriculture: A comparative study of radiometric correction methods under varying illumination conditions.
- DJI Agriculture (2022, November 23). DJI Agriculture Launches the Mavic 3 Multispectral to Spark the Development of Global Precision Agriculture.
- Trimble (2024, April 1). AGCO and Trimble Close Joint Venture, Form PTx Trimble.
- John Deere and Sentera (2025, May 23). John Deere Acquires Sentera to Integrate Aerial Field Scouting.
- Sentera (2025, January 16). Sentera Unveils SMARTSCRIPT Weeds, Formerly Aerial WeedScout, with Enhanced Features for 2025.
- Taranis (2024, July 17). Taranis Launches Ag Assistant to Transform Farm Decision Making.
- AgEagle Aerial Systems (2021, January 27). AgEagle Aerial Systems Announces Acquisition of MicaSense for $23 Million.
- Planet Labs PBC (2024, April 2). Next Generation Agriculture Monitoring at Scale With Planet’s Crop Biomass.
- Pix4D (2024, October 29). PIX4Dfields 2.8: XAG prescriptions, AI crop report and more!
This bibliography is provided for reader reference and is not exhaustive. The full report contains the complete reference list and detailed citations.
This Report Answers
- What is the Agriculture Imaging Systems Market size in 2026 and how large is it forecast to be by 2036?
- Which field-management pressures and operating needs support demand for agriculture imaging systems?
- Why does Multispectral imaging hold the leading position within Imaging Type?
- How does the Drone-mounted platform influence downstream scouting and input-planning demand?
- Why does Crop health monitoring hold the leading position within Application?
- How do the profiled country growth rates compare for the Agriculture Imaging Systems market?
- Which companies cover image capture, crop intelligence and the mapping workflow from satellite observation to field action?
- How do calibration, processing and workflow integration limit adoption and recurring use?
Frequently Asked Questions
How big is the Agriculture Imaging Systems Market in 2026?
The agriculture imaging systems market is valued at USD 2.5 billion in 2026 and is forecast to reach USD 6.3 billion by 2036. Growth is supported by growers and agronomy teams shifting imagery from occasional scouting evidence into recurring field decisions, with spending concentrated on systems that combine calibrated acquisition with crop-health interpretation and repeat monitoring rather than stand-alone image capture.
What is the CAGR of the Agriculture Imaging Systems Market from 2026 to 2036?
The agriculture imaging systems market grows at a CAGR of 9.6% between 2026 and 2036, supported by tighter integration between aerial image acquisition, subscription analytics, and farm-software execution that converts calibrated multispectral and satellite imagery into timely agronomy actions across crop health monitoring, disease detection, and variable-rate input planning workflows.
Which imaging type leads the Agriculture Imaging Systems Market?
Multispectral imaging accounts for 31.0% of the agriculture imaging systems market by imaging type in 2026, driven by its ability to deliver red-edge and near-infrared spectral contrast for vegetation monitoring without the payload and processing burden of full hyperspectral analysis, making it practical for recurring drone and satellite workflows where familiar vegetation indices connect directly to agronomy decisions.
How much will the Agriculture Imaging Systems Market add between 2026 and 2036?
The agriculture imaging systems market is set to add USD 3.8 billion between 2026 and 2036, growing from USD 2.5 billion to USD 6.3 billion as subscription analytics platforms expand recurring demand for interpreted imagery, John Deere's acquisition of Sentera tightens the image-to-prescription workflow, and large-farm operators in Brazil, Argentina, and Australia embed satellite and drone-based monitoring into standard agronomy programs.
Who are the leading companies in the Agriculture Imaging Systems Market?
Ten companies are profiled in the agriculture imaging systems market, including DJI Agriculture, Trimble, John Deere, Sentera, Taranis, SlantRange, AgEagle, MicaSense / AgEagle, Planet Labs, and Pix4D, competing through image capture breadth, agronomic analytics depth, and execution integration across integrated field workflow platforms, aerial sensing and crop intelligence specialists, and scalable satellite imagery and mapping platforms globally.
Preview the report firsthand - request a free sample
Get SampleGet the brochure for pricing and purchase details.
Get PDFTable of Content
- Key Takeaways
- Market Size and CAGR
- Top Growth Driver
- Fastest Growing Segment
- Leading Region
- Key Companies
- Emerging Opportunities
- Executive Summary
- Global Market Outlook
- Demand-side Trends
- Supply-side Trends
- Technology Roadmap Analysis
- Analysis and Recommendations
- Analyst Perspective (What is happening? Why now? What should investors know?)
- Key Questions Answered
- How large is the market?
- What is the CAGR?
- What are key trends?
- Which region dominates?
- Who are the leaders?
- Market Overview
- Market Coverage / Taxonomy
- Market Definition / Scope / Limitations
- Research Methodology
- Chapter Orientation
- Analytical Lens and Working Hypotheses
- Market Structure, Signals, and Trend Drivers
- Benchmarking and Cross-market Comparability
- Market Sizing, Forecasting, and Opportunity Mapping
- Research Design and Evidence Framework
- Desk Research Programme (Secondary Evidence)
- Expert Input and Fieldwork (Primary Evidence)
- Tooling, Models, and Reference Databases
- Data Engineering and Model Build
- Quality Assurance and Audit Trail
- Market Background
- Market Dynamics (Drivers, Restraints, Opportunity, Trends)
- Scenario Forecast (Optimistic, Likely, Conservative)
- Impact Analysis
- AI Impact
- Sustainability Impact
- Regulatory Impact
- Technology Impact
- Consumer / Buyer Analysis
- Purchase Drivers
- Adoption Barriers
- Buyer Journey
- Opportunity Map Analysis
- Product Life Cycle Analysis
- Supply Chain Analysis
- Investment Feasibility Matrix
- Value Chain Analysis
- PESTLE and Porter's Analysis
- Regulatory Landscape
- Regional Parent Market Outlook
- Production and Consumption Statistics
- Import and Export Statistics
- Global Market Analysis and Forecast, 2021 to 2036
- Historical Market Size Value (USD Billion) Analysis, 2021 to 2025
- Current and Future Market Size Value (USD Billion) Projections, 2026 to 2036
- Y-o-Y Growth Trend Analysis
- Absolute $ Opportunity Analysis
- Global Market Pricing Analysis, 2021 to 2036
- Global Market Analysis and Forecast, By Imaging Type, 2021 to 2036
- Introduction / Key Findings
- Historical Market Size Value (USD Billion) Analysis By Imaging Type, 2021 to 2025
- Current and Future Market Size Value (USD Billion) Analysis and Forecast By Imaging Type, 2026 to 2036
- Multispectral imaging
- Hyperspectral imaging
- Thermal imaging
- RGB crop imaging
- LiDAR / 3D imaging
- By Case Type
- Y-o-Y Growth Trend Analysis By Imaging Type, 2021 to 2025
- Absolute $ Opportunity Analysis By Imaging Type, 2026 to 2036
- Global Market Analysis and Forecast, By Platform, 2021 to 2036
- Introduction / Key Findings
- Historical Market Size Value (USD Billion) Analysis By Platform, 2021 to 2025
- Current and Future Market Size Value (USD Billion) Analysis and Forecast By Platform, 2026 to 2036
- Drone-mounted
- Satellite-enabled
- Tractor / sprayer mounted
- Fixed field cameras
- Handheld systems
- By Material
- Y-o-Y Growth Trend Analysis By Platform, 2021 to 2025
- Absolute $ Opportunity Analysis By Platform, 2026 to 2036
- Global Market Analysis and Forecast, By Application, 2021 to 2036
- Introduction / Key Findings
- Historical Market Size Value (USD Billion) Analysis By Application, 2021 to 2025
- Current and Future Market Size Value (USD Billion) Analysis and Forecast By Application, 2026 to 2036
- Crop health monitoring
- Yield estimation
- Irrigation management
- Disease / pest detection
- Variable-rate input planning
- By Application
- Y-o-Y Growth Trend Analysis By Application, 2021 to 2025
- Absolute $ Opportunity Analysis By Application, 2026 to 2036
- Global Market Analysis and Forecast, By End Use, 2021 to 2036
- Introduction / Key Findings
- Historical Market Size Value (USD Billion) Analysis By End Use, 2021 to 2025
- Current and Future Market Size Value (USD Billion) Analysis and Forecast By End Use, 2026 to 2036
- Large farms
- Agronomy service providers
- Plantations
- Research institutes
- Agri-input companies
- By Protection Level
- Y-o-Y Growth Trend Analysis By End Use, 2021 to 2025
- Absolute $ Opportunity Analysis By End Use, 2026 to 2036
- Global Market Analysis and Forecast, By Sales Model, 2021 to 2036
- Introduction / Key Findings
- Historical Market Size Value (USD Billion) Analysis By Sales Model, 2021 to 2025
- Current and Future Market Size Value (USD Billion) Analysis and Forecast By Sales Model, 2026 to 2036
- Subscription analytics
- Hardware sale
- Service bureau
- Platform bundle
- By Sales Channel
- Y-o-Y Growth Trend Analysis By Sales Model, 2021 to 2025
- Absolute $ Opportunity Analysis By Sales Model, 2026 to 2036
- Global Market Analysis and Forecast, By Region, 2021 to 2036
- Introduction
- Historical Market Size Value (USD Billion) Analysis By Region, 2021 to 2025
- Current Market Size Value (USD Billion) Analysis and Forecast By Region, 2026 to 2036
- North America
- Latin America
- Western Europe
- Eastern Europe
- East Asia
- South Asia and Pacific
- Middle East and Africa
- Market Attractiveness Analysis By Region
- North America Market Analysis and Forecast, By Country, 2021 to 2036
- Historical Market Size Value (USD Billion) Trend Analysis By Market Taxonomy, 2021 to 2025
- Market Size Value (USD Billion) Forecast By Market Taxonomy, 2026 to 2036
- By Country
- United States
- Canada
- By Imaging Type
- By Platform
- By Application
- By End Use
- By Sales Model
- By Country
- Market Attractiveness Analysis
- By Country
- By Imaging Type
- By Platform
- By Application
- By End Use
- By Sales Model
- Key Takeaways
- Latin America Market Analysis and Forecast, By Country
- Historical Market Size Value (USD Billion) Trend Analysis By Market Taxonomy, 2021 to 2025
- Market Size Value (USD Billion) Forecast By Market Taxonomy, 2026 to 2036
- By Country
- Brazil
- Mexico
- Argentina
- Chile
- By Imaging Type
- By Platform
- By Application
- By End Use
- By Sales Model
- By Country
- Market Attractiveness Analysis
- By Country
- By Imaging Type
- By Platform
- By Application
- By End Use
- By Sales Model
- Key Takeaways
- Western Europe Market Analysis and Forecast, By Country
- Historical Market Size Value (USD Billion) Trend Analysis By Market Taxonomy, 2021 to 2025
- Market Size Value (USD Billion) Forecast By Market Taxonomy, 2026 to 2036
- By Country
- Germany
- France
- United Kingdom
- Italy
- Spain
- Benelux
- Nordics
- By Imaging Type
- By Platform
- By Application
- By End Use
- By Sales Model
- By Country
- Market Attractiveness Analysis
- By Country
- By Imaging Type
- By Platform
- By Application
- By End Use
- By Sales Model
- Key Takeaways
- Eastern Europe Market Analysis and Forecast, By Country
- Historical Market Size Value (USD Billion) Trend Analysis By Market Taxonomy, 2021 to 2025
- Market Size Value (USD Billion) Forecast By Market Taxonomy, 2026 to 2036
- By Country
- Poland
- Czech Republic
- Romania
- Hungary
- By Imaging Type
- By Platform
- By Application
- By End Use
- By Sales Model
- By Country
- Market Attractiveness Analysis
- By Country
- By Imaging Type
- By Platform
- By Application
- By End Use
- By Sales Model
- Key Takeaways
- East Asia Market Analysis and Forecast, By Country
- Historical Market Size Value (USD Billion) Trend Analysis By Market Taxonomy, 2021 to 2025
- Market Size Value (USD Billion) Forecast By Market Taxonomy, 2026 to 2036
- By Country
- China
- Japan
- South Korea
- By Imaging Type
- By Platform
- By Application
- By End Use
- By Sales Model
- By Country
- Market Attractiveness Analysis
- By Country
- By Imaging Type
- By Platform
- By Application
- By End Use
- By Sales Model
- Key Takeaways
- South Asia and Pacific Market Analysis and Forecast, By Country
- Historical Market Size Value (USD Billion) Trend Analysis By Market Taxonomy, 2021 to 2025
- Market Size Value (USD Billion) Forecast By Market Taxonomy, 2026 to 2036
- By Country
- India
- ASEAN
- Australia and New Zealand
- By Imaging Type
- By Platform
- By Application
- By End Use
- By Sales Model
- By Country
- Market Attractiveness Analysis
- By Country
- By Imaging Type
- By Platform
- By Application
- By End Use
- By Sales Model
- Key Takeaways
- Middle East and Africa Market Analysis and Forecast, By Country
- Historical Market Size Value (USD Billion) Trend Analysis By Market Taxonomy, 2021 to 2025
- Market Size Value (USD Billion) Forecast By Market Taxonomy, 2026 to 2036
- By Country
- GCC Countries
- South Africa
- Türkiye
- Israel
- By Imaging Type
- By Platform
- By Application
- By End Use
- By Sales Model
- By Country
- Market Attractiveness Analysis
- By Country
- By Imaging Type
- By Platform
- By Application
- By End Use
- By Sales Model
- Key Takeaways
- Key Countries Market Analysis
- United States
- Pricing Analysis
- Market Share Analysis, 2025
- By Imaging Type
- By Platform
- By Application
- By End Use
- By Sales Model
- Canada
- Pricing Analysis
- Market Share Analysis, 2025
- By Imaging Type
- By Platform
- By Application
- By End Use
- By Sales Model
- Mexico
- Pricing Analysis
- Market Share Analysis, 2025
- By Imaging Type
- By Platform
- By Application
- By End Use
- By Sales Model
- Brazil
- Pricing Analysis
- Market Share Analysis, 2025
- By Imaging Type
- By Platform
- By Application
- By End Use
- By Sales Model
- Chile
- Pricing Analysis
- Market Share Analysis, 2025
- By Imaging Type
- By Platform
- By Application
- By End Use
- By Sales Model
- Germany
- Pricing Analysis
- Market Share Analysis, 2025
- By Imaging Type
- By Platform
- By Application
- By End Use
- By Sales Model
- United Kingdom
- Pricing Analysis
- Market Share Analysis, 2025
- By Imaging Type
- By Platform
- By Application
- By End Use
- By Sales Model
- Italy
- Pricing Analysis
- Market Share Analysis, 2025
- By Imaging Type
- By Platform
- By Application
- By End Use
- By Sales Model
- Spain
- Pricing Analysis
- Market Share Analysis, 2025
- By Imaging Type
- By Platform
- By Application
- By End Use
- By Sales Model
- France
- Pricing Analysis
- Market Share Analysis, 2025
- By Imaging Type
- By Platform
- By Application
- By End Use
- By Sales Model
- India
- Pricing Analysis
- Market Share Analysis, 2025
- By Imaging Type
- By Platform
- By Application
- By End Use
- By Sales Model
- ASEAN
- Pricing Analysis
- Market Share Analysis, 2025
- By Imaging Type
- By Platform
- By Application
- By End Use
- By Sales Model
- Australia and New Zealand
- Pricing Analysis
- Market Share Analysis, 2025
- By Imaging Type
- By Platform
- By Application
- By End Use
- By Sales Model
- China
- Pricing Analysis
- Market Share Analysis, 2025
- By Imaging Type
- By Platform
- By Application
- By End Use
- By Sales Model
- Japan
- Pricing Analysis
- Market Share Analysis, 2025
- By Imaging Type
- By Platform
- By Application
- By End Use
- By Sales Model
- South Korea
- Pricing Analysis
- Market Share Analysis, 2025
- By Imaging Type
- By Platform
- By Application
- By End Use
- By Sales Model
- Poland
- Pricing Analysis
- Market Share Analysis, 2025
- By Imaging Type
- By Platform
- By Application
- By End Use
- By Sales Model
- Hungary
- Pricing Analysis
- Market Share Analysis, 2025
- By Imaging Type
- By Platform
- By Application
- By End Use
- By Sales Model
- Türkiye
- Pricing Analysis
- Market Share Analysis, 2025
- By Imaging Type
- By Platform
- By Application
- By End Use
- By Sales Model
- South Africa
- Pricing Analysis
- Market Share Analysis, 2025
- By Imaging Type
- By Platform
- By Application
- By End Use
- By Sales Model
- Australia
- Pricing Analysis
- Market Share Analysis, 2025
- By Imaging Type
- By Platform
- By Application
- By End Use
- By Sales Model
- Argentina
- Pricing Analysis
- Market Share Analysis, 2025
- By Imaging Type
- By Platform
- By Application
- By End Use
- By Sales Model
- United States
- Market Structure Analysis
- Competition Dashboard
- Competition Benchmarking
- Market Share Analysis of Top Players
- By Regional
- By Imaging Type
- By Platform
- By Application
- By End Use
- By Sales Model
- Emerging Startups
- Innovation Benchmarking
- Competition Analysis
- Competition Deep Dive
- DJI Agriculture
- Overview
- Product Portfolio
- Profitability by Market Segments
- Sales Footprint
- Strategy Overview
- Marketing Strategy
- Product Strategy
- Channel Strategy
- Trimble
- John Deere
- Sentera
- Taranis
- AgEagle
- MicaSense / AgEagle
- Planet Labs
- Pix4D
- DJI Agriculture
- Case Studies
- Success Stories
- Recent Developments
- Competition Deep Dive
- Assumptions & Acronyms Used


