AI for Hydroponic Farming Market Size and Share Forecast Outlook 2025 to 2035

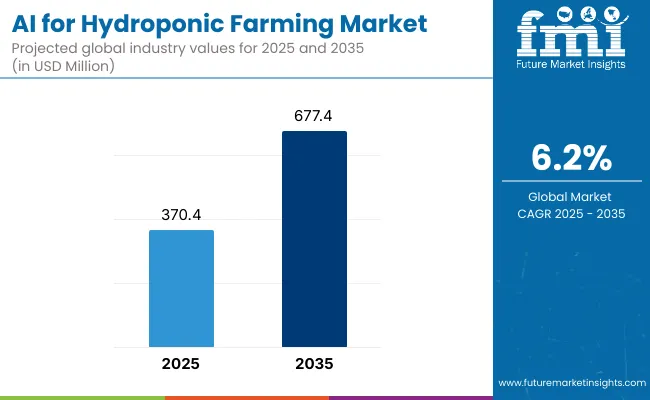
The AI for Hydroponic Farming Market is expected to record a valuation of USD 370.4 million in 2025, reaching USD 677.4 million by 2035, reflecting a 6.2% CAGR over the forecast period. Growth during 2025 to 2030 will be supported by increasing adoption of farm management platforms and predictive analytics software, with the market projected to add nearly USD 123.6 million in incremental value over this half-decade. This expansion will be driven by the need for nutrient optimization, yield forecasting, and real-time monitoring of crop health.
Quick Stats for AI for Hydroponic Farming Market

  • Market Value (2025): USD 370.4 Million
  • Market Forecast Value (2035): USD 677.4 Million
  • Market Forecast CAGR (2025 to 2035): 6.2%
  • Leading Segment in 2025: Farm Management Platforms (28.0% share)
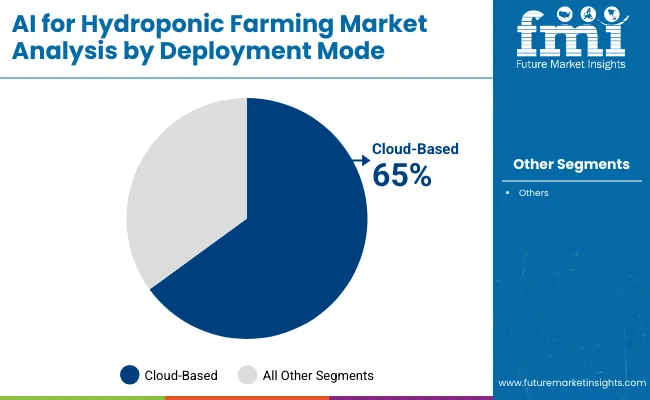
  • Leading Deployment Mode in 2025: Cloud-Based (65.0% share)
  • Key Growth Regions: South Asia & Pacific (7.8% CAGR), East Asia (7.2% CAGR)
  • Top Key Players: Microsoft, IBM, CropX Technologies, Prospera Technologies, AeroFarms, Priva, Netafim, Growlink, Intelligent Growth Solutions, Root AI

Ai For Hydroponic Farming Market

AI for Hydroponic Farming Market Key Takeaways

Metric Value
AI for Hydroponic Farming Market Estimated Value In (2025 E ) USD 370.4 Million
AI for Hydroponic Farming Market Forecast Value In (2035f) USD 677.4 Million
Forecast CAGR (2025 to 2035) 6.2%

Between 2030 and 2035, growth is expected to accelerate further, generating an additional USD 183.4 million in market value. The rapid scale-up of bio-controlled greenhouses and vertical farms, combined with widespread use of AI-powered climate and nutrient management systems, will reinforce adoption. Resource efficiency modules focusing on water and energy optimization will also play a vital role, aligning with sustainability targets.

Deployment preferences strongly favor cloud-based platforms, which account for 65.0% share in 2025 and are expanding at a 7.1% CAGR, supported by scalability, ease of integration, and cost efficiency. On-premise models retain niche importance in research institutes and smaller-scale farms but grow more modestly.

Regionally, the highest growth rates are expected in India (9.8% CAGR) and China (9.1% CAGR), where modernization of agriculture is advancing rapidly. While the United States remains the largest single market with 20% share in 2025, its dominance will ease to 18% by 2035, as Asia-Pacific strengthens its position in technology-driven farming solutions.

From 2020 to 2024, AI adoption in hydroponic farming grew steadily, driven by advances in farm automation and predictive analytics. In 2025, the market is valued at USD 370.4 Million, supported by demand for real-time monitoring and nutrient optimization. By 2035, it is expected to reach USD 677.4 Million, with cloud-based solutions and AI-driven applications in crop monitoring, climate control, and yield forecasting defining the competitive landscape.

Growth momentum will increasingly shift toward Asia-Pacific, where India and China are accelerating agricultural modernization. Competitive advantage will move beyond software availability toward integration strength, ecosystem partnerships, and AI-driven sustainability performance.

Why is the AI for Hydroponic Farming Market growing?

The expansion of the AI for Hydroponic Farming Market between 2025 and 2035 is being driven by the increasing reliance on predictive analytics, automation, and sustainability-focused farming practices. AI-based crop monitoring and imaging software are enabling growers to detect stress, disease, and nutrient deficiencies with greater accuracy, reducing losses and enhancing yield quality.

Cloud-based platforms are further accelerating adoption by providing scalable, cost-efficient solutions that integrate seamlessly with existing farm infrastructure. Governments and private investors are prioritizing water-efficient and energy-optimized systems, positioning AI-enabled resource management as a cornerstone of sustainable agriculture.

In addition, the rising need for continuous food production in urban centers is fueling investment in vertical farms and greenhouses, where AI plays a central role in climate control and nutrient management. Collectively, these advancements are ensuring that AI integration evolves from being an efficiency tool into a strategic enabler of long-term productivity, resilience, and sustainability in hydroponic farming.

Segmental Analysis

The AI for Hydroponic Farming Market is segmented across software type, deployment mode, and application, each reflecting unique growth drivers and adoption trends. Software categories highlight the central role of farm management platforms, predictive analytics, and imaging tools in reshaping precision farming. Deployment mode analysis underscores the growing preference for cloud-based systems, reflecting scalability and cost efficiency, while on-premise solutions retain relevance for research and specialized use cases.

Application trends reveal nutrient optimization, yield forecasting, and crop health monitoring as the most transformative areas of adoption. Together, these segments illustrate how digital ecosystems, sustainability imperatives, and AI-driven decision-making are driving structural change, enabling hydroponic farms to achieve greater efficiency, productivity, and resilience across global markets.
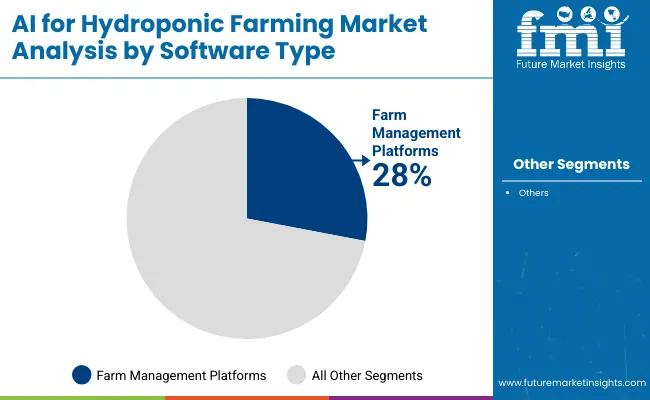
Insights into the Software Type Segment with Farm Management Platforms Leading Market Share

Ai For Hydroponic Farming Market By Software Type

Farm management platforms dominate with 28.0% share in 2025, expanding at 5.2% CAGR, reflecting their central role in resource tracking, scheduling, and performance analytics. Predictive analytics software, with 18.0% share, is expected to grow faster at 6.9% CAGR, as farmers increasingly rely on AI-driven forecasting for crop yield optimization.

Crop monitoring and imaging software, representing 20.0% share, grows at the highest pace of 7.3% CAGR, underlining the importance of early stress detection and health monitoring. Nutrient management tools, growing at 7.8% CAGR, further reinforce efficiency gains in vertical farming and greenhouse systems. While specialized software solutions are expanding, farm management platforms remain the dominant backbone, anchoring integrated operations across farm networks.

Software Type Market Value Share, 2025
Farm Management Platforms 28.00%
Others 72.00%

Insights into the Deployment Mode Segment with Cloud-Based Leading Market Share

Ai For Hydroponic Farming Market By Deployment Mode

Cloud-based platforms lead the market with 65.0% share in 2025, expanding at 7.1% CAGR, supported by scalability, affordability, and accessibility across geographies. They allow real-time updates, integration with IoT sensors, and remote monitoring, making them the preferred choice for commercial growers and agri-tech companies.

On-premise solutions, holding 35.0% share, grow more modestly at 4.5% CAGR, retaining demand in research institutes and niche farming setups that prioritize data sovereignty and offline control. Over the decade, cloud-based platforms will dominate further as AI integration scales, particularly in Asia-Pacific, where farm digitization is accelerating rapidly.

Deployment Mode Market Value Share, 2025
Cloud-Based 65.00%
Others 35.00%

Insights into the Application Segment with Nutrient Formulation & Optimization Leading Market Share

Ai For Hydroponic Farming Market By Application

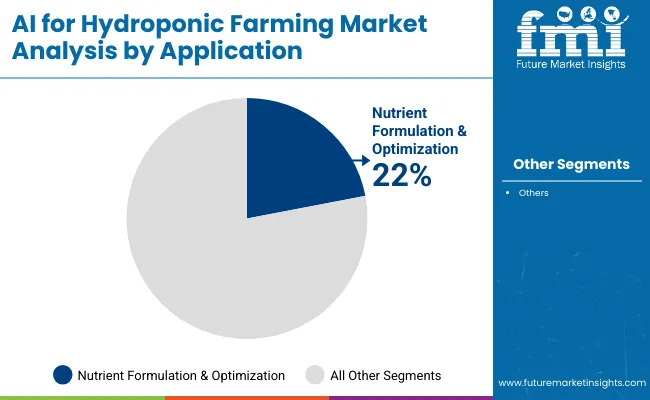
Nutrient formulation and optimization leads with 22.0% share in 2025, growing at 7.2% CAGR, reflecting its importance in ensuring yield consistency and resource efficiency in controlled farming environments. Yield prediction and forecasting, expanding at 7.5% CAGR, is the fastest-growing application, driven by the rising need for AI-driven demand planning and crop output assurance.

Crop health monitoring, with 18.0% share, supports early detection of diseases and pests, integrating seamlessly with imaging technologies. Climate and environmental control remains essential, accounting for 20.0% share, supported by greenhouse and vertical farm adoption. While multiple applications strengthen adoption, nutrient optimization anchors the market, reinforcing AI’s role in securing sustainable, resource-efficient farming outcomes.

Application Market Value Share, 2025
Nutrient Formulation & Optimization 22.00%
Others 78.00%

What are the Drivers, Restraints, and Key Trends of the AI for Hydroponic Farming Market?

The AI for Hydroponic Farming Market is being shaped by accelerating adoption drivers, structural restraints, and technology-led trends. These forces collectively influence adoption pathways, regional competitiveness, and the transition of hydroponic farming toward data-driven, sustainable, and efficiency-focused production models across the next decade.

Driver: Advancements in Predictive Analytics and Crop Forecasting

A key driver of market growth is the increasing reliance on predictive analytics and yield forecasting software, projected to expand at 6.9% CAGR between 2025 and 2035. AI-powered predictive models allow hydroponic farmers to anticipate crop yields with higher accuracy, reducing risks associated with fluctuating demand and climate uncertainties. This capability supports efficient resource allocation, enabling growers to optimize nutrient delivery, lighting cycles, and water usage based on projected needs.

Predictive analytics is particularly valuable in large-scale vertical farms and greenhouses, where operational efficiency directly impacts profitability. Integration with IoT sensors and imaging platforms further enhances forecasting, as real-time data inputs are continuously analyzed to refine predictions. The growing importance of demand planning in urban agriculture is also driving adoption, as retailers and distributors seek reliable supply chains for fresh produce.

In emerging economies such as India and China, where agricultural modernization is progressing rapidly, predictive analytics offers a solution to scale urban food production sustainably. Over the next decade, predictive analytics is expected to become indispensable, not only for production efficiency but also for enhancing resilience in hydroponic farming systems against market volatility and environmental stressors.

Restraint: High Capital Costs and Integration Challenges

Despite strong adoption potential, high capital costs and integration complexity remain significant restraints in the AI for Hydroponic Farming Market. Hydroponic systems already require substantial investment in infrastructure, climate control, and nutrient delivery technologies.

The integration of advanced AI platforms adds additional costs for software licensing, IoT hardware, data storage, and analytics support. Smaller growers and hobbyist farmers face barriers to entry, as affordability remains limited to large-scale commercial operations and agri-tech companies. Furthermore, integrating AI platforms with existing hydroponic infrastructure requires technical expertise, often necessitating external consulting and training services. On-premise solutions, while preferred in research institutes, also impose costs linked to server maintenance and system upgrades.

Data management challenges further complicate adoption, as continuous monitoring generates vast datasets that require robust analytics pipelines to extract actionable insights. These barriers disproportionately affect adoption in developing regions, where resource constraints limit access to advanced technologies.

While cloud-based deployment lowers some financial hurdles by reducing upfront infrastructure investment, long-term affordability and return on investment remain concerns for smaller operators. Unless addressed through subsidies, public-private partnerships, or modular low-cost AI solutions, high capital intensity and integration hurdles will continue to restrain widespread adoption of AI in hydroponic farming.
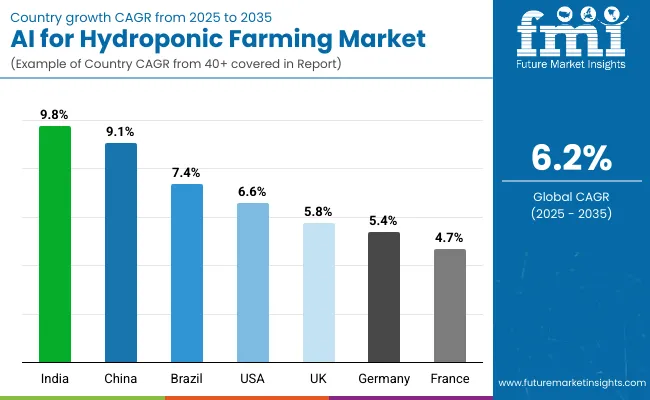
Analysis of AI for Hydroponic Farming Market By Key Countries

Ai For Hydroponic Farming Market Country Wise Analysis

Country CAGR (2025 to 2035)
China 9.10%
India 9.80%
Germany 5.40%
France 4.70%
UK 5.80%
USA 6.60%
Brazil 7.40%

Adoption of AI in hydroponic farming is evolving at different paces across regions, shaped by agricultural modernization, sustainability priorities, and investment capacity. In Asia-Pacific, rapid growth is being recorded as governments and private players scale vertical farming and controlled-environment agriculture to address food security challenges. India, with a forecast CAGR of 9.8%, and China, at 9.1%, are the fastest-expanding national markets, reflecting strong policy support, urban population pressures, and rising venture capital investment in agri-tech startups.

In North America, the United States retains dominance, holding 20% share in 2025, though this is projected to moderate to 18% by 2035 as Asia’s share rises. Growth in the U.S., at 6.6% CAGR, remains tied to commercial hydroponic farms, adoption of predictive analytics, and strong integration of AI-based climate and nutrient optimization platforms.

Europe demonstrates steady but compliance-led growth. Germany and France, with projected CAGRs of 5.4% and 4.7% respectively, emphasize sustainability compliance and data security in AI-enabled farms. The UK, expanding at 5.8% CAGR, is leveraging AI for precision farming and resource efficiency in greenhouse production.

Latin America and the Middle East show emerging opportunities, led by Brazil at 7.4% CAGR, where investment in indoor vertical farming and urban agriculture is creating new adoption pathways.
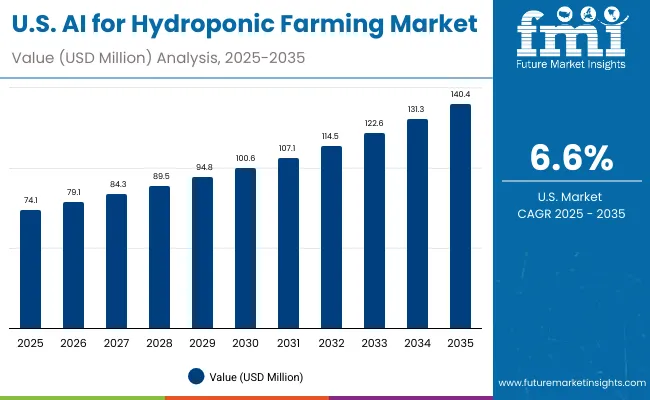
Sales Outlook for AI for Hydroponic Farming in the United States

Usa Ai For Hydroponic Farming Market

Year USA Market (USD Million)
2025 74.1
2026 79.1
2027 84.3
2028 89.5
2029 94.8
2030 100.6
2031 107.1
2032 114.5
2033 122.6
2034 131.3
2035 140.4

A CAGR of 6.6% has been projected for the United States, reflecting expansion in a mature but innovation-driven market. Market share is expected to decline from 20% in 2025 to 18% by 2035, as faster growth in Asia-Pacific reshapes global balances. Adoption is being driven by commercial hydroponic farms integrating AI for predictive analytics, nutrient optimization, and climate control.

Cloud-based platforms dominate due to scalability, while on-premise systems retain relevance in research and institutional applications. High compliance with food safety and traceability requirements reinforces the importance of AI in ensuring consistency and transparency. Despite moderating global share, the U.S. will remain critical as a hub for technological innovation, supported by investments from agri-tech companies and partnerships between AI providers and growers.

  • Commercial hydroponic farms lead adoption.
  • Predictive analytics supports yield forecasting.
  • Cloud-based deployment dominates, supported by scalability.
  • U.S. retains importance despite share decline.

Growth and Expansion Outlook for the AI in Hydroponic Farming Market in the United Kingdom

A CAGR of 5.8% has been projected for the United Kingdom, highlighting steady adoption in a compliance-focused and sustainability-driven market. Market share is forecast to decline from 6% in 2025 to 5% in 2035, as Asia-Pacific gains stronger momentum. The UK market is shaped by greenhouse farming and vertical farms using AI-powered climate control and nutrient management systems.

Demand for crop health monitoring and pest management software is strengthening, as growers align production with clean-label and sustainable food standards. Cloud-based platforms remain the preferred deployment mode, offering integration with IoT-based monitoring systems that support scalability for mid-sized farms. While overall expansion is moderate, the UK retains significance through innovation-led adoption and strong emphasis on resource efficiency in greenhouse production.

  • Greenhouse farms drive AI adoption.
  • Climate control and nutrient management software lead usage.
  • Cloud deployment remains preferred.
  • Market importance tied to sustainability alignment.

Growth and Expansion Outlook for the AI in Hydroponic Farming Market in Germany

A CAGR of 5.4% has been projected for Germany, reflecting steady growth in a market shaped by strict sustainability standards and compliance requirements. Market share is expected to decline from 7% in 2025 to 6% in 2035, as faster adoption in Asia-Pacific offsets Europe’s maturity. German growers are emphasizing AI applications in nutrient formulation and environmental control to align with the European Union’s green transition policies.

On-premise deployment retains relevance due to stringent data security preferences, though cloud-based platforms are steadily gaining ground. Greenhouses form the backbone of AI integration, particularly in vegetables and herbs, where efficiency and quality assurance remain essential. Germany is expected to retain influence through its leadership in precision farming technologies, despite slower growth compared to Asian markets.

  • EU compliance drives AI adoption in hydroponics.
  • Nutrient and climate control software dominate demand.
  • On-premise preferred for data security, cloud adoption growing.
  • Greenhouses anchor adoption in vegetables and herbs.

Growth and Expansion Outlook for the AI in Hydroponic Farming Market in China

A CAGR of 9.1% has been projected for China, positioning it as one of the fastest-expanding national markets globally. Market share is expected to rise from 16% in 2025 to 21% in 2035, overtaking the United States as the largest contributor. Adoption is being driven by rapid scaling of vertical farms and container-based systems in urban centers, supported by government incentives for food security and sustainable farming.

AI-powered predictive analytics and crop imaging solutions are increasingly integrated, enabling farmers to monitor and optimize yields in real time. Cloud-based platforms dominate deployment, offering scalability and cost-effectiveness for large commercial growers. With strong investment in agri-tech startups and advanced indoor farming ecosystems, China is forecast to play a central role in shaping the future of AI-driven hydroponic farming.

  • Market share rises from 16% to 21% by 2035.
  • Vertical farms drive large-scale adoption.
  • Predictive analytics and imaging tools gain traction.
  • Cloud deployment ensures scalability and efficiency

Growth and Expansion Outlook for the AI in Hydroponic Farming Market in India

A CAGR of 9.8% has been projected for India, making it the fastest-growing market globally. Market share is expected to rise from 9% in 2025 to 12% in 2035, reflecting accelerated modernization of agriculture and urban food systems. The surge is being driven by commercial adoption of nutrient optimization and yield forecasting software, which enable scalability in large hydroponic farms supplying urban centers.

Cloud-based platforms dominate, supported by lower infrastructure costs and wide scalability, while AI-powered pest management and crop health monitoring are gaining prominence. Government initiatives promoting sustainable farming and private investment in agri-tech startups are strengthening the ecosystem. By 2035, India is expected to emerge as a key hub for AI-driven hydroponic farming, bridging efficiency, affordability, and scalability.

  • Fastest growth globally at 9.8% CAGR.
  • Nutrient optimization and forecasting software lead adoption.
  • Cloud deployment preferred for scalability.
  • Policy support drives modernization and private investment.

Growth and Expansion Outlook for the AI in Hydroponic Farming Market in Japan

A CAGR of 6.0% has been projected for Japan, reflecting balanced growth in a mature but innovation-focused market. Ethanol and imaging-driven AI applications in vertical farms and greenhouses support adoption, while nutrient management software records the fastest expansion at 8.2% CAGR. Market share is forecast to grow slightly from 8% in 2025 to 9% in 2035, supported by strong investment in urban farming technologies.

Cloud-based platforms dominate deployment, while advanced imaging and automation tools reinforce precision in crop management. Japan’s reputation for technological sophistication positions it as a leader in premium, innovation-led adoption of AI for hydroponics.

  • Nutrient management software grows fastest at 8.2% CAGR.
  • Farm management platforms anchor large-scale adoption.
  • Market share rises slightly to 9% by 2035.
  • Japan leads in premium, innovation-led hydroponics.
Software Type Market Value Share, 2025
Farm Management Platforms 30.00%
Others 70.00%

Growth and Expansion Outlook for the AI in Hydroponic Farming Market in South Korea

A CAGR of 5.6% has been projected for South Korea, reflecting steady growth in a market focused on sustainability and digital integration. Cloud-based platforms dominate adoption, accounting for 68.0% share in 2025, and are expanding rapidly at 7.6% CAGR due to scalability and integration with smart farming ecosystems. On-premise deployment, with 32.0% share, grows more modestly at 4.2% CAGR, but retains importance in research institutions and farms prioritizing data sovereignty.

AI applications in crop monitoring, nutrient optimization, and climate control are reinforcing efficiency across vertical farms and greenhouses, aligning with South Korea’s national carbon neutrality goals. The market’s growth is expected to be shaped by innovation-driven adoption, partnerships between technology providers and local farms, and strong alignment with smart agriculture policies.

  • Cloud deployment expands fastest at 7.6% CAGR.
  • On-premise retains role in research institutions.
  • AI integration supports carbon neutrality goals.
  • Partnerships strengthen smart farming adoption.
Deployment Mode Market Value Share, 2025
Cloud-Based 68.00%
Others 32.00%

Competitive Landscape of AI for Hydroponic Farming Market

Ai For Hydroponic Farming Market By Company

Company Global Value Share 2025
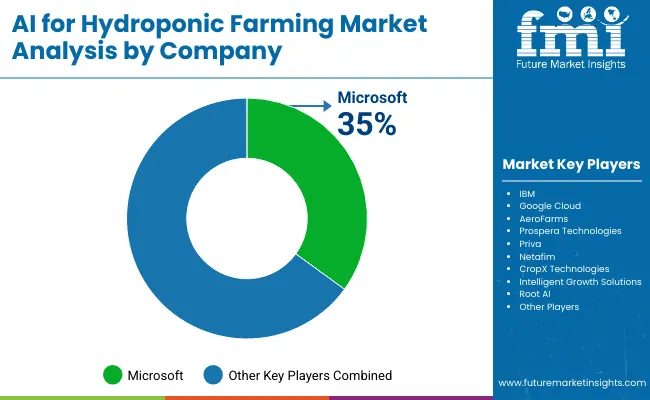
Microsoft 35 .0%
Others 65 .0%

The AI in Hydroponic Farming Market is characterized by a blend of global technology leaders, agri-tech innovators, and specialized solution providers. Established players such as Microsoft, IBM, and Google Cloud are extending their AI platforms into agriculture, offering predictive analytics, imaging solutions, and resource optimization tools tailored for hydroponic systems.

Agri-tech specialists including Prospera Technologies, AeroFarms, Priva, and Netafim have gained recognition through integration of AI with nutrient optimization, crop monitoring, and climate automation. Mid-sized firms and startups are increasingly influential, particularly in Asia-Pacific, where companies such as CropX Technologies and Intelligent Growth Solutions are innovating with cloud-based monitoring platforms and remote AI support services.

Competitive advantage is progressively shifting from standalone software provision to ecosystem integration, where AI solutions are bundled with IoT sensors, automation modules, and real-time data analytics. Partnerships between technology firms and commercial growers are reinforcing adoption, as integrated systems deliver measurable improvements in yield, quality, and resource efficiency.

Subscription-based service models, including remote monitoring and AI-assisted farm management, are gaining traction, providing scalability and accessibility to mid-sized growers. Over the next decade, competitive positioning will increasingly depend on the ability to deliver sustainability-driven, AI-enabled platforms that combine affordability, reliability, and innovation in controlled-environment farming.

Key Developments in AI for Hydroponic Farming Market

  • March 2025 - Microsoft, in partnership with AeroFarms, launched an AI-powered farm management suite integrating predictive analytics and crop monitoring. The solution enables hydroponic growers to optimize yields while reducing energy and water usage, reinforcing the role of cloud-based platforms in sustainable indoor farming.
  • July 2025 - Priva introduced an advanced nutrient management software module, leveraging machine learning for real-time nutrient balancing in hydroponic systems. The release addresses the growing demand for precision control, supporting higher yields and reduced resource consumption across greenhouses and vertical farms in Europe and Asia-Pacific.

Scope of the Report

Item Value
Market Size, 2025 USD 370.4 Million
Market Size, 2035 USD 677.4 Million
Absolute Growth (2025 to 2035) USD 307.0 Million
CAGR (2025 to 2035) 6.20%
Value Added 2025 to 2030 USD 123.6 Million
Value Added 2030 to 2035 USD 183.4 Million
Software Type (2025) Farm Management Platforms: 28.0% (USD 103.7 Million); Others: 72.0%
Deployment Mode (2025) Cloud-Based: 65.0% (USD 240.8 Million); Others: 35.0%
Application (2025) Nutrient Formulation & Optimization: 22.0% (USD 81.5 Million); Others: 78.0%
Farm Type (2025) Indoor Vertical Farms: 40.0%; Greenhouses: 38.0%
Key Growth Regions (CAGR) India 9.8%; China 9.1%; South Asia & Pacific 7.8%; East Asia 7.2%
Regions Covered North America, Latin America, Europe, East Asia, South Asia & Pacific, Middle East & Africa
Countries Covered United States, United Kingdom, Germany, France, China, India, Japan, South Korea, Brazil
Key Companies Profiled Microsoft, IBM, Google Cloud, AeroFarms , Prospera Technologies, Priva , Netafim, CropX Technologies, Intelligent Growth Solutions, Root AI
Additional Attributes Integration of AI with IoT sensors, cloud-based scalability, nutrient optimization, and sustainability alignment drive ado ption.

Key Segments

By Software Type:

  • Farm Management Platforms
  • Predictive Analytics Software
  • Crop Monitoring & Imaging Software
  • Climate Control & Automation Software
  • Nutrient Management Software
  • Supply Chain & Resource Optimization Software
  • Others

By Deployment Mode:

  • Cloud-Based
  • On-Premise

By Application:

  • Nutrient Formulation & Optimization
  • Climate & Environmental Control
  • Yield Prediction & Forecasting
  • Crop Health Monitoring & Disease Detection
  • Pest Prediction & Management
  • Resource Efficiency
  • Others

By Services:

  • Integration & Implementation Services
  • Training & Consulting Services
  • Managed Services

By Farm Type:

  • Indoor Vertical Farms
  • Greenhouses
  • Container Farms
  • Others

By Crop Type:

  • Vegetables (Lettuce, Spinach, Kale, etc.)
  • Fruits (Tomatoes, Strawberries, Berries, etc.)
  • Herbs (Basil, Mint, Parsley, etc.)
  • Flowers & Ornamentals
  • Others

By End User:

  • Commercial Growers
  • Research & Educational Institutes
  • Agri-Tech Companies
  • Hobbyists & Small-Scale Growers

By Region:

  • North America
  • Latin America
  • Europe
  • East Asia
  • South Asia & Pacific
  • Middle East & Africa

Table of Content

  1. Executive Summary
    • Global Market Outlook
    • Demand-side Trends
    • Supply-side Trends
    • Technology Roadmap Analysis
    • Analysis and Recommendations
  2. Market Overview
    • Market Coverage / Taxonomy
    • Market Definition / Scope / Limitations
  3. Market Background
    • Market Dynamics
      • Drivers
      • Restraints
      • Opportunity
      • Trends
    • Scenario Forecast
      • Demand in Optimistic Scenario
      • Demand in Likely Scenario
      • Demand in Conservative Scenario
    • Opportunity Map Analysis
    • Product Life Cycle Analysis
    • Supply Chain Analysis
    • Investment Feasibility Matrix
    • Value Chain Analysis
    • PESTLE and Porter’s Analysis
    • Regulatory Landscape
    • Regional Parent Market Outlook
    • Production and Consumption Statistics
    • Import and Export Statistics
  4. Global Market Analysis 2020 to 2024 and Forecast, 2025 to 2035
    • Historical Market Size Value (USD Million) Analysis, 2020 to 2024
    • Current and Future Market Size Value (USD Million) Projections, 2025 to 2035
      • Y-o-Y Growth Trend Analysis
      • Absolute $ Opportunity Analysis
  5. Global Market Pricing Analysis 2020 to 2024 and Forecast 2025 to 2035
  6. Global Market Analysis 2020 to 2024 and Forecast 2025 to 2035, By Software Type
    • Introduction / Key Findings
    • Historical Market Size Value (USD Million) Analysis By Software Type, 2020 to 2024
    • Current and Future Market Size Value (USD Million) Analysis and Forecast By Software Type, 2025 to 2035
      • Farm Management Platforms
      • Predictive Analytics Software
      • Crop Monitoring & Imaging Software
      • Climate Control & Automation Software
      • Nutrient Management Software
      • Supply Chain & Resource Optimization Software
      • Others
    • Y-o-Y Growth Trend Analysis By Software Type, 2020 to 2024
    • Absolute $ Opportunity Analysis By Software Type, 2025 to 2035
  7. Global Market Analysis 2020 to 2024 and Forecast 2025 to 2035, By Deployment Mode
    • Introduction / Key Findings
    • Historical Market Size Value (USD Million) Analysis By Deployment Mode, 2020 to 2024
    • Current and Future Market Size Value (USD Million) Analysis and Forecast By Deployment Mode, 2025 to 2035
      • Cloud-Based
      • On-Premise
    • Y-o-Y Growth Trend Analysis By Deployment Mode, 2020 to 2024
    • Absolute $ Opportunity Analysis By Deployment Mode, 2025 to 2035
  8. Global Market Analysis 2020 to 2024 and Forecast 2025 to 2035, By Application
    • Introduction / Key Findings
    • Historical Market Size Value (USD Million) Analysis By Application, 2020 to 2024
    • Current and Future Market Size Value (USD Million) Analysis and Forecast By Application, 2025 to 2035
      • Nutrient Formulation & Optimization
      • Climate & Environmental Control
      • Yield Prediction & Forecasting
      • Crop Health Monitoring & Disease Detection
      • Pest Prediction & Management
      • Resource Efficiency
      • Others
    • Y-o-Y Growth Trend Analysis By Application, 2020 to 2024
    • Absolute $ Opportunity Analysis By Application, 2025 to 2035
  9. Global Market Analysis 2020 to 2024 and Forecast 2025 to 2035, By Services
    • Introduction / Key Findings
    • Historical Market Size Value (USD Million) Analysis By Services, 2020 to 2024
    • Current and Future Market Size Value (USD Million) Analysis and Forecast By Services, 2025 to 2035
      • Integration & Implementation Services
      • Training & Consulting Services
      • Managed Services
    • Y-o-Y Growth Trend Analysis By Services, 2020 to 2024
    • Absolute $ Opportunity Analysis By Services, 2025 to 2035
  10. Global Market Analysis 2020 to 2024 and Forecast 2025 to 2035, By Farm Type
    • Introduction / Key Findings
    • Historical Market Size Value (USD Million) Analysis By Farm Type, 2020 to 2024
    • Current and Future Market Size Value (USD Million) Analysis and Forecast By Farm Type, 2025 to 2035
      • Indoor Vertical Farms
      • Greenhouses
      • Container Farms
      • Others
    • Y-o-Y Growth Trend Analysis By Farm Type, 2020 to 2024
    • Absolute $ Opportunity Analysis By Farm Type, 2025 to 2035
  11. Global Market Analysis 2020 to 2024 and Forecast 2025 to 2035, By Crop Type
    • Introduction / Key Findings
    • Historical Market Size Value (USD Million) Analysis By Crop Type, 2020 to 2024
    • Current and Future Market Size Value (USD Million) Analysis and Forecast By Crop Type, 2025 to 2035
      • Vegetables (Lettuce, Spinach, Kale, etc.)
      • Fruits (Tomatoes, Strawberries, Berries, etc.)
      • Herbs (Basil, Mint, Parsley, etc.)
      • Flowers & Ornamentals
      • Others
    • Y-o-Y Growth Trend Analysis By Crop Type, 2020 to 2024
    • Absolute $ Opportunity Analysis By Crop Type, 2025 to 2035
  12. Global Market Analysis 2020 to 2024 and Forecast 2025 to 2035, By End User
    • Introduction / Key Findings
    • Historical Market Size Value (USD Million) Analysis By End User, 2020 to 2024
    • Current and Future Market Size Value (USD Million) Analysis and Forecast By End User, 2025 to 2035
      • Commercial Growers
      • Research & Educational Institutes
      • Agri-Tech Companies
      • Hobbyists & Small-Scale Growers
    • Y-o-Y Growth Trend Analysis By End User, 2020 to 2024
    • Absolute $ Opportunity Analysis By End User, 2025 to 2035
  13. Global Market Analysis 2020 to 2024 and Forecast 2025 to 2035, By Region
    • Introduction
    • Historical Market Size Value (USD Million) Analysis By Region, 2020 to 2024
    • Current Market Size Value (USD Million) Analysis and Forecast By Region, 2025 to 2035
      • North America
      • Latin America
      • Europe
      • East Asia
      • South Asia & Pacific
      • Middle East & Africa
    • Market Attractiveness Analysis By Region
  14. North America Market Analysis 2020 to 2024 and Forecast 2025 to 2035, By Country
    • Historical Market Size Value (USD Million) Trend Analysis By Market Taxonomy, 2020 to 2024
    • Market Size Value (USD Million) Forecast By Market Taxonomy, 2025 to 2035
      • By Country
        • USA
        • Canada
      • By Software Type
      • By Deployment Mode
      • By Application
      • By Services
      • By Farm Type
      • By Crop Type
      • By End User
    • Market Attractiveness Analysis
      • By Country
      • By Software Type
      • By Deployment Mode
      • By Application
      • By Services
      • By Farm Type
      • By Crop Type
      • By End User
    • Key Takeaways
  15. Latin America Market Analysis 2020 to 2024 and Forecast 2025 to 2035, By Country
    • Historical Market Size Value (USD Million) Trend Analysis By Market Taxonomy, 2020 to 2024
    • Market Size Value (USD Million) Forecast By Market Taxonomy, 2025 to 2035
      • By Country
        • Brazil
        • Mexico
        • Colombia
        • Rest of Latin America
      • By Software Type
      • By Deployment Mode
      • By Application
      • By Services
      • By Farm Type
      • By Crop Type
      • By End User
    • Market Attractiveness Analysis
      • By Country
      • By Software Type
      • By Deployment Mode
      • By Application
      • By Services
      • By Farm Type
      • By Crop Type
      • By End User
    • Key Takeaways
  16. Europe Market Analysis 2020 to 2024 and Forecast 2025 to 2035, By Country
    • Historical Market Size Value (USD Million) Trend Analysis By Market Taxonomy, 2020 to 2024
    • Market Size Value (USD Million) Forecast By Market Taxonomy, 2025 to 2035
      • By Country
        • Germany
        • UK
        • France
        • Italy
        • Spain
        • Belgium
        • Netherlands
        • Nordic
        • Russia
        • Poland
        • Switzerland
        • Rest of Europe
      • By Software Type
      • By Deployment Mode
      • By Application
      • By Services
      • By Farm Type
      • By Crop Type
      • By End User
    • Market Attractiveness Analysis
      • By Country
      • By Software Type
      • By Deployment Mode
      • By Application
      • By Services
      • By Farm Type
      • By Crop Type
      • By End User
    • Key Takeaways
  17. East Asia Market Analysis 2020 to 2024 and Forecast 2025 to 2035, By Country
    • Historical Market Size Value (USD Million) Trend Analysis By Market Taxonomy, 2020 to 2024
    • Market Size Value (USD Million) Forecast By Market Taxonomy, 2025 to 2035
      • By Country
        • China
        • Japan
        • South Korea
      • By Software Type
      • By Deployment Mode
      • By Application
      • By Services
      • By Farm Type
      • By Crop Type
      • By End User
    • Market Attractiveness Analysis
      • By Country
      • By Software Type
      • By Deployment Mode
      • By Application
      • By Services
      • By Farm Type
      • By Crop Type
      • By End User
    • Key Takeaways
  18. South Asia & Pacific Market Analysis 2020 to 2024 and Forecast 2025 to 2035, By Country
    • Historical Market Size Value (USD Million) Trend Analysis By Market Taxonomy, 2020 to 2024
    • Market Size Value (USD Million) Forecast By Market Taxonomy, 2025 to 2035
      • By Country
        • India
        • Thailand
        • Malaysia
        • Indonesia
        • Singapore
        • Vietnam
        • Australia
        • New Zealand
        • Rest of South Asia & Pacific
      • By Software Type
      • By Deployment Mode
      • By Application
      • By Services
      • By Farm Type
      • By Crop Type
      • By End User
    • Market Attractiveness Analysis
      • By Country
      • By Software Type
      • By Deployment Mode
      • By Application
      • By Services
      • By Farm Type
      • By Crop Type
      • By End User
    • Key Takeaways
  19. Middle East & Africa Market Analysis 2020 to 2024 and Forecast 2025 to 2035, By Country
    • Historical Market Size Value (USD Million) Trend Analysis By Market Taxonomy, 2020 to 2024
    • Market Size Value (USD Million) Forecast By Market Taxonomy, 2025 to 2035
      • By Country
        • Turkey
        • UAE
        • Saudi Arabia
        • Israel
        • Other GCC Countries
        • North Africa
        • South Africa
        • Central Africa
      • By Software Type
      • By Deployment Mode
      • By Application
      • By Services
      • By Farm Type
      • By Crop Type
      • By End User
    • Market Attractiveness Analysis
      • By Country
      • By Software Type
      • By Deployment Mode
      • By Application
      • By Services
      • By Farm Type
      • By Crop Type
      • By End User
    • Key Takeaways
  20. Key Countries Market Analysis
    • USA
      • Pricing Analysis
      • Market Share Analysis, 2024
        • By Software Type
        • By Deployment Mode
        • By Application
        • By Services
        • By Farm Type
        • By Crop Type
        • By End User
    • Canada
      • Pricing Analysis
      • Market Share Analysis, 2024
        • By Software Type
        • By Deployment Mode
        • By Application
        • By Services
        • By Farm Type
        • By Crop Type
        • By End User
    • Brazil
      • Pricing Analysis
      • Market Share Analysis, 2024
        • By Software Type
        • By Deployment Mode
        • By Application
        • By Services
        • By Farm Type
        • By Crop Type
        • By End User
    • Mexico
      • Pricing Analysis
      • Market Share Analysis, 2024
        • By Software Type
        • By Deployment Mode
        • By Application
        • By Services
        • By Farm Type
        • By Crop Type
        • By End User
    • Columbia
      • Pricing Analysis
      • Market Share Analysis, 2024
        • By Software Type
        • By Deployment Mode
        • By Application
        • By Services
        • By Farm Type
        • By Crop Type
        • By End User
    • Germany
      • Pricing Analysis
      • Market Share Analysis, 2024
        • By Software Type
        • By Deployment Mode
        • By Application
        • By Services
        • By Farm Type
        • By Crop Type
        • By End User
    • UK
      • Pricing Analysis
      • Market Share Analysis, 2024
        • By Software Type
        • By Deployment Mode
        • By Application
        • By Services
        • By Farm Type
        • By Crop Type
        • By End User
    • France
      • Pricing Analysis
      • Market Share Analysis, 2024
        • By Software Type
        • By Deployment Mode
        • By Application
        • By Services
        • By Farm Type
        • By Crop Type
        • By End User
    • Italy
      • Pricing Analysis
      • Market Share Analysis, 2024
        • By Software Type
        • By Deployment Mode
        • By Application
        • By Services
        • By Farm Type
        • By Crop Type
        • By End User
    • Spain
      • Pricing Analysis
      • Market Share Analysis, 2024
        • By Software Type
        • By Deployment Mode
        • By Application
        • By Services
        • By Farm Type
        • By Crop Type
        • By End User
    • Belgium
      • Pricing Analysis
      • Market Share Analysis, 2024
        • By Software Type
        • By Deployment Mode
        • By Application
        • By Services
        • By Farm Type
        • By Crop Type
        • By End User
    • Netherlands
      • Pricing Analysis
      • Market Share Analysis, 2024
        • By Software Type
        • By Deployment Mode
        • By Application
        • By Services
        • By Farm Type
        • By Crop Type
        • By End User
    • Nordic
      • Pricing Analysis
      • Market Share Analysis, 2024
        • By Software Type
        • By Deployment Mode
        • By Application
        • By Services
        • By Farm Type
        • By Crop Type
        • By End User
    • Russia
      • Pricing Analysis
      • Market Share Analysis, 2024
        • By Software Type
        • By Deployment Mode
        • By Application
        • By Services
        • By Farm Type
        • By Crop Type
        • By End User
    • Poland
      • Pricing Analysis
      • Market Share Analysis, 2024
        • By Software Type
        • By Deployment Mode
        • By Application
        • By Services
        • By Farm Type
        • By Crop Type
        • By End User
    • Switzerland
      • Pricing Analysis
      • Market Share Analysis, 2024
        • By Software Type
        • By Deployment Mode
        • By Application
        • By Services
        • By Farm Type
        • By Crop Type
        • By End User
    • China
      • Pricing Analysis
      • Market Share Analysis, 2024
        • By Software Type
        • By Deployment Mode
        • By Application
        • By Services
        • By Farm Type
        • By Crop Type
        • By End User
    • Japan
      • Pricing Analysis
      • Market Share Analysis, 2024
        • By Software Type
        • By Deployment Mode
        • By Application
        • By Services
        • By Farm Type
        • By Crop Type
        • By End User
    • South Korea
      • Pricing Analysis
      • Market Share Analysis, 2024
        • By Software Type
        • By Deployment Mode
        • By Application
        • By Services
        • By Farm Type
        • By Crop Type
        • By End User
    • India
      • Pricing Analysis
      • Market Share Analysis, 2024
        • By Software Type
        • By Deployment Mode
        • By Application
        • By Services
        • By Farm Type
        • By Crop Type
        • By End User
    • Thailand
      • Pricing Analysis
      • Market Share Analysis, 2024
        • By Software Type
        • By Deployment Mode
        • By Application
        • By Services
        • By Farm Type
        • By Crop Type
        • By End User
    • Malaysia
      • Pricing Analysis
      • Market Share Analysis, 2024
        • By Software Type
        • By Deployment Mode
        • By Application
        • By Services
        • By Farm Type
        • By Crop Type
        • By End User
    • Indonesia
      • Pricing Analysis
      • Market Share Analysis, 2024
        • By Software Type
        • By Deployment Mode
        • By Application
        • By Services
        • By Farm Type
        • By Crop Type
        • By End User
    • Singapore
      • Pricing Analysis
      • Market Share Analysis, 2024
        • By Software Type
        • By Deployment Mode
        • By Application
        • By Services
        • By Farm Type
        • By Crop Type
        • By End User
    • Vietnam
      • Pricing Analysis
      • Market Share Analysis, 2024
        • By Software Type
        • By Deployment Mode
        • By Application
        • By Services
        • By Farm Type
        • By Crop Type
        • By End User
    • Australia
      • Pricing Analysis
      • Market Share Analysis, 2024
        • By Software Type
        • By Deployment Mode
        • By Application
        • By Services
        • By Farm Type
        • By Crop Type
        • By End User
    • New Zealand
      • Pricing Analysis
      • Market Share Analysis, 2024
        • By Software Type
        • By Deployment Mode
        • By Application
        • By Services
        • By Farm Type
        • By Crop Type
        • By End User
    • Turkey
      • Pricing Analysis
      • Market Share Analysis, 2024
        • By Software Type
        • By Deployment Mode
        • By Application
        • By Services
        • By Farm Type
        • By Crop Type
        • By End User
    • UAE
      • Pricing Analysis
      • Market Share Analysis, 2024
        • By Software Type
        • By Deployment Mode
        • By Application
        • By Services
        • By Farm Type
        • By Crop Type
        • By End User
    • Saudi Arabia
      • Pricing Analysis
      • Market Share Analysis, 2024
        • By Software Type
        • By Deployment Mode
        • By Application
        • By Services
        • By Farm Type
        • By Crop Type
        • By End User
  21. Market Structure Analysis
    • Competition Dashboard
    • Competition Benchmarking
    • Market Share Analysis of Top Players
      • By Regional
      • By Software Type
      • By Deployment Mode
      • By Application
      • By Services
      • By Farm Type
      • By Crop Type
      • By End User
  22. Competition Analysis
    • Competition Deep Dive
  23. Assumptions & Acronyms Used
  24. Research Methodology

List of Tables

  • Table 1: Global Market Value (USD Million) Forecast by Region, 2020-2035
  • Table 2: Global Market Value (USD Million) Forecast by Software Type, 2020-2035
  • Table 3: Global Market Value (USD Million) Forecast by Deployment Mode, 2020-2035
  • Table 4: Global Market Value (USD Million) Forecast by Application, 2020-2035
  • Table 5: Global Market Value (USD Million) Forecast by Services, 2020-2035
  • Table 6: Global Market Value (USD Million) Forecast by Farm Type, 2020-2035
  • Table 7: Global Market Value (USD Million) Forecast by Crop Type, 2020-2035
  • Table 8: Global Market Value (USD Million) Forecast by End User, 2020-2035
  • Table 9: North America Market Value (USD Million) Forecast by Country, 2020-2035
  • Table 10: North America Market Value (USD Million) Forecast by Software Type, 2020-2035
  • Table 11: North America Market Value (USD Million) Forecast by Deployment Mode, 2020-2035
  • Table 12: North America Market Value (USD Million) Forecast by Application, 2020-2035
  • Table 13: North America Market Value (USD Million) Forecast by Services, 2020-2035
  • Table 14: North America Market Value (USD Million) Forecast by Farm Type, 2020-2035
  • Table 15: North America Market Value (USD Million) Forecast by Crop Type, 2020-2035
  • Table 16: North America Market Value (USD Million) Forecast by End User, 2020-2035
  • Table 17: Latin America Market Value (USD Million) Forecast by Country, 2020-2035
  • Table 18: Latin America Market Value (USD Million) Forecast by Software Type, 2020-2035
  • Table 19: Latin America Market Value (USD Million) Forecast by Deployment Mode, 2020-2035
  • Table 20: Latin America Market Value (USD Million) Forecast by Application, 2020-2035
  • Table 21: Latin America Market Value (USD Million) Forecast by Services, 2020-2035
  • Table 22: Latin America Market Value (USD Million) Forecast by Farm Type, 2020-2035
  • Table 23: Latin America Market Value (USD Million) Forecast by Crop Type, 2020-2035
  • Table 24: Latin America Market Value (USD Million) Forecast by End User, 2020-2035
  • Table 25: Europe Market Value (USD Million) Forecast by Country, 2020-2035
  • Table 26: Europe Market Value (USD Million) Forecast by Software Type, 2020-2035
  • Table 27: Europe Market Value (USD Million) Forecast by Deployment Mode, 2020-2035
  • Table 28: Europe Market Value (USD Million) Forecast by Application, 2020-2035
  • Table 29: Europe Market Value (USD Million) Forecast by Services, 2020-2035
  • Table 30: Europe Market Value (USD Million) Forecast by Farm Type, 2020-2035
  • Table 31: Europe Market Value (USD Million) Forecast by Crop Type, 2020-2035
  • Table 32: Europe Market Value (USD Million) Forecast by End User, 2020-2035
  • Table 33: East Asia Market Value (USD Million) Forecast by Country, 2020-2035
  • Table 34: East Asia Market Value (USD Million) Forecast by Software Type, 2020-2035
  • Table 35: East Asia Market Value (USD Million) Forecast by Deployment Mode, 2020-2035
  • Table 36: East Asia Market Value (USD Million) Forecast by Application, 2020-2035
  • Table 37: East Asia Market Value (USD Million) Forecast by Services, 2020-2035
  • Table 38: East Asia Market Value (USD Million) Forecast by Farm Type, 2020-2035
  • Table 39: East Asia Market Value (USD Million) Forecast by Crop Type, 2020-2035
  • Table 40: East Asia Market Value (USD Million) Forecast by End User, 2020-2035
  • Table 41: South Asia & Pacific Market Value (USD Million) Forecast by Country, 2020-2035
  • Table 42: South Asia & Pacific Market Value (USD Million) Forecast by Software Type, 2020-2035
  • Table 43: South Asia & Pacific Market Value (USD Million) Forecast by Deployment Mode, 2020-2035
  • Table 44: South Asia & Pacific Market Value (USD Million) Forecast by Application, 2020-2035
  • Table 45: South Asia & Pacific Market Value (USD Million) Forecast by Services, 2020-2035
  • Table 46: South Asia & Pacific Market Value (USD Million) Forecast by Farm Type, 2020-2035
  • Table 47: South Asia & Pacific Market Value (USD Million) Forecast by Crop Type, 2020-2035
  • Table 48: South Asia & Pacific Market Value (USD Million) Forecast by End User, 2020-2035
  • Table 49: Middle East & Africa Market Value (USD Million) Forecast by Country, 2020-2035
  • Table 50: Middle East & Africa Market Value (USD Million) Forecast by Software Type, 2020-2035
  • Table 51: Middle East & Africa Market Value (USD Million) Forecast by Deployment Mode, 2020-2035
  • Table 52: Middle East & Africa Market Value (USD Million) Forecast by Application, 2020-2035
  • Table 53: Middle East & Africa Market Value (USD Million) Forecast by Services, 2020-2035
  • Table 54: Middle East & Africa Market Value (USD Million) Forecast by Farm Type, 2020-2035
  • Table 55: Middle East & Africa Market Value (USD Million) Forecast by Crop Type, 2020-2035
  • Table 56: Middle East & Africa Market Value (USD Million) Forecast by End User, 2020-2035

List of Figures

  • Figure 1: Global Market Pricing Analysis
  • Figure 2: Global Market Value (USD Million) Forecast 2020-2035
  • Figure 3: Global Market Value Share and BPS Analysis by Software Type, 2025 and 2035
  • Figure 4: Global Market Y-o-Y Growth Comparison by Software Type, 2025-2035
  • Figure 5: Global Market Attractiveness Analysis by Software Type
  • Figure 6: Global Market Value Share and BPS Analysis by Deployment Mode, 2025 and 2035
  • Figure 7: Global Market Y-o-Y Growth Comparison by Deployment Mode, 2025-2035
  • Figure 8: Global Market Attractiveness Analysis by Deployment Mode
  • Figure 9: Global Market Value Share and BPS Analysis by Application, 2025 and 2035
  • Figure 10: Global Market Y-o-Y Growth Comparison by Application, 2025-2035
  • Figure 11: Global Market Attractiveness Analysis by Application
  • Figure 12: Global Market Value Share and BPS Analysis by Services, 2025 and 2035
  • Figure 13: Global Market Y-o-Y Growth Comparison by Services, 2025-2035
  • Figure 14: Global Market Attractiveness Analysis by Services
  • Figure 15: Global Market Value Share and BPS Analysis by Farm Type, 2025 and 2035
  • Figure 16: Global Market Y-o-Y Growth Comparison by Farm Type, 2025-2035
  • Figure 17: Global Market Attractiveness Analysis by Farm Type
  • Figure 18: Global Market Value Share and BPS Analysis by Crop Type, 2025 and 2035
  • Figure 19: Global Market Y-o-Y Growth Comparison by Crop Type, 2025-2035
  • Figure 20: Global Market Attractiveness Analysis by Crop Type
  • Figure 21: Global Market Value Share and BPS Analysis by End User, 2025 and 2035
  • Figure 22: Global Market Y-o-Y Growth Comparison by End User, 2025-2035
  • Figure 23: Global Market Attractiveness Analysis by End User
  • Figure 24: Global Market Value (USD Million) Share and BPS Analysis by Region, 2025 and 2035
  • Figure 25: Global Market Y-o-Y Growth Comparison by Region, 2025-2035
  • Figure 26: Global Market Attractiveness Analysis by Region
  • Figure 27: North America Market Incremental $ Opportunity, 2025-2035
  • Figure 28: Latin America Market Incremental $ Opportunity, 2025-2035
  • Figure 29: Europe Market Incremental $ Opportunity, 2025-2035
  • Figure 30: East Asia Market Incremental $ Opportunity, 2025-2035
  • Figure 31: South Asia & Pacific Market Incremental $ Opportunity, 2025-2035
  • Figure 32: Middle East & Africa Market Incremental $ Opportunity, 2025-2035
  • Figure 33: North America Market Value Share and BPS Analysis by Country, 2025 and 2035
  • Figure 34: North America Market Value Share and BPS Analysis by Software Type, 2025 and 2035
  • Figure 35: North America Market Y-o-Y Growth Comparison by Software Type, 2025-2035
  • Figure 36: North America Market Attractiveness Analysis by Software Type
  • Figure 37: North America Market Value Share and BPS Analysis by Deployment Mode, 2025 and 2035
  • Figure 38: North America Market Y-o-Y Growth Comparison by Deployment Mode, 2025-2035
  • Figure 39: North America Market Attractiveness Analysis by Deployment Mode
  • Figure 40: North America Market Value Share and BPS Analysis by Application, 2025 and 2035
  • Figure 41: North America Market Y-o-Y Growth Comparison by Application, 2025-2035
  • Figure 42: North America Market Attractiveness Analysis by Application
  • Figure 43: North America Market Value Share and BPS Analysis by Services, 2025 and 2035
  • Figure 44: North America Market Y-o-Y Growth Comparison by Services, 2025-2035
  • Figure 45: North America Market Attractiveness Analysis by Services
  • Figure 46: North America Market Value Share and BPS Analysis by Farm Type, 2025 and 2035
  • Figure 47: North America Market Y-o-Y Growth Comparison by Farm Type, 2025-2035
  • Figure 48: North America Market Attractiveness Analysis by Farm Type
  • Figure 49: North America Market Value Share and BPS Analysis by Crop Type, 2025 and 2035
  • Figure 50: North America Market Y-o-Y Growth Comparison by Crop Type, 2025-2035
  • Figure 51: North America Market Attractiveness Analysis by Crop Type
  • Figure 52: North America Market Value Share and BPS Analysis by End User, 2025 and 2035
  • Figure 53: North America Market Y-o-Y Growth Comparison by End User, 2025-2035
  • Figure 54: North America Market Attractiveness Analysis by End User
  • Figure 55: Latin America Market Value Share and BPS Analysis by Country, 2025 and 2035
  • Figure 56: Latin America Market Value Share and BPS Analysis by Software Type, 2025 and 2035
  • Figure 57: Latin America Market Y-o-Y Growth Comparison by Software Type, 2025-2035
  • Figure 58: Latin America Market Attractiveness Analysis by Software Type
  • Figure 59: Latin America Market Value Share and BPS Analysis by Deployment Mode, 2025 and 2035
  • Figure 60: Latin America Market Y-o-Y Growth Comparison by Deployment Mode, 2025-2035
  • Figure 61: Latin America Market Attractiveness Analysis by Deployment Mode
  • Figure 62: Latin America Market Value Share and BPS Analysis by Application, 2025 and 2035
  • Figure 63: Latin America Market Y-o-Y Growth Comparison by Application, 2025-2035
  • Figure 64: Latin America Market Attractiveness Analysis by Application
  • Figure 65: Latin America Market Value Share and BPS Analysis by Services, 2025 and 2035
  • Figure 66: Latin America Market Y-o-Y Growth Comparison by Services, 2025-2035
  • Figure 67: Latin America Market Attractiveness Analysis by Services
  • Figure 68: Latin America Market Value Share and BPS Analysis by Farm Type, 2025 and 2035
  • Figure 69: Latin America Market Y-o-Y Growth Comparison by Farm Type, 2025-2035
  • Figure 70: Latin America Market Attractiveness Analysis by Farm Type
  • Figure 71: Latin America Market Value Share and BPS Analysis by Crop Type, 2025 and 2035
  • Figure 72: Latin America Market Y-o-Y Growth Comparison by Crop Type, 2025-2035
  • Figure 73: Latin America Market Attractiveness Analysis by Crop Type
  • Figure 74: Latin America Market Value Share and BPS Analysis by End User, 2025 and 2035
  • Figure 75: Latin America Market Y-o-Y Growth Comparison by End User, 2025-2035
  • Figure 76: Latin America Market Attractiveness Analysis by End User
  • Figure 77: Europe Market Value Share and BPS Analysis by Country, 2025 and 2035
  • Figure 78: Europe Market Value Share and BPS Analysis by Software Type, 2025 and 2035
  • Figure 79: Europe Market Y-o-Y Growth Comparison by Software Type, 2025-2035
  • Figure 80: Europe Market Attractiveness Analysis by Software Type
  • Figure 81: Europe Market Value Share and BPS Analysis by Deployment Mode, 2025 and 2035
  • Figure 82: Europe Market Y-o-Y Growth Comparison by Deployment Mode, 2025-2035
  • Figure 83: Europe Market Attractiveness Analysis by Deployment Mode
  • Figure 84: Europe Market Value Share and BPS Analysis by Application, 2025 and 2035
  • Figure 85: Europe Market Y-o-Y Growth Comparison by Application, 2025-2035
  • Figure 86: Europe Market Attractiveness Analysis by Application
  • Figure 87: Europe Market Value Share and BPS Analysis by Services, 2025 and 2035
  • Figure 88: Europe Market Y-o-Y Growth Comparison by Services, 2025-2035
  • Figure 89: Europe Market Attractiveness Analysis by Services
  • Figure 90: Europe Market Value Share and BPS Analysis by Farm Type, 2025 and 2035
  • Figure 91: Europe Market Y-o-Y Growth Comparison by Farm Type, 2025-2035
  • Figure 92: Europe Market Attractiveness Analysis by Farm Type
  • Figure 93: Europe Market Value Share and BPS Analysis by Crop Type, 2025 and 2035
  • Figure 94: Europe Market Y-o-Y Growth Comparison by Crop Type, 2025-2035
  • Figure 95: Europe Market Attractiveness Analysis by Crop Type
  • Figure 96: Europe Market Value Share and BPS Analysis by End User, 2025 and 2035
  • Figure 97: Europe Market Y-o-Y Growth Comparison by End User, 2025-2035
  • Figure 98: Europe Market Attractiveness Analysis by End User
  • Figure 99: East Asia Market Value Share and BPS Analysis by Country, 2025 and 2035
  • Figure 100: East Asia Market Value Share and BPS Analysis by Software Type, 2025 and 2035
  • Figure 101: East Asia Market Y-o-Y Growth Comparison by Software Type, 2025-2035
  • Figure 102: East Asia Market Attractiveness Analysis by Software Type
  • Figure 103: East Asia Market Value Share and BPS Analysis by Deployment Mode, 2025 and 2035
  • Figure 104: East Asia Market Y-o-Y Growth Comparison by Deployment Mode, 2025-2035
  • Figure 105: East Asia Market Attractiveness Analysis by Deployment Mode
  • Figure 106: East Asia Market Value Share and BPS Analysis by Application, 2025 and 2035
  • Figure 107: East Asia Market Y-o-Y Growth Comparison by Application, 2025-2035
  • Figure 108: East Asia Market Attractiveness Analysis by Application
  • Figure 109: East Asia Market Value Share and BPS Analysis by Services, 2025 and 2035
  • Figure 110: East Asia Market Y-o-Y Growth Comparison by Services, 2025-2035
  • Figure 111: East Asia Market Attractiveness Analysis by Services
  • Figure 112: East Asia Market Value Share and BPS Analysis by Farm Type, 2025 and 2035
  • Figure 113: East Asia Market Y-o-Y Growth Comparison by Farm Type, 2025-2035
  • Figure 114: East Asia Market Attractiveness Analysis by Farm Type
  • Figure 115: East Asia Market Value Share and BPS Analysis by Crop Type, 2025 and 2035
  • Figure 116: East Asia Market Y-o-Y Growth Comparison by Crop Type, 2025-2035
  • Figure 117: East Asia Market Attractiveness Analysis by Crop Type
  • Figure 118: East Asia Market Value Share and BPS Analysis by End User, 2025 and 2035
  • Figure 119: East Asia Market Y-o-Y Growth Comparison by End User, 2025-2035
  • Figure 120: East Asia Market Attractiveness Analysis by End User
  • Figure 121: South Asia & Pacific Market Value Share and BPS Analysis by Country, 2025 and 2035
  • Figure 122: South Asia & Pacific Market Value Share and BPS Analysis by Software Type, 2025 and 2035
  • Figure 123: South Asia & Pacific Market Y-o-Y Growth Comparison by Software Type, 2025-2035
  • Figure 124: South Asia & Pacific Market Attractiveness Analysis by Software Type
  • Figure 125: South Asia & Pacific Market Value Share and BPS Analysis by Deployment Mode, 2025 and 2035
  • Figure 126: South Asia & Pacific Market Y-o-Y Growth Comparison by Deployment Mode, 2025-2035
  • Figure 127: South Asia & Pacific Market Attractiveness Analysis by Deployment Mode
  • Figure 128: South Asia & Pacific Market Value Share and BPS Analysis by Application, 2025 and 2035
  • Figure 129: South Asia & Pacific Market Y-o-Y Growth Comparison by Application, 2025-2035
  • Figure 130: South Asia & Pacific Market Attractiveness Analysis by Application
  • Figure 131: South Asia & Pacific Market Value Share and BPS Analysis by Services, 2025 and 2035
  • Figure 132: South Asia & Pacific Market Y-o-Y Growth Comparison by Services, 2025-2035
  • Figure 133: South Asia & Pacific Market Attractiveness Analysis by Services
  • Figure 134: South Asia & Pacific Market Value Share and BPS Analysis by Farm Type, 2025 and 2035
  • Figure 135: South Asia & Pacific Market Y-o-Y Growth Comparison by Farm Type, 2025-2035
  • Figure 136: South Asia & Pacific Market Attractiveness Analysis by Farm Type
  • Figure 137: South Asia & Pacific Market Value Share and BPS Analysis by Crop Type, 2025 and 2035
  • Figure 138: South Asia & Pacific Market Y-o-Y Growth Comparison by Crop Type, 2025-2035
  • Figure 139: South Asia & Pacific Market Attractiveness Analysis by Crop Type
  • Figure 140: South Asia & Pacific Market Value Share and BPS Analysis by End User, 2025 and 2035
  • Figure 141: South Asia & Pacific Market Y-o-Y Growth Comparison by End User, 2025-2035
  • Figure 142: South Asia & Pacific Market Attractiveness Analysis by End User
  • Figure 143: Middle East & Africa Market Value Share and BPS Analysis by Country, 2025 and 2035
  • Figure 144: Middle East & Africa Market Value Share and BPS Analysis by Software Type, 2025 and 2035
  • Figure 145: Middle East & Africa Market Y-o-Y Growth Comparison by Software Type, 2025-2035
  • Figure 146: Middle East & Africa Market Attractiveness Analysis by Software Type
  • Figure 147: Middle East & Africa Market Value Share and BPS Analysis by Deployment Mode, 2025 and 2035
  • Figure 148: Middle East & Africa Market Y-o-Y Growth Comparison by Deployment Mode, 2025-2035
  • Figure 149: Middle East & Africa Market Attractiveness Analysis by Deployment Mode
  • Figure 150: Middle East & Africa Market Value Share and BPS Analysis by Application, 2025 and 2035
  • Figure 151: Middle East & Africa Market Y-o-Y Growth Comparison by Application, 2025-2035
  • Figure 152: Middle East & Africa Market Attractiveness Analysis by Application
  • Figure 153: Middle East & Africa Market Value Share and BPS Analysis by Services, 2025 and 2035
  • Figure 154: Middle East & Africa Market Y-o-Y Growth Comparison by Services, 2025-2035
  • Figure 155: Middle East & Africa Market Attractiveness Analysis by Services
  • Figure 156: Middle East & Africa Market Value Share and BPS Analysis by Farm Type, 2025 and 2035
  • Figure 157: Middle East & Africa Market Y-o-Y Growth Comparison by Farm Type, 2025-2035
  • Figure 158: Middle East & Africa Market Attractiveness Analysis by Farm Type
  • Figure 159: Middle East & Africa Market Value Share and BPS Analysis by Crop Type, 2025 and 2035
  • Figure 160: Middle East & Africa Market Y-o-Y Growth Comparison by Crop Type, 2025-2035
  • Figure 161: Middle East & Africa Market Attractiveness Analysis by Crop Type
  • Figure 162: Middle East & Africa Market Value Share and BPS Analysis by End User, 2025 and 2035
  • Figure 163: Middle East & Africa Market Y-o-Y Growth Comparison by End User, 2025-2035
  • Figure 164: Middle East & Africa Market Attractiveness Analysis by End User
  • Figure 165: Global Market - Tier Structure Analysis
  • Figure 166: Global Market - Company Share Analysis

Frequently Asked Questions

What is the market size of the AI in Hydroponic Farming Market in 2025?

The market is valued at USD 370.4 Million in 2025, led by strong adoption of farm management platforms and cloud-based solutions.

What is the projected market size by 2035?

The market is expected to reach USD 677.4 Million by 2035, reflecting an absolute growth of USD 307.0 Million.

What is the CAGR for the forecast period 2025 to 2035?

The market is forecast to expand at a 6.2% CAGR during 2025 to 2035.

Which software type dominates the market in 2025?

Farm management platforms dominate the software category, holding 28.0% share in 2025.

Which deployment mode is expanding fastest?

Cloud-based deployment leads with 65.0% share in 2025 and grows at a 7.1% CAGR, supported by scalability and integration with IoT.

Explore Similar Insights

Future Market Insights

AI for Hydroponic Farming Market

Chat With

MaRIA

Hi There, I am MaRIA, Your Market Research Intelligence Assistant. How may I help you?