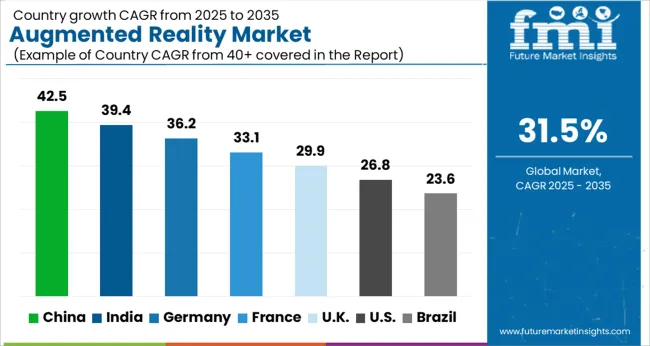
Augmented Reality Market Overview

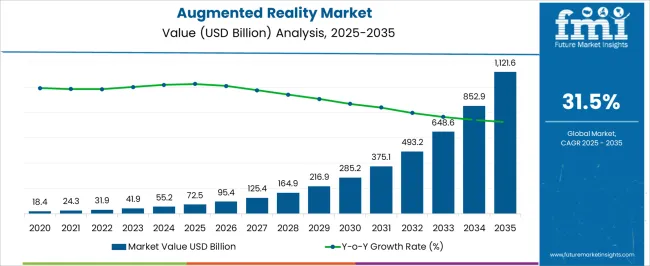
Augmented reality (AR) is on the brink of transforming the entire industrial workplace as well as consumers’ lifestyle. As per latest studies, the global augmented reality market is expected to grow at a tremendous over the forecast period, 2020-2030.

The ability of AR technology to combine real world with super-imposed images is attracting a humongous user base, with the number of mobile AR users slated to reach 2.4 billion by 2023, globally, as per Statista.

While tech giants have been extensively focusing on R&D activities in AR technology, SMEs and start-ups are also showing good signs. Case in point, NTT Docomo has invested US$ 280 Mn in Magic Leap, an AR start-up. Furthermore, players identifying the untapped potential of augmented reality will be better placed for outsized returns.

Market to See Demand Upsurge in Automotive Sector

The automotive industry has been the early adopters of augmented reality technology and continue to be a major driver in its capital performance. Majority of automobiles incorporate AR-based heads-up displays (HUD) that predict information such as state of the vehicles’ systems, speed and mileage, and navigation directions.

Several high-end car models - Toyota Camry, Chevrolet Camaro, and BMW 7 Series – come with AR-based HUDs. Studies find that the adoption of AR-based HUDs is poised to reach about US$ 7 Bn by 2027.

The automotive industry is a conducive ground for innovation and automobile giants are heavily investing in AR automotive technologies that rethink the driving experience. ABI Research reveals that the overall market revenue of AR automotive technologies will surpass US$ 5 Bn in 2022, expanding at 177% CAGR.

Augmented Reality Market – Growth Restraints

While AR technology aids businesses in advancing their processes and services further, its implementation is cost-prohibitive, and requires methodical expertise. As such, application of AR is limited to large-scale enterprises.

AR technology helps in generating, analyzing, and gathering crucial data sets, thus, putting users’ privacy at risk. Moreover, AR systems that capture surroundings in real time raise legal concerns akin to that of shooting videos or pictures of casual individuals or their property, which is prohibited.

AR technology is highly addictive further leading to health problems such as lack of concentration, eye problems, and chronic pain.

Impact of COVID-19 Pandemic on Augmented Reality Market

While the augmented reality market has been following a positive growth trajectory, the coronavirus (COVID-19) pandemic is providing further boost to market growth. Reduced on-site staff due to physical distancing regulations is hindering the operational efficiency of several companies.

However, AR is finding immense usage amid the pandemic, especially in remote assistance. AR-enabled remote assistance offers live video conferencing experience between multiple users.

In addition, it allows the users to add annotations that stick to the elements in the scene, and thus, remain in same place in the physical world as perceived by participants. Such use cases promote highly efficient collaborative between employees working from home, as such, help address the impacts of decreased staffing, travel restrictions, and physical distancing.

Regional Analysis of Augmented Reality Market

North America and Europe continue to hold leading share in augmented reality market, backed by presence of established technology pioneers. As per Statista, by 2021, the number of AR users is expected to hit 85 million in the US alone. Further, the International Data Corporation (IDC) reveals that the US and Western Europe will witness the fastest growth in AR/VR by 2023 – 104.2% CAGR, and 96.1% CAGR respectively.

Going forward, Asia Pacific (APAC) is slated to show robust growth in augmented reality market over the following decade. Subsequent development of AR devices and software for commercial sector in countries such as China is propelling the market growth in this region.

Regional players are investing in R&D to launch various smartphone applications to ensure huge consumer penetration.

Augmented Reality Market: Competitive Landscape

Market leaders are investing in R&D activities to scout out the unexplored areas of application to remain ahead of the curve. For instance,

OrcaMD has launched a medical app named EyeDecide to detect cataract or AMD and, thus, help patients understand the disease clearly.

Augmedics has launched an AR guidance system named xvision spine system to help patients visualize 3D anatomy of spine during surgery.

KaviAR Tech has developed an AR teleportation app that allows users to explore exotic destinations across the world.

Google has rolled out the beta version of its AR walking directions feature for Google Maps that will available to AR-compatible Android and iOS smartphones.

Such initiatives are boosting the product of portfolios of market players, helping them reap bigger returns and reach larger user base.

  • Total Immersion
  • Magic Leap
  • Sony
  • Apple
  • Blippar
  • Wikitude
  • PTC
  • Microsoft
  • Google
  • Infinity Augmented Reality
  • Daqri LLC,
  • ODG.

Region

  • North America (U.S., Canada)
  • Latin America (Mexico, Brazil)
  • Europe (Germany, U.K., France, Italy, Spain, Poland, Russia)
  • East Asia (China, Japan, South Korea)
  • South Asia (India, Thailand, Malaysia, Vietnam, Indonesia)
  • Oceania (Australia, New Zealand)
  • Middle East & Africa (GCC Countries, Turkey, Northern Africa, South Africa)

Taxonomical Analysis of Augmented Reality MarketAugmented reality market can be segmented

on the basis of the following,

By Technology

  • Marker-Based Augmented Reality
  • Marker-less Augmented Reality

By Device Type

  • Head-Mounted Display (HMD)
  • Head-Up Display (HUD)
  • Handheld Device

By Application

  • Consumer
  • Commercial
  • Enterprise
  • Healthcare
  • Aerospace and Defense
  • Energy
  • Automotive
  • Others

Table of Content

  1. Executive Summary - Augmented Reality Market
    • Global Market Outlook
    • Demand-side Trends
    • Supply-side Trends
    • Technology Roadmap Analysis
    • Analysis and Recommendations
  2. Market Overview
    • Market Coverage / Taxonomy
    • Market Definition / Scope / Limitations
    • Inclusion and Exclusion
  3. Value Added Insights
    • Opportunity Map Analysis
    • Product Life Cycle Analysis
    • Supply Chain Analysis
      • Supply Side Participants and their Roles
        • Producers
        • Mid-Level Participants (Traders/ Agents/ Brokers)
        • Wholesalers and Distributors
      • Value Added and Value Created at Node in the Supply Chain
      • List of Raw Material Suppliers
      • List of Existing and Potential Buyers
    • Pricing Analysis of Augmented Reality Market
      • Pricing Analysis By Region
      • Pricing Analysis By Country
      • Pricing Analysis By End Use
      • Pricing Analysis By Distributor
      • Pricing Analysis By Application
    • Value Chain Analysis
      • Profit Margin Analysis
      • Wholesalers and Distributors
      • Retailers
    • Product Portfolio Analysis
    • Regulatory Landscape
      • By Key Regions
      • By Key Countries
    • Regional Parent Market Outlook
    • Production and Consumption Statistics
    • Import and Export Statistics
    • Investment Feasibility Matrix
    • PESTLE Analysis
      • Political Factors
        • Government stability and change
        • Taxation policy and incentives
        • Trade tariffs and import/export regulations
        • Political risk and corruption levels
      • Economic Factors
        • GDP growth and economic cycles
        • Inflation and interest rates
        • Exchange rate fluctuations
        • Unemployment and consumer spending power
      • Social Factors
        • Demographic trends (age, population growth)
        • Cultural attitudes and lifestyle changes
        • Education levels and workforce skills
        • Health consciousness and social values
      • Technological Factors
        • Rate of technological innovation
        • R&D activity and automation trends
        • Digital infrastructure and connectivity
        • Intellectual property protection
      • Legal Factors
        • Employment and labor laws
        • Health & safety regulations
        • Consumer protection laws
        • Data privacy and antitrust legislation
      • Environmental Factors
        • Environmental regulations and compliance
        • Climate change impacts and carbon footprint
        • Resource availability and sustainability practices
        • Waste management and recycling initiatives
    • Market Background and Dynamics
      • Market Dynamics
        • Drivers
        • Restraints
        • Opportunity
        • Trends
      • SWOT Analysis of Global Augmented Reality Market
        • Strengths
        • Weaknesses
        • Opportunities
        • Threats
  4. Global Augmented Reality Market Analysis 2020-2024 and Forecast, 2025-2035
    • Historical Market Size Value (USD Mn) & Volume (Units) Analysis, 2020-2024
    • Current and Future Market Size Value (USD Mn) & Volume (Units) Projections, 2025-2035
      • Y-o-Y Growth Trend Analysis
      • Absolute $ Opportunity Analysis
    • Revenue Forecast Scenario, 2020-2035
      • Conservative Scenario
      • Likely Scenario
      • Optimistic Scenario
  5. Global Augmented Reality Market Analysis 2020-2024 and Forecast 2025-2035, By Application
    • Introduction / Key Findings
    • Historical Market Size Value (USD Mn) & Volume (Units) Analysis By Application, 2020-2024
    • Current and Future Market Size Value (USD Mn) & Volume (Units) Analysis and Forecast By Application, 2025-2035
    • Y-o-Y Growth Trend Analysis By Application, 2020-2024
    • Absolute $ Opportunity Analysis By Application, 2025-2035
    • Market Attractiveness Analysis By Application, 2025-2035
  6. Global Augmented Reality Market Analysis 2020-2024 and Forecast 2025-2035, By End Use
    • Introduction / Key Findings
    • Historical Market Size Value (USD Mn) & Volume (Units) Analysis By End Use, 2020-2024
    • Current and Future Market Size Value (USD Mn) & Volume (Units) Analysis and Forecast By End Use, 2025-2035
    • Y-o-Y Growth Trend Analysis By End Use, 2020-2024
    • Absolute $ Opportunity Analysis By End Use, 2025-2035
    • Market Attractiveness Analysis By End Use, 2025-2035
  7. Global Augmented Reality Market Analysis 2020-2024 and Forecast 2025-2035, By Region
    • Introduction
    • Historical Market Size Value (USD Mn) & Volume (Units) Analysis By Region, 2020-2024
    • Current Market Size Value (USD Mn) & Volume (Units) Analysis and Forecast By Region, 2025-2035
      • North America
      • Latin America
      • Western Europe
      • Eastern Europe
      • East Asia
      • South Asia and Pacific & Pacific
      • MEA
    • Market Attractiveness Analysis By Region
  8. North America Augmented Reality Market Analysis 2020-2024 and Forecast 2025-2035
    • Introduction
    • Historical Market Size Value (USD Mn) & Volume (Units) Trend Analysis By Market Taxonomy, 2020-2024
    • Current and Future Market Size Value (USD Mn) & Volume (Units) Analysis and Forecast By Market Taxonomy, 2025-2035
    • By Country
      • USA
      • Canada
    • By Application
    • By End Use
    • Market Attractiveness Analysis
      • By Country
      • By Application
      • By End Use
    • Market Trends
    • Key Market Participants - Intensity Mapping
    • Drivers and Restraints - Impact Analysis
    • Country Level Analysis & Forecast
      • USA Augmented Reality Market
        • Introduction
        • Market Analysis and Forecast by Market Taxonomy
        • By Application
        • By End Use
      • Canada Augmented Reality Market
        • Introduction
        • Market Analysis and Forecast by Market Taxonomy
        • By Application
        • By End Use
      • Mexico Augmented Reality Market
        • Introduction
        • Market Analysis and Forecast by Market Taxonomy
        • By Application
        • By End Use
  9. Latin America Augmented Reality Market Analysis 2020-2024 and Forecast 2025-2035, By Country
    • Historical Market Size Value (USD Mn) & Volume (Units) Trend Analysis By Market Taxonomy, 2020-2024
    • Market Size Value (USD Mn) & Volume (Units) Forecast By Market Taxonomy, 2025-2035
    • By Country
      • Brazil
      • Argentina
      • Chile
      • Rest of Latin America
    • By Application
    • By End Use
    • Market Attractiveness Analysis
      • By Country
      • By Application
      • By End Use
    • Market Trends
    • Key Market Participants - Intensity Mapping
    • Drivers and Restraints - Impact Analysis
    • Country Level Analysis & Forecast
      • Brazil Augmented Reality Market
        • Introduction
        • Market Analysis and Forecast by Market Taxonomy
        • By Application
        • By End Use
      • Argentina Augmented Reality Market
        • Introduction
        • Market Analysis and Forecast by Market Taxonomy
        • By Application
        • By End Use
      • Chile Augmented Reality Market
        • Introduction
        • Market Analysis and Forecast by Market Taxonomy
        • By Application
        • By End Use
      • Rest of Latin America Augmented Reality Market
        • Introduction
        • Market Analysis and Forecast by Market Taxonomy
        • By Application
        • By End Use
  10. Western Europe Augmented Reality Market Analysis 2020-2024 and Forecast 2025-2035, By Country
    • Historical Market Size Value (USD Mn) & Volume (Units) Trend Analysis By Market Taxonomy, 2020-2024
    • Market Size Value (USD Mn) & Volume (Units) Forecast By Market Taxonomy, 2025-2035
    • By Country
      • Germany
      • UK
      • Italy
      • Spain
      • France
      • Nordic
      • BENELUX
      • Rest of Western Europe
    • By Application
    • By End Use
    • Market Attractiveness Analysis
      • By Country
      • By Application
      • By End Use
    • Key Takeaways
    • Market Trends
    • Key Market Participants - Intensity Mapping
    • Drivers and Restraints - Impact Analysis
    • Country Level Analysis & Forecast
      • Germany Augmented Reality Market
        • Introduction
        • Market Analysis and Forecast by Market Taxonomy
        • By Application
        • By End Use
      • UK Augmented Reality Market
        • Introduction
        • Market Analysis and Forecast by Market Taxonomy
        • By Application
        • By End Use
      • Italy Augmented Reality Market
        • Introduction
        • Market Analysis and Forecast by Market Taxonomy
        • By Application
        • By End Use
      • Spain Augmented Reality Market
        • Introduction
        • Market Analysis and Forecast by Market Taxonomy
        • By Application
        • By End Use
      • France Augmented Reality Market
        • Introduction
        • Market Analysis and Forecast by Market Taxonomy
        • By Application
        • By End Use
      • Nordic Augmented Reality Market
        • Introduction
        • Market Analysis and Forecast by Market Taxonomy
        • By Application
        • By End Use
      • BENELUX Augmented Reality Market
        • Introduction
        • Market Analysis and Forecast by Market Taxonomy
        • By Application
        • By End Use
      • Rest of Western Europe Augmented Reality Market
        • Introduction
        • Market Analysis and Forecast by Market Taxonomy
        • By Application
        • By End Use
  11. Eastern Europe Augmented Reality Market Analysis 2020-2024 and Forecast 2025-2035, By Country
    • Historical Market Size Value (USD Mn) & Volume (Units) Trend Analysis By Market Taxonomy, 2020-2024
    • Market Size Value (USD Mn) & Volume (Units) Forecast By Market Taxonomy, 2025-2035
    • By Country
      • Russia
      • Poland
      • Hungary
      • Balkan & Baltic
      • Rest of Eastern Europe
    • By Application
    • By End Use
    • Market Attractiveness Analysis
      • By Country
      • By Application
      • By End Use
    • Key Takeaways
    • Market Trends
    • Key Market Participants - Intensity Mapping
    • Drivers and Restraints - Impact Analysis
    • Country Level Analysis & Forecast
      • Russia Augmented Reality Market
        • Introduction
        • Market Analysis and Forecast by Market Taxonomy
        • By Application
        • By End Use
      • Poland Augmented Reality Market
        • Introduction
        • Market Analysis and Forecast by Market Taxonomy
        • By Application
        • By End Use
      • Hungary Augmented Reality Market
        • Introduction
        • Market Analysis and Forecast by Market Taxonomy
        • By Application
        • By End Use
      • Balkan & Baltic Augmented Reality Market
        • Introduction
        • Market Analysis and Forecast by Market Taxonomy
        • By Application
        • By End Use
      • Rest of Eastern Europe Augmented Reality Market
        • Introduction
        • Market Analysis and Forecast by Market Taxonomy
        • By Application
        • By End Use
  12. East Asia Augmented Reality Market Analysis 2020-2024 and Forecast 2025-2035, By Country
    • Historical Market Size Value (USD Mn) & Volume (Units) Trend Analysis By Market Taxonomy, 2020-2024
    • Market Size Value (USD Mn) & Volume (Units) Forecast By Market Taxonomy, 2025-2035
    • By Country
      • China
      • Japan
      • South Korea
    • By Application
    • By End Use
    • Market Attractiveness Analysis
      • By Country
      • By Application
      • By End Use
    • Key Takeaways
    • Market Trends
    • Key Market Participants - Intensity Mapping
    • Drivers and Restraints - Impact Analysis
    • Country Level Analysis & Forecast
      • China Augmented Reality Market
        • Introduction
        • Market Analysis and Forecast by Market Taxonomy
        • By Application
        • By End Use
      • Japan Augmented Reality Market
        • Introduction
        • Market Analysis and Forecast by Market Taxonomy
        • By Application
        • By End Use
      • South Korea Augmented Reality Market
        • Introduction
        • Market Analysis and Forecast by Market Taxonomy
        • By Application
        • By End Use
  13. South Asia and Pacific Augmented Reality Market Analysis 2020-2024 and Forecast 2025-2035, By Country
    • Historical Market Size Value (USD Mn) & Volume (Units) Trend Analysis By Market Taxonomy, 2020-2024
    • Market Size Value (USD Mn) & Volume (Units) Forecast By Market Taxonomy, 2025-2035
    • By Country
      • India
      • ASEAN
      • Australia & New Zealand
      • Rest of South Asia and Pacific
    • By Application
    • By End Use
    • Market Attractiveness Analysis
      • By Country
      • By Application
      • By End Use
    • Key Takeaways
    • Market Trends
    • Key Market Participants - Intensity Mapping
    • Drivers and Restraints - Impact Analysis
    • Country Level Analysis & Forecast
      • India Augmented Reality Market
        • Introduction
        • Market Analysis and Forecast by Market Taxonomy
        • By Application
        • By End Use
      • ASEAN Augmented Reality Market
        • Introduction
        • Market Analysis and Forecast by Market Taxonomy
        • By Application
        • By End Use
      • Australia & New Zealand Augmented Reality Market
        • Introduction
        • Market Analysis and Forecast by Market Taxonomy
        • By Application
        • By End Use
      • Rest of South Asia and Pacific Augmented Reality Market
        • Introduction
        • Market Analysis and Forecast by Market Taxonomy
        • By Application
        • By End Use
  14. MEA Augmented Reality Market Analysis 2020-2024 and Forecast 2025-2035, By Country
    • Historical Market Size Value (USD Mn) & Volume (Units) Trend Analysis By Market Taxonomy, 2020-2024
    • Market Size Value (USD Mn) & Volume (Units) Forecast By Market Taxonomy, 2025-2035
    • By Country
      • Kingdom of Saudi Arabia
      • Other GCC Countries
      • Turkiye
      • South Africa
      • Other African Union
      • Rest of Middle East & Africa
    • By Application
    • By End Use
    • Market Attractiveness Analysis
      • By Country
      • By Application
      • By End Use
    • Key Takeaways
    • Market Trends
    • Key Market Participants - Intensity Mapping
    • Drivers and Restraints - Impact Analysis
    • Country Level Analysis & Forecast
      • Kingdom of Saudi Arabia Augmented Reality Market
        • Introduction
        • Market Analysis and Forecast by Market Taxonomy
        • By Application
        • By End Use
      • Other GCC Countries Augmented Reality Market
        • Introduction
        • Market Analysis and Forecast by Market Taxonomy
        • By Application
        • By End Use
      • Turkiye Augmented Reality Market
        • Introduction
        • Market Analysis and Forecast by Market Taxonomy
        • By Application
        • By End Use
      • South Africa Augmented Reality Market
        • Introduction
        • Market Analysis and Forecast by Market Taxonomy
        • By Application
        • By End Use
      • South Africa Augmented Reality Market
        • Introduction
        • Market Analysis and Forecast by Market Taxonomy
        • By Application
        • By End Use
      • Rest of MEA Augmented Reality Market
        • Introduction
        • Market Analysis and Forecast by Market Taxonomy
        • By Application
        • By End Use
      • Rest of MEA Augmented Reality Market
        • Introduction
        • Market Analysis and Forecast by Market Taxonomy
        • By Application
        • By End Use
  15. Market Structure Analysis
    • Competition Dashboard
    • Competition Benchmarking
    • Market Share Analysis of Top Players
      • By Region
      • By Application
      • By End Use
    • Competition Analysis
    • Competition Deep Dive
      • Global Key Players
      • Key Players by Region
      • Key Players by Country
  16. Assumptions & Acronyms Used
  17. Research Methodology

List of Tables

  • Table 1: Global Augmented Reality Market Value (US$ Mn) Forecast by Region, 2020-2035
  • Table 2: Global Augmented Reality Market Volume (Units) Forecast by Region, 2020-2035
  • Table 3: Global Augmented Reality Market Value (US$ Mn) Forecast by Application, 2020-2035
  • Table 4: Global Augmented Reality Market Volume (Units) Forecast by Application, 2020-2035
  • Table 5: Global Augmented Reality Market Value (US$ Mn) Forecast by End Use, 2020-2035
  • Table 6: Global Augmented Reality Market Volume (Units) Forecast by End Use, 2020-2035
  • Table 7: North America Augmented Reality Market Value (US$ Mn) Forecast by Country, 2020-2035
  • Table 8: North America Augmented Reality Market Volume (Units) Forecast by Country, 2020-2035
  • Table 9: North America Augmented Reality Market Value (US$ Mn) Forecast by Application, 2020-2035
  • Table 10: North America Augmented Reality Market Volume (Units) Forecast by Application, 2020-2035
  • Table 11: North America Augmented Reality Market Value (US$ Mn) Forecast by End Use, 2020-2035
  • Table 12: North America Augmented Reality Market Volume (Units) Forecast by End Use, 2020-2035
  • Table 13: Latin America Augmented Reality Market Value (US$ Mn) Forecast by Country, 2020-2035
  • Table 14: Latin America Augmented Reality Market Volume (Units) Forecast by Country, 2020-2035
  • Table 15: Latin America Augmented Reality Market Value (US$ Mn) Forecast by Application, 2020-2035
  • Table 16: Latin America Augmented Reality Market Volume (Units) Forecast by Application, 2020-2035
  • Table 17: Latin America Augmented Reality Market Value (US$ Mn) Forecast by End Use, 2020-2035
  • Table 18: Latin America Augmented Reality Market Volume (Units) Forecast by End Use, 2020-2035
  • Table 19: Europe Augmented Reality Market Value (US$ Mn) Forecast by Country, 2020-2035
  • Table 20: Europe Augmented Reality Market Volume (Units) Forecast by Country, 2020-2035
  • Table 21: Europe Augmented Reality Market Value (US$ Mn) Forecast by Application, 2020-2035
  • Table 22: Europe Augmented Reality Market Volume (Units) Forecast by Application, 2020-2035
  • Table 23: Europe Augmented Reality Market Value (US$ Mn) Forecast by End Use, 2020-2035
  • Table 24: Europe Augmented Reality Market Volume (Units) Forecast by End Use, 2020-2035
  • Table 25: East Asia Augmented Reality Market Value (US$ Mn) Forecast by Country, 2020-2035
  • Table 26: East Asia Augmented Reality Market Volume (Units) Forecast by Country, 2020-2035
  • Table 27: East Asia Augmented Reality Market Value (US$ Mn) Forecast by Application, 2020-2035
  • Table 28: East Asia Augmented Reality Market Volume (Units) Forecast by Application, 2020-2035
  • Table 29: East Asia Augmented Reality Market Value (US$ Mn) Forecast by End Use, 2020-2035
  • Table 30: East Asia Augmented Reality Market Volume (Units) Forecast by End Use, 2020-2035
  • Table 31: South Asia Augmented Reality Market Value (US$ Mn) Forecast by Country, 2020-2035
  • Table 32: South Asia Augmented Reality Market Volume (Units) Forecast by Country, 2020-2035
  • Table 33: South Asia Augmented Reality Market Value (US$ Mn) Forecast by Application, 2020-2035
  • Table 34: South Asia Augmented Reality Market Volume (Units) Forecast by Application, 2020-2035
  • Table 35: South Asia Augmented Reality Market Value (US$ Mn) Forecast by End Use, 2020-2035
  • Table 36: South Asia Augmented Reality Market Volume (Units) Forecast by End Use, 2020-2035
  • Table 37: Oceania Augmented Reality Market Value (US$ Mn) Forecast by Country, 2020-2035
  • Table 38: Oceania Augmented Reality Market Volume (Units) Forecast by Country, 2020-2035
  • Table 39: Oceania Augmented Reality Market Value (US$ Mn) Forecast by Application, 2020-2035
  • Table 40: Oceania Augmented Reality Market Volume (Units) Forecast by Application, 2020-2035
  • Table 41: Oceania Augmented Reality Market Value (US$ Mn) Forecast by End Use, 2020-2035
  • Table 42: Oceania Augmented Reality Market Volume (Units) Forecast by End Use, 2020-2035
  • Table 43: MEA Augmented Reality Market Value (US$ Mn) Forecast by Country, 2020-2035
  • Table 44: MEA Augmented Reality Market Volume (Units) Forecast by Country, 2020-2035
  • Table 45: MEA Augmented Reality Market Value (US$ Mn) Forecast by Application, 2020-2035
  • Table 46: MEA Augmented Reality Market Volume (Units) Forecast by Application, 2020-2035
  • Table 47: MEA Augmented Reality Market Value (US$ Mn) Forecast by End Use, 2020-2035
  • Table 48: MEA Augmented Reality Market Volume (Units) Forecast by End Use, 2020-2035

List of Figures

  • Figure 1: Global Augmented Reality Market Value (US$ Mn) by Application, 2020-2035
  • Figure 2: Global Augmented Reality Market Value (US$ Mn) by End Use, 2020-2035
  • Figure 3: Global Augmented Reality Market Value (US$ Mn) by Region, 2020-2035
  • Figure 4: Global Augmented Reality Market Value (US$ Mn) Analysis by Region, 2020-2035
  • Figure 5: Global Augmented Reality Market Volume (Units) Analysis by Region, 2020-2035
  • Figure 6: Global Augmented Reality Market Value Share (%) and BPS Analysis by Region, 2020-2035
  • Figure 7: Global Augmented Reality Market Y-o-Y Growth (%) Projections by Region, 2020-2035
  • Figure 8: Global Augmented Reality Market Value (US$ Mn) Analysis by Application, 2020-2035
  • Figure 9: Global Augmented Reality Market Volume (Units) Analysis by Application, 2020-2035
  • Figure 10: Global Augmented Reality Market Value Share (%) and BPS Analysis by Application, 2020-2035
  • Figure 11: Global Augmented Reality Market Y-o-Y Growth (%) Projections by Application, 2020-2035
  • Figure 12: Global Augmented Reality Market Value (US$ Mn) Analysis by End Use, 2020-2035
  • Figure 13: Global Augmented Reality Market Volume (Units) Analysis by End Use, 2020-2035
  • Figure 14: Global Augmented Reality Market Value Share (%) and BPS Analysis by End Use, 2020-2035
  • Figure 15: Global Augmented Reality Market Y-o-Y Growth (%) Projections by End Use, 2020-2035
  • Figure 16: Global Augmented Reality Market Attractiveness by Application, 2020-2035
  • Figure 17: Global Augmented Reality Market Attractiveness by End Use, 2020-2035
  • Figure 18: Global Augmented Reality Market Attractiveness by Region, 2020-2035
  • Figure 19: North America Augmented Reality Market Value (US$ Mn) by Application, 2020-2035
  • Figure 20: North America Augmented Reality Market Value (US$ Mn) by End Use, 2020-2035
  • Figure 21: North America Augmented Reality Market Value (US$ Mn) by Country, 2020-2035
  • Figure 22: North America Augmented Reality Market Value (US$ Mn) Analysis by Country, 2020-2035
  • Figure 23: North America Augmented Reality Market Volume (Units) Analysis by Country, 2020-2035
  • Figure 24: North America Augmented Reality Market Value Share (%) and BPS Analysis by Country, 2020-2035
  • Figure 25: North America Augmented Reality Market Y-o-Y Growth (%) Projections by Country, 2020-2035
  • Figure 26: North America Augmented Reality Market Value (US$ Mn) Analysis by Application, 2020-2035
  • Figure 27: North America Augmented Reality Market Volume (Units) Analysis by Application, 2020-2035
  • Figure 28: North America Augmented Reality Market Value Share (%) and BPS Analysis by Application, 2020-2035
  • Figure 29: North America Augmented Reality Market Y-o-Y Growth (%) Projections by Application, 2020-2035
  • Figure 30: North America Augmented Reality Market Value (US$ Mn) Analysis by End Use, 2020-2035
  • Figure 31: North America Augmented Reality Market Volume (Units) Analysis by End Use, 2020-2035
  • Figure 32: North America Augmented Reality Market Value Share (%) and BPS Analysis by End Use, 2020-2035
  • Figure 33: North America Augmented Reality Market Y-o-Y Growth (%) Projections by End Use, 2020-2035
  • Figure 34: North America Augmented Reality Market Attractiveness by Application, 2020-2035
  • Figure 35: North America Augmented Reality Market Attractiveness by End Use, 2020-2035
  • Figure 36: North America Augmented Reality Market Attractiveness by Country, 2020-2035
  • Figure 37: Latin America Augmented Reality Market Value (US$ Mn) by Application, 2020-2035
  • Figure 38: Latin America Augmented Reality Market Value (US$ Mn) by End Use, 2020-2035
  • Figure 39: Latin America Augmented Reality Market Value (US$ Mn) by Country, 2020-2035
  • Figure 40: Latin America Augmented Reality Market Value (US$ Mn) Analysis by Country, 2020-2035
  • Figure 41: Latin America Augmented Reality Market Volume (Units) Analysis by Country, 2020-2035
  • Figure 42: Latin America Augmented Reality Market Value Share (%) and BPS Analysis by Country, 2020-2035
  • Figure 43: Latin America Augmented Reality Market Y-o-Y Growth (%) Projections by Country, 2020-2035
  • Figure 44: Latin America Augmented Reality Market Value (US$ Mn) Analysis by Application, 2020-2035
  • Figure 45: Latin America Augmented Reality Market Volume (Units) Analysis by Application, 2020-2035
  • Figure 46: Latin America Augmented Reality Market Value Share (%) and BPS Analysis by Application, 2020-2035
  • Figure 47: Latin America Augmented Reality Market Y-o-Y Growth (%) Projections by Application, 2020-2035
  • Figure 48: Latin America Augmented Reality Market Value (US$ Mn) Analysis by End Use, 2020-2035
  • Figure 49: Latin America Augmented Reality Market Volume (Units) Analysis by End Use, 2020-2035
  • Figure 50: Latin America Augmented Reality Market Value Share (%) and BPS Analysis by End Use, 2020-2035
  • Figure 51: Latin America Augmented Reality Market Y-o-Y Growth (%) Projections by End Use, 2020-2035
  • Figure 52: Latin America Augmented Reality Market Attractiveness by Application, 2020-2035
  • Figure 53: Latin America Augmented Reality Market Attractiveness by End Use, 2020-2035
  • Figure 54: Latin America Augmented Reality Market Attractiveness by Country, 2020-2035
  • Figure 55: Europe Augmented Reality Market Value (US$ Mn) by Application, 2020-2035
  • Figure 56: Europe Augmented Reality Market Value (US$ Mn) by End Use, 2020-2035
  • Figure 57: Europe Augmented Reality Market Value (US$ Mn) by Country, 2020-2035
  • Figure 58: Europe Augmented Reality Market Value (US$ Mn) Analysis by Country, 2020-2035
  • Figure 59: Europe Augmented Reality Market Volume (Units) Analysis by Country, 2020-2035
  • Figure 60: Europe Augmented Reality Market Value Share (%) and BPS Analysis by Country, 2020-2035
  • Figure 61: Europe Augmented Reality Market Y-o-Y Growth (%) Projections by Country, 2020-2035
  • Figure 62: Europe Augmented Reality Market Value (US$ Mn) Analysis by Application, 2020-2035
  • Figure 63: Europe Augmented Reality Market Volume (Units) Analysis by Application, 2020-2035
  • Figure 64: Europe Augmented Reality Market Value Share (%) and BPS Analysis by Application, 2020-2035
  • Figure 65: Europe Augmented Reality Market Y-o-Y Growth (%) Projections by Application, 2020-2035
  • Figure 66: Europe Augmented Reality Market Value (US$ Mn) Analysis by End Use, 2020-2035
  • Figure 67: Europe Augmented Reality Market Volume (Units) Analysis by End Use, 2020-2035
  • Figure 68: Europe Augmented Reality Market Value Share (%) and BPS Analysis by End Use, 2020-2035
  • Figure 69: Europe Augmented Reality Market Y-o-Y Growth (%) Projections by End Use, 2020-2035
  • Figure 70: Europe Augmented Reality Market Attractiveness by Application, 2020-2035
  • Figure 71: Europe Augmented Reality Market Attractiveness by End Use, 2020-2035
  • Figure 72: Europe Augmented Reality Market Attractiveness by Country, 2020-2035
  • Figure 73: East Asia Augmented Reality Market Value (US$ Mn) by Application, 2020-2035
  • Figure 74: East Asia Augmented Reality Market Value (US$ Mn) by End Use, 2020-2035
  • Figure 75: East Asia Augmented Reality Market Value (US$ Mn) by Country, 2020-2035
  • Figure 76: East Asia Augmented Reality Market Value (US$ Mn) Analysis by Country, 2020-2035
  • Figure 77: East Asia Augmented Reality Market Volume (Units) Analysis by Country, 2020-2035
  • Figure 78: East Asia Augmented Reality Market Value Share (%) and BPS Analysis by Country, 2020-2035
  • Figure 79: East Asia Augmented Reality Market Y-o-Y Growth (%) Projections by Country, 2020-2035
  • Figure 80: East Asia Augmented Reality Market Value (US$ Mn) Analysis by Application, 2020-2035
  • Figure 81: East Asia Augmented Reality Market Volume (Units) Analysis by Application, 2020-2035
  • Figure 82: East Asia Augmented Reality Market Value Share (%) and BPS Analysis by Application, 2020-2035
  • Figure 83: East Asia Augmented Reality Market Y-o-Y Growth (%) Projections by Application, 2020-2035
  • Figure 84: East Asia Augmented Reality Market Value (US$ Mn) Analysis by End Use, 2020-2035
  • Figure 85: East Asia Augmented Reality Market Volume (Units) Analysis by End Use, 2020-2035
  • Figure 86: East Asia Augmented Reality Market Value Share (%) and BPS Analysis by End Use, 2020-2035
  • Figure 87: East Asia Augmented Reality Market Y-o-Y Growth (%) Projections by End Use, 2020-2035
  • Figure 88: East Asia Augmented Reality Market Attractiveness by Application, 2020-2035
  • Figure 89: East Asia Augmented Reality Market Attractiveness by End Use, 2020-2035
  • Figure 90: East Asia Augmented Reality Market Attractiveness by Country, 2020-2035
  • Figure 91: South Asia Augmented Reality Market Value (US$ Mn) by Application, 2020-2035
  • Figure 92: South Asia Augmented Reality Market Value (US$ Mn) by End Use, 2020-2035
  • Figure 93: South Asia Augmented Reality Market Value (US$ Mn) by Country, 2020-2035
  • Figure 94: South Asia Augmented Reality Market Value (US$ Mn) Analysis by Country, 2020-2035
  • Figure 95: South Asia Augmented Reality Market Volume (Units) Analysis by Country, 2020-2035
  • Figure 96: South Asia Augmented Reality Market Value Share (%) and BPS Analysis by Country, 2020-2035
  • Figure 97: South Asia Augmented Reality Market Y-o-Y Growth (%) Projections by Country, 2020-2035
  • Figure 98: South Asia Augmented Reality Market Value (US$ Mn) Analysis by Application, 2020-2035
  • Figure 99: South Asia Augmented Reality Market Volume (Units) Analysis by Application, 2020-2035
  • Figure 100: South Asia Augmented Reality Market Value Share (%) and BPS Analysis by Application, 2020-2035
  • Figure 101: South Asia Augmented Reality Market Y-o-Y Growth (%) Projections by Application, 2020-2035
  • Figure 102: South Asia Augmented Reality Market Value (US$ Mn) Analysis by End Use, 2020-2035
  • Figure 103: South Asia Augmented Reality Market Volume (Units) Analysis by End Use, 2020-2035
  • Figure 104: South Asia Augmented Reality Market Value Share (%) and BPS Analysis by End Use, 2020-2035
  • Figure 105: South Asia Augmented Reality Market Y-o-Y Growth (%) Projections by End Use, 2020-2035
  • Figure 106: South Asia Augmented Reality Market Attractiveness by Application, 2020-2035
  • Figure 107: South Asia Augmented Reality Market Attractiveness by End Use, 2020-2035
  • Figure 108: South Asia Augmented Reality Market Attractiveness by Country, 2020-2035
  • Figure 109: Oceania Augmented Reality Market Value (US$ Mn) by Application, 2020-2035
  • Figure 110: Oceania Augmented Reality Market Value (US$ Mn) by End Use, 2020-2035
  • Figure 111: Oceania Augmented Reality Market Value (US$ Mn) by Country, 2020-2035
  • Figure 112: Oceania Augmented Reality Market Value (US$ Mn) Analysis by Country, 2020-2035
  • Figure 113: Oceania Augmented Reality Market Volume (Units) Analysis by Country, 2020-2035
  • Figure 114: Oceania Augmented Reality Market Value Share (%) and BPS Analysis by Country, 2020-2035
  • Figure 115: Oceania Augmented Reality Market Y-o-Y Growth (%) Projections by Country, 2020-2035
  • Figure 116: Oceania Augmented Reality Market Value (US$ Mn) Analysis by Application, 2020-2035
  • Figure 117: Oceania Augmented Reality Market Volume (Units) Analysis by Application, 2020-2035
  • Figure 118: Oceania Augmented Reality Market Value Share (%) and BPS Analysis by Application, 2020-2035
  • Figure 119: Oceania Augmented Reality Market Y-o-Y Growth (%) Projections by Application, 2020-2035
  • Figure 120: Oceania Augmented Reality Market Value (US$ Mn) Analysis by End Use, 2020-2035
  • Figure 121: Oceania Augmented Reality Market Volume (Units) Analysis by End Use, 2020-2035
  • Figure 122: Oceania Augmented Reality Market Value Share (%) and BPS Analysis by End Use, 2020-2035
  • Figure 123: Oceania Augmented Reality Market Y-o-Y Growth (%) Projections by End Use, 2020-2035
  • Figure 124: Oceania Augmented Reality Market Attractiveness by Application, 2020-2035
  • Figure 125: Oceania Augmented Reality Market Attractiveness by End Use, 2020-2035
  • Figure 126: Oceania Augmented Reality Market Attractiveness by Country, 2020-2035
  • Figure 127: MEA Augmented Reality Market Value (US$ Mn) by Application, 2020-2035
  • Figure 128: MEA Augmented Reality Market Value (US$ Mn) by End Use, 2020-2035
  • Figure 129: MEA Augmented Reality Market Value (US$ Mn) by Country, 2020-2035
  • Figure 130: MEA Augmented Reality Market Value (US$ Mn) Analysis by Country, 2020-2035
  • Figure 131: MEA Augmented Reality Market Volume (Units) Analysis by Country, 2020-2035
  • Figure 132: MEA Augmented Reality Market Value Share (%) and BPS Analysis by Country, 2020-2035
  • Figure 133: MEA Augmented Reality Market Y-o-Y Growth (%) Projections by Country, 2020-2035
  • Figure 134: MEA Augmented Reality Market Value (US$ Mn) Analysis by Application, 2020-2035
  • Figure 135: MEA Augmented Reality Market Volume (Units) Analysis by Application, 2020-2035
  • Figure 136: MEA Augmented Reality Market Value Share (%) and BPS Analysis by Application, 2020-2035
  • Figure 137: MEA Augmented Reality Market Y-o-Y Growth (%) Projections by Application, 2020-2035
  • Figure 138: MEA Augmented Reality Market Value (US$ Mn) Analysis by End Use, 2020-2035
  • Figure 139: MEA Augmented Reality Market Volume (Units) Analysis by End Use, 2020-2035
  • Figure 140: MEA Augmented Reality Market Value Share (%) and BPS Analysis by End Use, 2020-2035
  • Figure 141: MEA Augmented Reality Market Y-o-Y Growth (%) Projections by End Use, 2020-2035
  • Figure 142: MEA Augmented Reality Market Attractiveness by Application, 2020-2035
  • Figure 143: MEA Augmented Reality Market Attractiveness by End Use, 2020-2035
  • Figure 144: MEA Augmented Reality Market Attractiveness by Country, 2020-2035

Explore Similar Insights

Future Market Insights

Augmented Reality Market