Augmented Analytics Market Size and Share Forecast Outlook 2025 to 2035

The Augmented Analytics Market is estimated to be valued at USD 12.8 billion in 2025 and is projected to reach USD 84.3 billion by 2035, registering a compound annual growth rate (CAGR) of 20.7% over the forecast period.
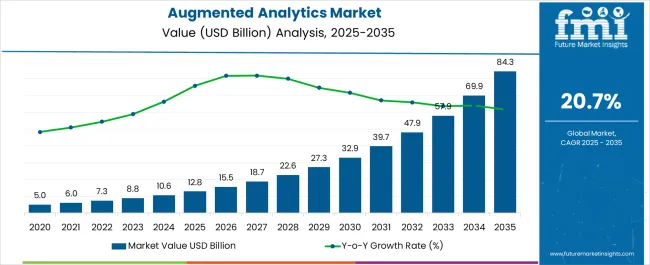
Quick Stats for Augmented Analytics Market

  • Augmented Analytics Market Industry Value (2025): USD 12.8 billion
  • Augmented Analytics Market Forecast Value (2035): USD 84.3 billion
  • Augmented Analytics Market Forecast CAGR: 20.7%
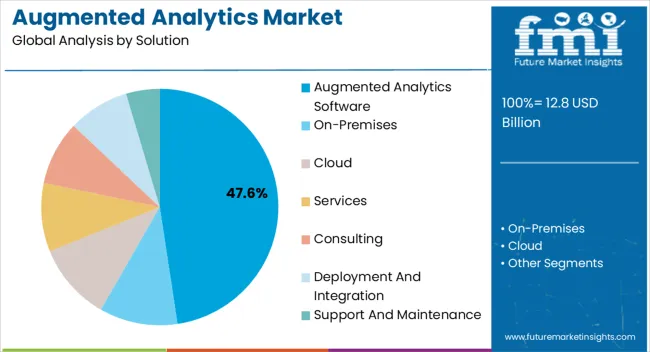
  • Leading Segment in Augmented Analytics Market in 2025: Augmented Analytics Software (47.6%)
  • Key Growth Region in Augmented Analytics Market: North America, Asia-Pacific, Europe
  • Top Key Players in Augmented Analytics Market: Salesforce, SAP, IBM, Microsoft, Oracle, Softengi, MicroStrategy, SAS, Qlik, TIBCO Software, Sisense, Pyramid Analytics, Yellowfin, ThoughtSpot, Domo

Augmented Analytics Market Market Value Analysis

Metric Value
Augmented Analytics Market Estimated Value in (2025 E) USD 12.8 billion
Augmented Analytics Market Forecast Value in (2035 F) USD 84.3 billion
Forecast CAGR (2025 to 2035) 20.7%

Rationale for Segmental Growth in the Augmented Analytics Market

The augmented analytics market is gaining traction as enterprises increasingly adopt artificial intelligence and machine learning-driven tools to enhance data-driven decision-making. Industry publications and corporate disclosures have emphasized the importance of augmented analytics in enabling organizations to automate data preparation, generate predictive insights, and democratize access to analytics across business units. Rising volumes of structured and unstructured data, coupled with pressure to accelerate digital transformation initiatives, have supported adoption.

Investor briefings from technology providers have also outlined significant investments in developing natural language processing capabilities and self-service analytics platforms, making advanced analytics accessible to non-technical users. Furthermore, regulatory requirements for compliance reporting and risk assessment have encouraged the integration of augmented analytics solutions across regulated industries.

As enterprises seek to improve operational efficiency and gain competitive advantage, the market is expected to expand, with strong momentum in software deployment, large enterprise adoption, and BFSI sector applications.
Segmental Analysis

Insights into the Solution Segment: Augmented Analytics Software

Augmented Analytics Market Analysis By Solution

The augmented analytics software segment is projected to account for 47.60% of the market revenue in 2025, underscoring its leadership in the solution category. Growth has been reinforced by enterprises prioritizing software platforms that integrate machine learning algorithms with intuitive dashboards and automated reporting capabilities.

Software providers have consistently introduced enhancements that allow users to generate insights without reliance on complex coding or statistical expertise, broadening user adoption. The segment has also benefitted from subscription-based and cloud-native delivery models, which reduce upfront costs and provide scalability for organizations of all sizes.

Continuous upgrades, integration with existing enterprise systems, and embedded analytics in business applications have sustained the software segment’s leadership. As organizations continue to focus on real-time insights and actionable intelligence, augmented analytics software is expected to remain the cornerstone of market demand.
Insights into the Enterprise Size Segment: Large Enterprises

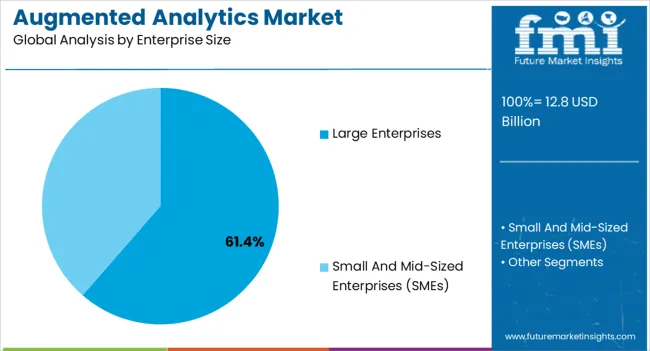
Augmented Analytics Market Analysis By Enterprise Size

The large enterprises segment is expected to contribute 61.40% of the market revenue in 2025, maintaining its dominance in enterprise size. This leadership has been driven by large organizations’ capacity to invest in advanced analytics infrastructure and their pressing need to manage vast and diverse data sets.

Industry updates and annual reports have noted that large enterprises are at the forefront of digital transformation, deploying augmented analytics to optimize processes, improve customer experience, and enhance strategic planning. Their greater IT budgets and established data governance frameworks have facilitated rapid adoption compared to smaller organizations.

Additionally, large enterprises often operate across multiple geographies and industries, requiring scalable solutions capable of handling complex data ecosystems. With growing emphasis on predictive modeling, regulatory compliance, and competitive differentiation, large enterprises are projected to sustain their role as the primary adopters of augmented analytics solutions.
Insights into the Industry Segment: BFSI

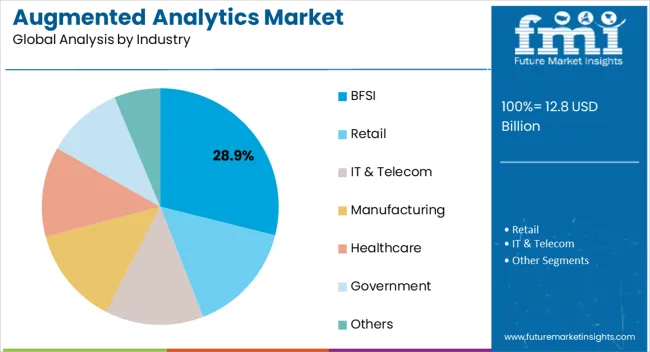
Augmented Analytics Market Analysis By Industry

The BFSI segment is projected to account for 28.90% of the augmented analytics market revenue in 2025, leading the industry verticals in adoption. Growth in this segment has been supported by the sector’s reliance on data for risk assessment, fraud detection, regulatory compliance, and customer analytics.

Financial institutions have increasingly deployed augmented analytics to enhance decision-making accuracy and to streamline operations in areas such as credit scoring and portfolio management. Annual filings and industry analyses have highlighted that BFSI organizations value augmented analytics for its ability to automate reporting processes and ensure compliance with evolving regulatory standards.

Furthermore, customer-facing applications such as personalized banking services and targeted financial products have benefitted from AI-driven analytics. As financial institutions continue to contend with digital disruption and heightened competition from fintech firms, the BFSI segment is expected to remain a significant driver of augmented analytics adoption, reinforcing its market-leading position.

Comparison of Historical Performance from 2020 to 2025 vs Forecast Outlook 2025 to 2035

The augmented analytics market recorded a 19% CAGR between 2020 and 2025. The global demand for augmented analytics is expected to expand at a moderate CAGR of 21.8% over the forecast period 2025 to 2035.

With machine learning and natural language processing in combination with augmented analytics, business users and operational workers can automate data preparation. Platform capabilities are being incorporated into augmented analytics by data professionals.

A number of industries are embracing augmented analytics to address industry-specific challenges and opportunities, including finance, healthcare, retail, and manufacturing. In 2025, retailers will be able to solve customer problems, optimize their operations, and drive growth with advanced business intelligence and augmented analytics.

Historical CAGR from 2020 to 2025 19%
Forecast CAGR from 2025 to 2035 21.8%

As organizations realize the potential of augmented analytics to democratize data analysis, it is likely to become more mainstream. As companies gain insights from their data, augmented analytics tools will be adopted by more small and medium-sized enterprises.

As augmented analytics becomes more integrated with other emerging technologies such as natural language processing (NLP), artificial intelligence (AI), and the IoT (Internet of Things), it will become even more powerful. Data sources and types will be more diverse and can be analyzed more easily.

Key Growth Drivers in the Augmented Analytics Market

  • The latest trends observed in global augmented analytics market are social media, IoT, and business apps are generating a lot of digital data, putting organizations under a lot of pressure.
  • By combining machine learning and natural language processing (NLP), augmented analytics can make sense of a wide range of data sets.
  • Data quality maintenance poses a significant challenge. A high level of accuracy and reliability can be ensured with advanced analytics tools by analyzing, transforming, and enriching data.
  • Artificial intelligence and machine learning heavily influence the algorithms behind augmented analytics. A number of augmented analytics tools are improving their capabilities as these technologies continue to advance.
  • With ever-increasing data volumes, modern businesses need scalable solutions. Growing data demands can be accommodated by enhanced analytics platforms.
  • IT departments are becoming less reliant on business users to do their own data analysis. A user-friendly interface makes it possible for users with no technical background to access and analyze data.
  • The ability to make data-driven decisions gives organizations a competitive advantage. With augmented analytics, they are empowered to analyze their data in a way that produces valuable insights.
  • Increasingly stringent data privacy regulation requires organizations to have tools for managing and protecting their data. Data governance and compliance features are often included in augmented analytics platforms.
  • Automating some aspects of data analysis using augmented analytics can save enormous amounts of time and effort. As a result, organizations may be able to save money.
  • Augmented analytics is attracting a lot of attention from technology vendors, resulting in constant improvements and innovations.
  • Citizen data scientists are often referred to as users who have limited technical training but are capable of using augmented analytics tools to analyze data without technical expertise.
  • Using enhanced analytics, organizations can gain insight and predict future trends, allowing them to take proactive steps to stay ahead of the competition.

Restraints Limiting Growth in the Augmented Analytics Market

  • Business strategies for augmented analytics industry involve a great deal of data analysis, concerns about data security and privacy arise as AI and machine learning become more prevalent. The protection of sensitive and personal data is of utmost importance for organizations.
  • Complex and time-consuming integration of augmented analytics tools can be challenging. Compatibility issues with legacy systems may slow down implementation.
  • For augmented analytics to succeed, skilled data scientists, machine learning experts, and analytics experts are needed. Due to the lack of qualified professionals, using augmented analytics to its full potential is a challenge for many organizations.
  • Various regulations govern data usage and analytics, depending on the augmented analytics industry and region. Adopting augmented analytics may be constrained by regulatory requirements such as HIPAA in healthcare or GDPR in Europe.
  • Infrastructure and tools for augmented analytics can be expensive to implement. A lack of understanding of the long-term benefits or return on investment (ROI) may discourage organizations from investing.
  • A cultural shift and process changes are often required when introducing augmented analytics into an organization. An employee's or stakeholder's resistance to change can be a hindrance.
  • Data sources are a key component of augmented analytics. A limited range of external data may be accessible to some organizations, which can limit the range of insights they can generate.
  • Artificial intelligence-driven technologies can lead to biased results, as can any AI-driven technology. Assuring fairness and addressing ethical concerns are crucial restraints.
  • Augmented analytics solutions' scalability becomes vital as organizations grow. With increasing data volumes and analysis requirements, ensuring the tools can handle them can be difficult.

Analysis of Top Countries Adopting Augmented Analytics

The below table showcases revenues in terms of the top 5 leading countries, spearheaded by Germany and India. These two countries are expected to lead the market through 2035, with sizes of USD 174 million and USD 160 billion.

Expected Market Values in 2035

Germany USD 84.3 million
India USD 160 million
United States USD 258 million
China USD 195 million
United Kingdom USD 178 million

Forecast CAGRs from 2025 to 2035

Germany 7.6%
India 6.5%
United States 16.5%
China 9.6%
United Kingdom 9.9%

Growing Investments and Regulatory Compliance to Drive Demand in Germany

Among the markets for augmented analytics, Germany offers the highest returns. According to augmented analytics market reports Germany is expected to reach USD 84.3 million by 2035, growing at a CAGR of 7.6%. Augmented analytics will likely be most prevalent in industries like automotive and finance.

As organizations become more adept at using these tools, they are gaining more insight into their data. A growing investment in business intelligence and data analytics that include augmented analytics to grow the market.

Increasing privacy concerns and regulatory frameworks are driving companies to develop augmented analytics solutions in order to be compliant with GDPR and other privacy laws.

Several initiatives led by the German government to promote data analytics, artificial intelligence, and digital transformation contributed to the growth of augmented analytics in Germany. Funding, incentives, and resources are often provided by these initiatives with the aim of enhancing the adoption of advanced analytics. In addition to these factors, the market will continue to grow in the future.

Big Data Adoption and Digital Transformation is Expected to Drive Demand in India

The augmented analytics market in India is expected to reach USD 160 million by 2035. A CAGR of 6.5% is predicted for the market over the next ten years. Many industries in India generated significant amounts of data, including e-commerce, healthcare, finance, and telecommunications. Digital transformation initiatives are being undertaken by many businesses in order to stay competitive in the global market.

Customer behavior analysis has become crucial to businesses due to the rise of e-commerce and digital platforms. Companies are enhancing customer experiences and better understand their customers' preferences through augmented analytics. Increasing internet use and Industry 4.0 growth are expected to expand the market.

A Rapid Digitization Process and the Retail Industry to drive the Market in China

Augmented analytics is set to grow at a rapid pace in China, reaching USD 195 million by 2035. The region is expected to register a 9.6% CAGR from 2025 to 2035. China has experienced a tremendous growth in data generation.

Data analytics is one of the key features of the Chinese government's "Made in China 2025" initiative, which promotes the adoption of new technologies. Analytics solutions were made more affordable by this support.

China has one of the world's largest and most dynamic e-commerce sectors. Data-driven decisions were made and companies in this sector using augmented analytics optimized operations. Precision medicine and healthcare data analytics were important innovations in China's healthcare sector. Healthcare management, drug discovery, and patient care were improved by augmented analytics.

Fintech and data-driven approaches were being adopted in China's financial sector for fraud detection, risk assessment, and customer service. A new generation of augmented analytics offers financial institutions more insights into consumer behavior.

A growing number of companies are researching and developing artificial intelligence (AI) and machine learning in China. Data privacy and security have become increasingly important as data usage has increased. To gain a competitive edge in domestic and global markets, Chinese businesses have adopted data analytics and augmented analytics.

Increasing Adoption of Cloud-based Solutions to encourage Uptake in the United States

Increasing research and development activities in the market, as well as cloud adoption, are expected to support growth in demand for augmented analytics. As cloud adoption and solutions continue to increase, the market will thrive. A 16.5% CAGR is predicted for the region between 2025 and 2035. By the end of this forecast period, the United States augmented analytics is likely to total USD 258 million.

Software and services that offer augmented analytics are gaining popularity due to modern infrastructure, an expanding funding market, and diverse customer bases. The United States market is expected to witness rapid growth in the next few years. Business in the United States is shifting toward data-driven business, which will increase market growth.

Artificial Intelligence and Analytics are poised to Flourish in the United Kingdom

The augmented analytics market in the United Kingdom is predicted to expand at a CAGR of 9.9% from 2025 to 2035. The business is expected to be valued at USD 178 million by the end of the forecast period.

Augmented analytics research has been widely implemented in the United Kingdom, and the country has a thriving AI and analytics ecosystem as well. Both startups and established companies developed innovative solutions in response to the growing need for data-driven insights.

Because the United Kingdom is home to a variety of small and large businesses, augmented analytics is expected to grow in demand. There was also a significant role played by the broader digital transformation trend. For improved decision-making, customer engagement, and operational efficiency, organizations have turned to augmented analytics as they seek to modernize their operations.

Augmented Analytics Industry Analysis by Top Investment Segments

As depicted in the table below, augmented analytics software is projected to lead the market in terms of solutions, accumulating a 62.2% share in 2025. The large enterprise segment is likely to accumulate a revenue share of 67.4% through 2025.

Category Market Share in 2025
Augmented Analytics Software 62.2%
Large Enterprises 67.4%

Augmented Analytics Software to Gain Traction in the Market

Based on the solution, the augmented analytics software segment is expected to continue dominating the augmented analytics industry. A market share of 62.2% is expected in 2025.

Traditional data analysis methods were becoming inadequate as organizations generated more, more varied, and faster data. Business users benefit from augmented analytics software by automating a great deal of data processing in the market.

Organizations can access and analyze data using augmented analytics, which is empowering for non-technical users. As the use of data analytics becomes more democratized, there will be a greater need for user-friendly tools.

Making better decisions is facilitated by being able to generate insights rapidly and accurately from data. A heightened understanding of analytics is enabling businesses to gain a competitive edge through augmented analytics. Data professionals and business users can save time by automating data preparation and analysis tasks. With organizations seeking to make faster decisions, this efficiency becomes more important.

Integrated analytics software with seamless integration with existing tools and systems, such as analytics systems and data warehouses, is highly sought after. Investing in technology is a key part of a business's strategy.

Big Data Demand Signals a Revolution for Large Enterprises

By enterprise size, large enterprises are expected to emerge as a prominent segment. A revenue share of 67.4% is projected in 2025. Over the past few years, the demand for the augmented analytics market has increased in popularity in large-scale industries. Market research indicates that large enterprises are highly interested in augmented analytics.

These organizations are increasingly turning to augmented analytics to analyze and make decisions, offering a revolution in decision-making. Massive volumes of data are generated by large enterprises from a variety of sources. Augmented analytics tools that automate data preparation, cleansing, and integration processes can handle this complexity.

As a result, organizations are able to gain insights more easily and efficiently. Self-service analytics capabilities are enabled by augmented analytics for business users.

Data analysis can be democratized across departments since it does not require deep technical expertise, which reduces the need for data specialists within large corporations. The ability to analyze data in real-time or near-real-time can help large enterprises react quickly to changes in the market, customer preferences, or operational challenges.
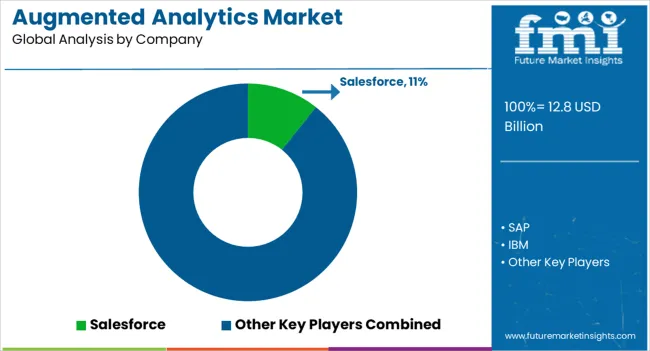
Competitive Landscape of the Augmented Analytics Market

Augmented Analytics Market Analysis By Company

New products and services from leading vendors in emerging markets are addressing new needs and upgrading technology in augmented analytics. As top players in the augmented analytics industry seek competitive advantage, they are forming partnerships, acquiring companies, and expanding their operations.

  • In August 2025, Qlik revealed that the company was recognized on two Constellation ShortLists - Qlik AutoML for Artificial Intelligence and Machine Learning and Qlik Sense for Augmented BI and Analytics. It is designed to enable early adopters and fast-followers to access technology and services that will support their transformation initiatives.
  • In September 2025, Hadean, a British scale-up, will partner with BAE Systems on the development of disruptive, cutting-edge digital technology for military training. BAE Systems has a new enterprise license which lets them integrate state-of-the-art AI and Large Language Models into Hadean Platform for Defence. This will allow military personnel across services, domains, and allies to receive immersive, scalable, and interoperable collective training solutions.

Scope and Coverage of the Augmented Analytics Market Report

Attributes Details
Estimated Market Size in 2025 USD 12.8 billion
Projected Market Valuation in 2035 USD 84.3 billion
Value-based CAGR 2025 to 2035 20.7%
Forecast Period 2025 to 2035
Historical Data Available for 2020 to 2025
Market Analysis Value in USD billion
Key Regions Covered North America; Latin America; Western Europe; Eastern Europe; South Asia and Pacific; East Asia; The Middle East & Africa
Key Market Segments Covered Solution, Enterprise Size, Industry
Key Countries Profiled The United States, Canada, Brazil, Mexico, The United States, Canada, Brazil, Mexico, Germany, The United Kingdom, France, Spain, Italy, Russia, Poland, Czech Republic, Romania, India, Bangladesh, Australia, New Zealand, China, Japan, South Korea, GCC countries, South Africa, Israel
Key Companies Profiled Salesforce; SAP; IBM; Microsoft; Oracle; Softengi; MicroStrategy; SAS; Qlik; TIBCO Software; Sisense; Pyramid Analytics; Yellowfin; ThoughtSpot; Domo

Top Segments Studied in the Augmented Analytics Market Research Report

By Solution:

  • Augmented Analytics Software
  • On-Premises
  • Cloud
  • Services
  • Consulting
  • Deployment and Integration
  • Support and Maintenance

By Enterprise Size:

  • Large Enterprises
  • Small and Mid-Sized Enterprises (SMEs)

By Industry:

  • BFSI
  • Retail
  • IT & Telecom
  • Manufacturing
  • Healthcare
  • Government
  • Others

By Region:

  • North America
  • Latin America
  • Western Europe
  • Eastern Europe
  • South Asia and Pacific
  • East Asia
  • Middle East and Africa

Table of Content

  1. Executive Summary
    • Global Market Outlook
    • Demand-side Trends
    • Supply-side Trends
    • Technology Roadmap Analysis
    • Analysis and Recommendations
  2. Market Overview
    • Market Coverage / Taxonomy
    • Market Definition / Scope / Limitations
  3. Market Background
    • Market Dynamics
      • Drivers
      • Restraints
      • Opportunity
      • Trends
    • Scenario Forecast
      • Demand in Optimistic Scenario
      • Demand in Likely Scenario
      • Demand in Conservative Scenario
    • Opportunity Map Analysis
    • Product Life Cycle Analysis
    • Supply Chain Analysis
    • Investment Feasibility Matrix
    • Value Chain Analysis
    • PESTLE and Porter’s Analysis
    • Regulatory Landscape
    • Regional Parent Market Outlook
    • Production and Consumption Statistics
    • Import and Export Statistics
  4. Global Market Analysis 2020 to 2024 and Forecast, 2025 to 2035
    • Historical Market Size Value (USD Million) Analysis, 2020 to 2024
    • Current and Future Market Size Value (USD Million) Projections, 2025 to 2035
      • Y-o-Y Growth Trend Analysis
      • Absolute $ Opportunity Analysis
  5. Global Market Pricing Analysis 2020 to 2024 and Forecast 2025 to 2035
  6. Global Market Analysis 2020 to 2024 and Forecast 2025 to 2035, By Solution
    • Introduction / Key Findings
    • Historical Market Size Value (USD Million) Analysis By Solution , 2020 to 2024
    • Current and Future Market Size Value (USD Million) Analysis and Forecast By Solution , 2025 to 2035
      • Software
      • On-Premises
      • Cloud
      • Services
      • Consulting
      • Deployment And Integration
      • Support And Maintenance
    • Y-o-Y Growth Trend Analysis By Solution , 2020 to 2024
    • Absolute $ Opportunity Analysis By Solution , 2025 to 2035
  7. Global Market Analysis 2020 to 2024 and Forecast 2025 to 2035, By Enterprise Size
    • Introduction / Key Findings
    • Historical Market Size Value (USD Million) Analysis By Enterprise Size, 2020 to 2024
    • Current and Future Market Size Value (USD Million) Analysis and Forecast By Enterprise Size, 2025 to 2035
      • Large Enterprises
      • Small And Mid-Sized Enterprises (SMEs)
    • Y-o-Y Growth Trend Analysis By Enterprise Size, 2020 to 2024
    • Absolute $ Opportunity Analysis By Enterprise Size, 2025 to 2035
  8. Global Market Analysis 2020 to 2024 and Forecast 2025 to 2035, By Industry
    • Introduction / Key Findings
    • Historical Market Size Value (USD Million) Analysis By Industry, 2020 to 2024
    • Current and Future Market Size Value (USD Million) Analysis and Forecast By Industry, 2025 to 2035
      • BFSI
      • Retail
      • IT & Telecom
      • Manufacturing
      • Healthcare
      • Government
      • Others
    • Y-o-Y Growth Trend Analysis By Industry, 2020 to 2024
    • Absolute $ Opportunity Analysis By Industry, 2025 to 2035
  9. Global Market Analysis 2020 to 2024 and Forecast 2025 to 2035, By Region
    • Introduction
    • Historical Market Size Value (USD Million) Analysis By Region, 2020 to 2024
    • Current Market Size Value (USD Million) Analysis and Forecast By Region, 2025 to 2035
      • North America
      • Latin America
      • Western Europe
      • Eastern Europe
      • East Asia
      • South Asia and Pacific
      • Middle East & Africa
    • Market Attractiveness Analysis By Region
  10. North America Market Analysis 2020 to 2024 and Forecast 2025 to 2035, By Country
    • Historical Market Size Value (USD Million) Trend Analysis By Market Taxonomy, 2020 to 2024
    • Market Size Value (USD Million) Forecast By Market Taxonomy, 2025 to 2035
      • By Country
        • USA
        • Canada
        • Mexico
      • By Solution
      • By Enterprise Size
      • By Industry
    • Market Attractiveness Analysis
      • By Country
      • By Solution
      • By Enterprise Size
      • By Industry
    • Key Takeaways
  11. Latin America Market Analysis 2020 to 2024 and Forecast 2025 to 2035, By Country
    • Historical Market Size Value (USD Million) Trend Analysis By Market Taxonomy, 2020 to 2024
    • Market Size Value (USD Million) Forecast By Market Taxonomy, 2025 to 2035
      • By Country
        • Brazil
        • Chile
        • Rest of Latin America
      • By Solution
      • By Enterprise Size
      • By Industry
    • Market Attractiveness Analysis
      • By Country
      • By Solution
      • By Enterprise Size
      • By Industry
    • Key Takeaways
  12. Western Europe Market Analysis 2020 to 2024 and Forecast 2025 to 2035, By Country
    • Historical Market Size Value (USD Million) Trend Analysis By Market Taxonomy, 2020 to 2024
    • Market Size Value (USD Million) Forecast By Market Taxonomy, 2025 to 2035
      • By Country
        • Germany
        • UK
        • Italy
        • Spain
        • France
        • Nordic
        • BENELUX
        • Rest of Western Europe
      • By Solution
      • By Enterprise Size
      • By Industry
    • Market Attractiveness Analysis
      • By Country
      • By Solution
      • By Enterprise Size
      • By Industry
    • Key Takeaways
  13. Eastern Europe Market Analysis 2020 to 2024 and Forecast 2025 to 2035, By Country
    • Historical Market Size Value (USD Million) Trend Analysis By Market Taxonomy, 2020 to 2024
    • Market Size Value (USD Million) Forecast By Market Taxonomy, 2025 to 2035
      • By Country
        • Russia
        • Poland
        • Hungary
        • Balkan & Baltic
        • Rest of Eastern Europe
      • By Solution
      • By Enterprise Size
      • By Industry
    • Market Attractiveness Analysis
      • By Country
      • By Solution
      • By Enterprise Size
      • By Industry
    • Key Takeaways
  14. East Asia Market Analysis 2020 to 2024 and Forecast 2025 to 2035, By Country
    • Historical Market Size Value (USD Million) Trend Analysis By Market Taxonomy, 2020 to 2024
    • Market Size Value (USD Million) Forecast By Market Taxonomy, 2025 to 2035
      • By Country
        • China
        • Japan
        • South Korea
      • By Solution
      • By Enterprise Size
      • By Industry
    • Market Attractiveness Analysis
      • By Country
      • By Solution
      • By Enterprise Size
      • By Industry
    • Key Takeaways
  15. South Asia and Pacific Market Analysis 2020 to 2024 and Forecast 2025 to 2035, By Country
    • Historical Market Size Value (USD Million) Trend Analysis By Market Taxonomy, 2020 to 2024
    • Market Size Value (USD Million) Forecast By Market Taxonomy, 2025 to 2035
      • By Country
        • India
        • ASEAN
        • Australia & New Zealand
        • Rest of South Asia and Pacific
      • By Solution
      • By Enterprise Size
      • By Industry
    • Market Attractiveness Analysis
      • By Country
      • By Solution
      • By Enterprise Size
      • By Industry
    • Key Takeaways
  16. Middle East & Africa Market Analysis 2020 to 2024 and Forecast 2025 to 2035, By Country
    • Historical Market Size Value (USD Million) Trend Analysis By Market Taxonomy, 2020 to 2024
    • Market Size Value (USD Million) Forecast By Market Taxonomy, 2025 to 2035
      • By Country
        • Kingdom of Saudi Arabia
        • Other GCC Countries
        • Turkiye
        • South Africa
        • Other African Union
        • Rest of Middle East & Africa
      • By Solution
      • By Enterprise Size
      • By Industry
    • Market Attractiveness Analysis
      • By Country
      • By Solution
      • By Enterprise Size
      • By Industry
    • Key Takeaways
  17. Key Countries Market Analysis
    • USA
      • Pricing Analysis
      • Market Share Analysis, 2024
        • By Solution
        • By Enterprise Size
        • By Industry
    • Canada
      • Pricing Analysis
      • Market Share Analysis, 2024
        • By Solution
        • By Enterprise Size
        • By Industry
    • Mexico
      • Pricing Analysis
      • Market Share Analysis, 2024
        • By Solution
        • By Enterprise Size
        • By Industry
    • Brazil
      • Pricing Analysis
      • Market Share Analysis, 2024
        • By Solution
        • By Enterprise Size
        • By Industry
    • Chile
      • Pricing Analysis
      • Market Share Analysis, 2024
        • By Solution
        • By Enterprise Size
        • By Industry
    • Germany
      • Pricing Analysis
      • Market Share Analysis, 2024
        • By Solution
        • By Enterprise Size
        • By Industry
    • UK
      • Pricing Analysis
      • Market Share Analysis, 2024
        • By Solution
        • By Enterprise Size
        • By Industry
    • Italy
      • Pricing Analysis
      • Market Share Analysis, 2024
        • By Solution
        • By Enterprise Size
        • By Industry
    • Spain
      • Pricing Analysis
      • Market Share Analysis, 2024
        • By Solution
        • By Enterprise Size
        • By Industry
    • France
      • Pricing Analysis
      • Market Share Analysis, 2024
        • By Solution
        • By Enterprise Size
        • By Industry
    • India
      • Pricing Analysis
      • Market Share Analysis, 2024
        • By Solution
        • By Enterprise Size
        • By Industry
    • ASEAN
      • Pricing Analysis
      • Market Share Analysis, 2024
        • By Solution
        • By Enterprise Size
        • By Industry
    • Australia & New Zealand
      • Pricing Analysis
      • Market Share Analysis, 2024
        • By Solution
        • By Enterprise Size
        • By Industry
    • China
      • Pricing Analysis
      • Market Share Analysis, 2024
        • By Solution
        • By Enterprise Size
        • By Industry
    • Japan
      • Pricing Analysis
      • Market Share Analysis, 2024
        • By Solution
        • By Enterprise Size
        • By Industry
    • South Korea
      • Pricing Analysis
      • Market Share Analysis, 2024
        • By Solution
        • By Enterprise Size
        • By Industry
    • Russia
      • Pricing Analysis
      • Market Share Analysis, 2024
        • By Solution
        • By Enterprise Size
        • By Industry
    • Poland
      • Pricing Analysis
      • Market Share Analysis, 2024
        • By Solution
        • By Enterprise Size
        • By Industry
    • Hungary
      • Pricing Analysis
      • Market Share Analysis, 2024
        • By Solution
        • By Enterprise Size
        • By Industry
    • Kingdom of Saudi Arabia
      • Pricing Analysis
      • Market Share Analysis, 2024
        • By Solution
        • By Enterprise Size
        • By Industry
    • Turkiye
      • Pricing Analysis
      • Market Share Analysis, 2024
        • By Solution
        • By Enterprise Size
        • By Industry
    • South Africa
      • Pricing Analysis
      • Market Share Analysis, 2024
        • By Solution
        • By Enterprise Size
        • By Industry
  18. Market Structure Analysis
    • Competition Dashboard
    • Competition Benchmarking
    • Market Share Analysis of Top Players
      • By Regional
      • By Solution
      • By Enterprise Size
      • By Industry
  19. Competition Analysis
    • Competition Deep Dive
      • Salesforce
        • Overview
        • Product Portfolio
        • Profitability by Market Segments (Product/Age /Sales Channel/Region)
        • Sales Footprint
        • Strategy Overview
          • Marketing Strategy
          • Product Strategy
          • Channel Strategy
      • SAP
      • IBM
      • Microsoft
      • Oracle
      • Softengi
      • MicroStrategy
      • SAS
      • Qlik
      • TIBCO Software
      • Sisense
      • Pyramid Analytics
      • Yellowfin
      • ThoughtSpot
      • Domo
  20. Assumptions & Acronyms Used
  21. Research Methodology

List of Tables

  • Table 1: Global Market Value (USD Million) Forecast by Region, 2020-2035
  • Table 2: Global Market Value (USD Million) Forecast by Solution , 2020-2035
  • Table 3: Global Market Value (USD Million) Forecast by Enterprise Size, 2020-2035
  • Table 4: Global Market Value (USD Million) Forecast by Industry, 2020-2035
  • Table 5: North America Market Value (USD Million) Forecast by Country, 2020-2035
  • Table 6: North America Market Value (USD Million) Forecast by Solution , 2020-2035
  • Table 7: North America Market Value (USD Million) Forecast by Enterprise Size, 2020-2035
  • Table 8: North America Market Value (USD Million) Forecast by Industry, 2020-2035
  • Table 9: Latin America Market Value (USD Million) Forecast by Country, 2020-2035
  • Table 10: Latin America Market Value (USD Million) Forecast by Solution , 2020-2035
  • Table 11: Latin America Market Value (USD Million) Forecast by Enterprise Size, 2020-2035
  • Table 12: Latin America Market Value (USD Million) Forecast by Industry, 2020-2035
  • Table 13: Western Europe Market Value (USD Million) Forecast by Country, 2020-2035
  • Table 14: Western Europe Market Value (USD Million) Forecast by Solution , 2020-2035
  • Table 15: Western Europe Market Value (USD Million) Forecast by Enterprise Size, 2020-2035
  • Table 16: Western Europe Market Value (USD Million) Forecast by Industry, 2020-2035
  • Table 17: Eastern Europe Market Value (USD Million) Forecast by Country, 2020-2035
  • Table 18: Eastern Europe Market Value (USD Million) Forecast by Solution , 2020-2035
  • Table 19: Eastern Europe Market Value (USD Million) Forecast by Enterprise Size, 2020-2035
  • Table 20: Eastern Europe Market Value (USD Million) Forecast by Industry, 2020-2035
  • Table 21: East Asia Market Value (USD Million) Forecast by Country, 2020-2035
  • Table 22: East Asia Market Value (USD Million) Forecast by Solution , 2020-2035
  • Table 23: East Asia Market Value (USD Million) Forecast by Enterprise Size, 2020-2035
  • Table 24: East Asia Market Value (USD Million) Forecast by Industry, 2020-2035
  • Table 25: South Asia and Pacific Market Value (USD Million) Forecast by Country, 2020-2035
  • Table 26: South Asia and Pacific Market Value (USD Million) Forecast by Solution , 2020-2035
  • Table 27: South Asia and Pacific Market Value (USD Million) Forecast by Enterprise Size, 2020-2035
  • Table 28: South Asia and Pacific Market Value (USD Million) Forecast by Industry, 2020-2035
  • Table 29: Middle East & Africa Market Value (USD Million) Forecast by Country, 2020-2035
  • Table 30: Middle East & Africa Market Value (USD Million) Forecast by Solution , 2020-2035
  • Table 31: Middle East & Africa Market Value (USD Million) Forecast by Enterprise Size, 2020-2035
  • Table 32: Middle East & Africa Market Value (USD Million) Forecast by Industry, 2020-2035

List of Figures

  • Figure 1: Global Market Pricing Analysis
  • Figure 2: Global Market Value (USD Million) Forecast 2020-2035
  • Figure 3: Global Market Value Share and BPS Analysis by Solution , 2025 and 2035
  • Figure 4: Global Market Y-o-Y Growth Comparison by Solution , 2025-2035
  • Figure 5: Global Market Attractiveness Analysis by Solution
  • Figure 6: Global Market Value Share and BPS Analysis by Enterprise Size, 2025 and 2035
  • Figure 7: Global Market Y-o-Y Growth Comparison by Enterprise Size, 2025-2035
  • Figure 8: Global Market Attractiveness Analysis by Enterprise Size
  • Figure 9: Global Market Value Share and BPS Analysis by Industry, 2025 and 2035
  • Figure 10: Global Market Y-o-Y Growth Comparison by Industry, 2025-2035
  • Figure 11: Global Market Attractiveness Analysis by Industry
  • Figure 12: Global Market Value (USD Million) Share and BPS Analysis by Region, 2025 and 2035
  • Figure 13: Global Market Y-o-Y Growth Comparison by Region, 2025-2035
  • Figure 14: Global Market Attractiveness Analysis by Region
  • Figure 15: North America Market Incremental Dollar Opportunity, 2025-2035
  • Figure 16: Latin America Market Incremental Dollar Opportunity, 2025-2035
  • Figure 17: Western Europe Market Incremental Dollar Opportunity, 2025-2035
  • Figure 18: Eastern Europe Market Incremental Dollar Opportunity, 2025-2035
  • Figure 19: East Asia Market Incremental Dollar Opportunity, 2025-2035
  • Figure 20: South Asia and Pacific Market Incremental Dollar Opportunity, 2025-2035
  • Figure 21: Middle East & Africa Market Incremental Dollar Opportunity, 2025-2035
  • Figure 22: North America Market Value Share and BPS Analysis by Country, 2025 and 2035
  • Figure 23: North America Market Value Share and BPS Analysis by Solution , 2025 and 2035
  • Figure 24: North America Market Y-o-Y Growth Comparison by Solution , 2025-2035
  • Figure 25: North America Market Attractiveness Analysis by Solution
  • Figure 26: North America Market Value Share and BPS Analysis by Enterprise Size, 2025 and 2035
  • Figure 27: North America Market Y-o-Y Growth Comparison by Enterprise Size, 2025-2035
  • Figure 28: North America Market Attractiveness Analysis by Enterprise Size
  • Figure 29: North America Market Value Share and BPS Analysis by Industry, 2025 and 2035
  • Figure 30: North America Market Y-o-Y Growth Comparison by Industry, 2025-2035
  • Figure 31: North America Market Attractiveness Analysis by Industry
  • Figure 32: Latin America Market Value Share and BPS Analysis by Country, 2025 and 2035
  • Figure 33: Latin America Market Value Share and BPS Analysis by Solution , 2025 and 2035
  • Figure 34: Latin America Market Y-o-Y Growth Comparison by Solution , 2025-2035
  • Figure 35: Latin America Market Attractiveness Analysis by Solution
  • Figure 36: Latin America Market Value Share and BPS Analysis by Enterprise Size, 2025 and 2035
  • Figure 37: Latin America Market Y-o-Y Growth Comparison by Enterprise Size, 2025-2035
  • Figure 38: Latin America Market Attractiveness Analysis by Enterprise Size
  • Figure 39: Latin America Market Value Share and BPS Analysis by Industry, 2025 and 2035
  • Figure 40: Latin America Market Y-o-Y Growth Comparison by Industry, 2025-2035
  • Figure 41: Latin America Market Attractiveness Analysis by Industry
  • Figure 42: Western Europe Market Value Share and BPS Analysis by Country, 2025 and 2035
  • Figure 43: Western Europe Market Value Share and BPS Analysis by Solution , 2025 and 2035
  • Figure 44: Western Europe Market Y-o-Y Growth Comparison by Solution , 2025-2035
  • Figure 45: Western Europe Market Attractiveness Analysis by Solution
  • Figure 46: Western Europe Market Value Share and BPS Analysis by Enterprise Size, 2025 and 2035
  • Figure 47: Western Europe Market Y-o-Y Growth Comparison by Enterprise Size, 2025-2035
  • Figure 48: Western Europe Market Attractiveness Analysis by Enterprise Size
  • Figure 49: Western Europe Market Value Share and BPS Analysis by Industry, 2025 and 2035
  • Figure 50: Western Europe Market Y-o-Y Growth Comparison by Industry, 2025-2035
  • Figure 51: Western Europe Market Attractiveness Analysis by Industry
  • Figure 52: Eastern Europe Market Value Share and BPS Analysis by Country, 2025 and 2035
  • Figure 53: Eastern Europe Market Value Share and BPS Analysis by Solution , 2025 and 2035
  • Figure 54: Eastern Europe Market Y-o-Y Growth Comparison by Solution , 2025-2035
  • Figure 55: Eastern Europe Market Attractiveness Analysis by Solution
  • Figure 56: Eastern Europe Market Value Share and BPS Analysis by Enterprise Size, 2025 and 2035
  • Figure 57: Eastern Europe Market Y-o-Y Growth Comparison by Enterprise Size, 2025-2035
  • Figure 58: Eastern Europe Market Attractiveness Analysis by Enterprise Size
  • Figure 59: Eastern Europe Market Value Share and BPS Analysis by Industry, 2025 and 2035
  • Figure 60: Eastern Europe Market Y-o-Y Growth Comparison by Industry, 2025-2035
  • Figure 61: Eastern Europe Market Attractiveness Analysis by Industry
  • Figure 62: East Asia Market Value Share and BPS Analysis by Country, 2025 and 2035
  • Figure 63: East Asia Market Value Share and BPS Analysis by Solution , 2025 and 2035
  • Figure 64: East Asia Market Y-o-Y Growth Comparison by Solution , 2025-2035
  • Figure 65: East Asia Market Attractiveness Analysis by Solution
  • Figure 66: East Asia Market Value Share and BPS Analysis by Enterprise Size, 2025 and 2035
  • Figure 67: East Asia Market Y-o-Y Growth Comparison by Enterprise Size, 2025-2035
  • Figure 68: East Asia Market Attractiveness Analysis by Enterprise Size
  • Figure 69: East Asia Market Value Share and BPS Analysis by Industry, 2025 and 2035
  • Figure 70: East Asia Market Y-o-Y Growth Comparison by Industry, 2025-2035
  • Figure 71: East Asia Market Attractiveness Analysis by Industry
  • Figure 72: South Asia and Pacific Market Value Share and BPS Analysis by Country, 2025 and 2035
  • Figure 73: South Asia and Pacific Market Value Share and BPS Analysis by Solution , 2025 and 2035
  • Figure 74: South Asia and Pacific Market Y-o-Y Growth Comparison by Solution , 2025-2035
  • Figure 75: South Asia and Pacific Market Attractiveness Analysis by Solution
  • Figure 76: South Asia and Pacific Market Value Share and BPS Analysis by Enterprise Size, 2025 and 2035
  • Figure 77: South Asia and Pacific Market Y-o-Y Growth Comparison by Enterprise Size, 2025-2035
  • Figure 78: South Asia and Pacific Market Attractiveness Analysis by Enterprise Size
  • Figure 79: South Asia and Pacific Market Value Share and BPS Analysis by Industry, 2025 and 2035
  • Figure 80: South Asia and Pacific Market Y-o-Y Growth Comparison by Industry, 2025-2035
  • Figure 81: South Asia and Pacific Market Attractiveness Analysis by Industry
  • Figure 82: Middle East & Africa Market Value Share and BPS Analysis by Country, 2025 and 2035
  • Figure 83: Middle East & Africa Market Value Share and BPS Analysis by Solution , 2025 and 2035
  • Figure 84: Middle East & Africa Market Y-o-Y Growth Comparison by Solution , 2025-2035
  • Figure 85: Middle East & Africa Market Attractiveness Analysis by Solution
  • Figure 86: Middle East & Africa Market Value Share and BPS Analysis by Enterprise Size, 2025 and 2035
  • Figure 87: Middle East & Africa Market Y-o-Y Growth Comparison by Enterprise Size, 2025-2035
  • Figure 88: Middle East & Africa Market Attractiveness Analysis by Enterprise Size
  • Figure 89: Middle East & Africa Market Value Share and BPS Analysis by Industry, 2025 and 2035
  • Figure 90: Middle East & Africa Market Y-o-Y Growth Comparison by Industry, 2025-2035
  • Figure 91: Middle East & Africa Market Attractiveness Analysis by Industry
  • Figure 92: Global Market - Tier Structure Analysis
  • Figure 93: Global Market - Company Share Analysis

Frequently Asked Questions

How big is the augmented analytics market in 2025?

The global augmented analytics market is estimated to be valued at USD 12.8 billion in 2025.

What will be the size of augmented analytics market in 2035?

The market size for the augmented analytics market is projected to reach USD 84.3 billion by 2035.

How much will be the augmented analytics market growth between 2025 and 2035?

The augmented analytics market is expected to grow at a 20.7% CAGR between 2025 and 2035.

What are the key product types in the augmented analytics market?

The key product types in augmented analytics market are augmented analytics software, on-premises, cloud, services, consulting, deployment and integration and support and maintenance.

Which enterprise size segment to contribute significant share in the augmented analytics market in 2025?

In terms of enterprise size, large enterprises segment to command 61.4% share in the augmented analytics market in 2025.

Explore Similar Insights

Future Market Insights

Augmented Analytics Market

Chat With MaRIA

Chat With

MaRIA

Hi There, I am MaRIA, Your Market Research Intelligence Assistant. How may I help you?