Reports

- Global Locations -

Headquarters

Future Market Insights, Inc.

Christiana Corporate, 200
Continental Drive, Suite 401,
Newark, Delaware - 19713,
United States

T: +1-845-579-5705

Americas

Future Market Insights, Inc.

616 Corporate Way, Suite 2-9018,
Valley Cottage, NY 10989, United States

T: +1-347-918-3531

MEA

Future Market Insights

1602-6 Jumeirah Bay X2 Tower, Plot No: JLT-PH2-X2A,
Jumeirah Lakes Towers, Dubai,
United Arab Emirates

Europe

Future Market Insights

3rd Floor, 207 Regent Street,
W1B 3HH London
United Kingdom

T: + 44 (0) 20 8123 9659
D: +44 (0) 20 3287 4268

Asia Pacific

Future Market Insights

IndiaLand Global Tech Park, Unit UG-1, Behind Grand HighStreet, Phase 1, Hinjawadi, MH, Pune – 411057, India

Augmented Reality Glasses Market Outlook (2023 to 2033)

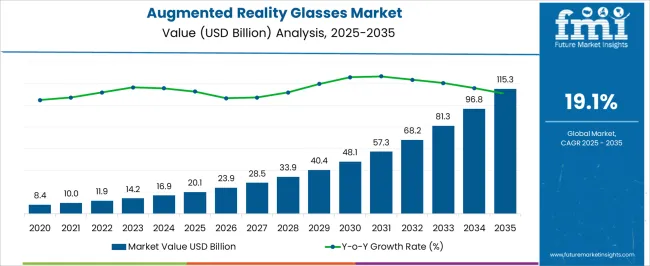
The global augmented reality glasses market is expected to be valued at US$ 13,922.2 million in 2023. With smartphone and internet penetration complying across the globe, coupled with an inimitable quality of merging the real with the unreal, and coming in very handy in day-to-day experiences, overall demand for augmented reality glasses is projected to grow at a CAGR of 20.1% between 2023 and 2033, totaling around US$ 87,165.4 million by 2033.

Augmented reality glasses display information about the user's surroundings in front of his or her eyes on his or her spectacles. Furthermore, augmented reality glasses successfully superimpose virtual things in the real world. Because of the availability of sensors and position trackers, smart augmented reality glasses also enable efficient interactions with holographic objects.

Mixed reality glasses with increased functions have been introduced as a result of advancements in augmented reality glasses. Augmented reality glasses are still in the early stages of development as new developments and implementations are made possible by technological advancements and the availability of resources. Despite this, augmented reality glasses have found use in fields such as healthcare, military, retail, and real estate.

Data Points Key Statistics
Augmented reality glasses Market Value 2023 US$ 13,922.2 million
Augmented reality glasses Market Projected Value (2033) US$ 87,165.4 million
Augmented reality glasses Market CAGR (2023 to 2033) 20.1%

Companies are exploring the possible ways AR could be used by giving end-users a unique, relevant, and immersive experience. Furthermore, the penetration of mobile phones and augmented reality glasses have leaped with mobile AR technology. This is a stellar moment for the augmented reality glasses market.

For instance, in January 2020, Hangzhou Tairuo Technology Company Limited announced an advanced product called the Nreal Light AR glasses, which uses AR technology to create a vastly improved and immersive experience combining virtual reality and augmented reality.

The popularity of smart glasses is growing because of their ability to merge the user’s vision with the virtual world effortlessly. These glasses use a combination of display, sensors, accelerometers, smart software, and internet connectivity to add contextual information to the wearer's views. AR-enabled smart glasses are increasingly being used for various day-to-day domestic and professional uses.

The augmented intelligence biometric-enabled smart glasses platform launched by Vuzix and ST Engineering boosts the productivity of enterprise customers and enhances public safety. The increasing adoption and regular launch of such innovative products are expected to fuel the growth of the augmented reality market during the forecast period.

Don't pay for what you don't need

Customize your report by selecting specific countries or regions and save 30%!

Augmented Reality Glasses Demand Analysis (2018 to 2022) Vs Market Outlook (2023 to 2033)

AR technology has been the driving force with technology making a quantum leap ever since the COVID-19 outbreak. The head-mounted display & smart glass segment accounted for the highest revenue share of 69.5% in 2022. The segment is expected to continue dominating the augmented reality market in the forecast period as a result of the increasing demand for head-mounted displays and smart glasses in industrial & enterprise applications.

Advances in OLED technology and the growing use cases for AR technology in industrial & enterprise applications are expected to drive mass availability of lightweight head-mounted displays, thereby driving the growth of the segment.

AR-powered head-mounted displays and smart glasses can potentially find innovative use cases in the supply chain & logistics industry, and subsequently, transform the entire supply chain. Although AR-powered smart glasses consume high computation resources, their ability to visualize in real-time for viewers stokes market growth.

AR technology is a boon in day-to-day applications

AR glasses help Lenskart thrive in individual sales of spectacles and sunglasses with a well-informed buying decision

The augmented reality market can be described as a relatively untapped market, where several opportunities remain unexplored. Vendors are investing aggressively in research and development to develop innovative AR solutions for day-to-day applications as well as for enterprises to simplify their workflows and enhance their processes.

The ability to offer an immersive experience is particularly prompting technology and e-commerce companies to opt for new, innovative solutions based on AR technology.

For instance, Lenskart Solutions Pvt Ltd. is using AR technology in the mobile app to allow individuals to superimpose spectacles, sunglasses, and other products virtually on their faces before making a buying decision. Similarly, the AR feature implemented by LG Corporation on its electronics website allows users to witness how a particular television set is expected to look in their house on their mobile phones before they make a buying decision.

Smart glasses go much further than simply being head-mounted HUD; their primary function is as an augmented reality display. Augmented reality is when digital information is presented in real-time. It more than just displays static information and takes a shot at displaying visually real-time shots that look as if they are being played out in front of your eyes.

Key Market Restraints

The high cost of AR glasses is a deterrent to market growth

The high cost of smart glass is one of the factors hindering the smart glass market growth. Customers in developing countries have lower disposable incomes and prefer to prioritize spending on necessities. Moreover, consumers in these countries prefer blinds and curtains instead of smart glass.

Meanwhile, customers in most countries in the Asia Pacific, Middle East, and Africa are price-sensitive and are expected to opt for glass that can serve basic requirements. Most users do not have enough knowledge about energy cost savings associated with the use of smart glass.

Although augmented reality glasses are still in the development stage, the main factor impeding the growth of the augmented reality glasses market is a lack of knowledge. Furthermore, despite price declines, the high cost of augmented reality glasses impedes its growth and adoption rate.

AR/VR smart glasses are a costly technology with mammoth maintenance costs. Smart glasses' hardware, software solutions, and maintenance are highly expensive. The software used to obtain information and records adds to the cost of AR/VR smart glasses because it is customizable according to the user's needs. This incurs additional costs, which raises the overall cost of the product and reduces its adoption rate.

Sudip Saha
Sudip Saha

Principal Consultant

Talk to Analyst

Find your sweet spots for generating winning opportunities in this market.

By Application Analysis, Which Segment is Expected to Prevail?

Enterprise segment to take the lead in market growth

The major AR market growth came from the enterprise segment. AR apps are used by enterprises to check inventory, provide information on available stock, and save time and travel costs through remote assistance.

AR technology also helps enterprises in training, data visualization, marketing, collaboration, inspection, repairs, solving complex problems, and minimizing human errors. These advantages and the high level of customization offered by augmented reality are projected to boost its adoption for various applications in enterprises.

Is North America Projected to Continue Dominance in the Global Augmented Reality Glasses Market?

North America wins hands down posting the largest market share in the forecast period

Country Market CAGR % (2023 to 2033)
North America Market Share % (2022) 31.6%
The United States Market Share % (2022) 21.2%

North America accounted for the largest revenue share of 31.6% in 2022 and is anticipated to account for a significant market share in the forecast period. The United States accounted for the largest North American regional market share. In 2022, the United States recorded a 21.2% stake in the global market. The United States is home to several leading technology companies, such as Google LLC, and Microsoft, among others.

The country is also considered an early adopter of new technologies. Europe is poised for significant growth as it has taken the lead in adopting AR technology for gaming & entertainment applications. Germany is particularly gaining recognition for implementing AR technology in the gaming industry.
Get the data you need at a Fraction of the cost

Personalize your report by choosing insights you need
and save 40%!

How Is Europe Driving Demand for Augmented Reality Glasses?

Country Market CAGR % (2023 to 2033)
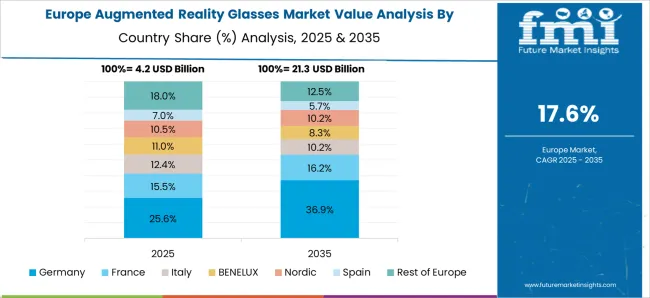
Europe Market Share % (2022) 22.8%
Germany Market Share % (2022) 8.9%
The United Kingdom’s Market CAGR % (2023 to 2033) 19.3%

With increased internet penetration, more awareness, and higher usage of smartphones and tablets, Europe is predicted to develop at the greatest rate. In 2022, Europe held 22.8% of the worldwide market share.

In the anticipated period, the development of new technologies such as IoT and 5G is expected to increase demand for AR smart glasses in this region. Warehouse pickup solutions that use augmented reality to provide the correct position of things in a warehouse are being adopted by various companies in Europe. As a result, it minimizes the time required to complete the order, increasing warehouse worker productivity.

At the same time, enterprises in Europe deploy augmented reality applications to enable buyers to visualize the product in the actual world. This could include products from automotive, home, and beauty brands and thus are responsible for driving the demand in this market rapidly.

Is the Asia Pacific Rise Expected Bode well with the Increasing Customer Footfalls?

5G rollout in Asia Pacific to update AR Glasses Market

Country Market CAGR % (2023 to 2033)
China 23.5%
India 21.7%

Asia Pacific is predicted to emerge as the fastest-growing regional market in the forecast period. Developed countries, such as Japan and Australia, are gradually paving their path as the leaders in the regional market leveraging a large customer base and advancing the implementation of internet-based platforms.

The continued rollout of high-speed, 5G networks in the Asia Pacific is also expected to trigger widespread adoption of AR technology and AR-based solutions across the region. India with its large population and rapidly growing internet penetration rate is emerging among the leading economies in the Asia Pacific utilizing AR technology in the manufacturing and healthcare industries, where more immersive and hands-on experience is of paramount importance.
Startup Ecosystem

  • Apple's AR glasses to launch in late 2024 alongside second 2nd Gen AR/VR headset. Apple is said to be developing augmented reality spectacles, which is expected to be available in the second half of 2024. AR glasses are claimed to be heavily reliant on the iPhone due to design constraints.
  • Meta is likely to launch its first augmented reality glasses in 2024. It is going to emerge as a flagship product for the company as expressed by CEO Mark Zuckerberg

Competitive Landscape

Who are the Leading Players in the Augmented reality glasses Market?

Market players are striking strategic alliances and partnerships and engaging in mergers and acquisitions as part of their efforts to advance technology development amid the intensifying competition.

  • For instance, in December 2021, Tencent acquired Turtle Rock Studios. Tencent particularly found the latter's gaming library and AR capabilities lucrative.
  • Similarly, in August 2020, Google Ventures invested US$ 14.5 million in Blue Vision Labs, an AR start-up based in the United Kingdom, after realizing the latter’s potential and development power.
  • In September 2021, WPP and Snap Inc. announced a partnership to explore AR technology to develop advanced immersive experiences for users. The partnership holds immense potential, particularly given that the Snap Consumer AR Global Report 2021 has revealed that over 90% of people want to use AR for shopping.
  • In June 2021, Livestream Technologies expanded its investment in Japan bolstered by the increasing customer footfalls in the Asia Pacific region. AR market crossed the upper limit of 320% market in Japan.

Report Scope

Report Attribute Details
Growth Rate 20.1% CAGR from 2023 to 2033
Market Value in 2023 US$ 13,922.2 million
Market Value in 2033 US$ 87,165.4 million
Base Year for Estimation 2022
Historical Data 2018 to 2022
Forecast Period 2023 to 2033
Quantitative Units US$ million for Value
Report Coverage Revenue Forecast, Volume Forecast, Company Ranking, Competitive Landscape, Growth Factors, Trends, and Pricing Analysis
Segments Covered
  • Application
  • Region
Regions Covered
  • North America
  • Latin America
  • Europe
  • Asia Pacific
  • Middle East & Africa
Key Countries Profiled
  • The United States
  • Canada
  • Brazil
  • Mexico
  • Germany
  • The United Kingdom
  • France
  • Spain
  • Italy
  • China
  • Japan
  • South Korea
  • GCC Countries
  • South Africa
  • Israel
Key Companies Profiled
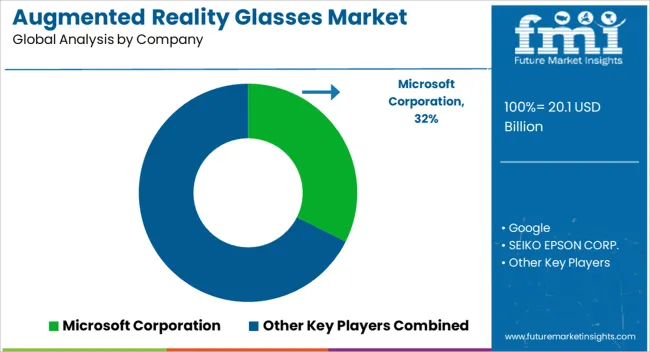
  • Microsoft Corporation
  • Google
  • SEIKO EPSON CORP.
  • Laster Technologies
  • Penny
  • Sony Mobile Communications Inc.
  • Recon Instruments
  • LUMUS
Customization Scope Available upon Request

Key Segments Profiled in the Global Augmented Reality Glasses Market

By application:

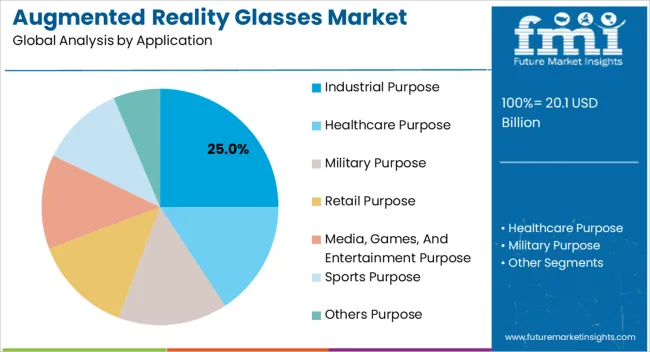
  • Industrial purpose
  • Healthcare purpose
  • Military purpose
  • Retail purpose
  • Media, Games, and Entertainment purpose
  • Sports purpose
  • Others purpose

By Region:

  • North America
  • Latin America
  • Europe
  • Asia Pacific
  • Middle East & Africa

Frequently Asked Questions

What is the Growth Forecast for Global Augmented Reality Glasses Market?

The global sales of augmented reality glasses is on the track to grow at 20.1% annual rate until 2033.

Which is the Leading Regional Market for Augmented Reality Glasses?

The market in the United States contributed nearly 21.2% of the 2022 revenue share.

Which Product Type Generates Substantial Revenue in the Market?

The heat-mounted display & smart glass segment constituted 69.5% of the total market sales in 2022.

Which is the Leading Country for Sales of Augmented Reality Glasses Products in Europe?

The demand for augmented reality glasses in Germany contributed 8.9% in 2022.

What is the Adoption Rate of Augmented Reality Glasses in China Market?

Adoption of augmented reality glasses in China is expected to surge at 23.5% CAGR through 2033.

Table of Content

1. Executive Summary

    1.1. Global Market Outlook

    1.2. Demand-side Trends

    1.3. Supply-side Trends

    1.4. Technology Roadmap Analysis

    1.5. Analysis and Recommendations

2. Market Overview

    2.1. Market Coverage / Taxonomy

    2.2. Market Definition / Scope / Limitations

3. Market Background

    3.1. Market Dynamics

        3.1.1. Drivers

        3.1.2. Restraints

        3.1.3. Opportunity

        3.1.4. Trends

    3.2. Scenario Forecast

        3.2.1. Demand in Optimistic Scenario

        3.2.2. Demand in Likely Scenario

        3.2.3. Demand in Conservative Scenario

    3.3. Opportunity Map Analysis

    3.4. Product Life Cycle Analysis

    3.5. Supply Chain Analysis

        3.5.1. Supply Side Participants and their Roles

            3.5.1.1. Producers

            3.5.1.2. Mid-Level Participants (Traders/ Agents/ Brokers)

            3.5.1.3. Wholesalers and Distributors

        3.5.2. Value Added and Value Created at Node in the Supply Chain

        3.5.3. List of Raw Material Suppliers

        3.5.4. List of Existing and Potential Buyer’s

    3.6. Investment Feasibility Matrix

    3.7. Value Chain Analysis

        3.7.1. Profit Margin Analysis

        3.7.2. Wholesalers and Distributors

        3.7.3. Retailers

    3.8. PESTLE and Porter’s Analysis

    3.9. Regulatory Landscape

        3.9.1. By Key Regions

        3.9.2. By Key Countries

    3.10. Regional Parent Market Outlook

    3.11. Production and Consumption Statistics

    3.12. Import and Export Statistics

4. Global Analysis 2018 to 2022 and Forecast, 2023 to 2033

    4.1. Historical Market Size Value (US$ Million) & Volume (Units) Analysis, 2018 to 2022

    4.2. Current and Future Market Size Value (US$ Million) & Volume (Units) Projections, 2023 to 2033

        4.2.1. Y-o-Y Growth Trend Analysis

        4.2.2. Absolute $ Opportunity Analysis

5. Global Analysis 2018 to 2022 and Forecast 2023 to 2033, By End-User

    5.1. Introduction / Key Findings

    5.2. Historical Market Size Value (US$ Million) & Volume (Units) Analysis By End-User, 2018 to 2022

    5.3. Current and Future Market Size Value (US$ Million) & Volume (Units) Analysis and Forecast By End-User, 2023 to 2033

        5.3.1. Industrial

        5.3.2. Healthcare

        5.3.3. Military

        5.3.4. Retail

        5.3.5. Media, Games, and Entertainment

        5.3.6. Sports

        5.3.7. Others

    5.4. Y-o-Y Growth Trend Analysis By End-User, 2018 to 2022

    5.5. Absolute $ Opportunity Analysis By End-User, 2023 to 2033

6. Global Analysis 2018 to 2022 and Forecast 2023 to 2033, By Applications

    6.1. Introduction / Key Findings

    6.2. Historical Market Size Value (US$ Million) & Volume (Units) Analysis By Applications, 2018 to 2022

    6.3. Current and Future Market Size Value (US$ Million) & Volume (Units) Analysis and Forecast By Applications, 2023 to 2033

        6.3.1. 3D Modelling/Design

        6.3.2. Training

        6.3.3. Monitoring/Maintenance

        6.3.4. Others

    6.4. Y-o-Y Growth Trend Analysis By Applications, 2018 to 2022

    6.5. Absolute $ Opportunity Analysis By Applications, 2023 to 2033

7. Global Analysis 2018 to 2022 and Forecast 2023 to 2033, By Region

    7.1. Introduction

    7.2. Historical Market Size Value (US$ Million) & Volume (Units) Analysis By Region, 2018 to 2022

    7.3. Current Market Size Value (US$ Million) & Volume (Units) Analysis and Forecast By Region, 2023 to 2033

        7.3.1. North America

        7.3.2. Latin America

        7.3.3. Western Europe

        7.3.4. Eastern Europe

        7.3.5. South Asia and Pacific

        7.3.6. East Asia

        7.3.7. Middle East and Africa

    7.4. Market Attractiveness Analysis By Region

8. North America Analysis 2018 to 2022 and Forecast 2023 to 2033, By Country

    8.1. Historical Market Size Value (US$ Million) & Volume (Units) Trend Analysis By Market Taxonomy, 2018 to 2022

    8.2. Market Size Value (US$ Million) & Volume (Units) Forecast By Market Taxonomy, 2023 to 2033

        8.2.1. By Country

            8.2.1.1. U.S.

            8.2.1.2. Canada

        8.2.2. By End-User

        8.2.3. By Applications

    8.3. Market Attractiveness Analysis

        8.3.1. By Country

        8.3.2. By End-User

        8.3.3. By Applications

    8.4. Key Takeaways

9. Latin America Analysis 2018 to 2022 and Forecast 2023 to 2033, By Country

    9.1. Historical Market Size Value (US$ Million) & Volume (Units) Trend Analysis By Market Taxonomy, 2018 to 2022

    9.2. Market Size Value (US$ Million) & Volume (Units) Forecast By Market Taxonomy, 2023 to 2033

        9.2.1. By Country

            9.2.1.1. Brazil

            9.2.1.2. Mexico

            9.2.1.3. Rest of Latin America

        9.2.2. By End-User

        9.2.3. By Applications

    9.3. Market Attractiveness Analysis

        9.3.1. By Country

        9.3.2. By End-User

        9.3.3. By Applications

    9.4. Key Takeaways

10. Western Europe Analysis 2018 to 2022 and Forecast 2023 to 2033, By Country

    10.1. Historical Market Size Value (US$ Million) & Volume (Units) Trend Analysis By Market Taxonomy, 2018 to 2022

    10.2. Market Size Value (US$ Million) & Volume (Units) Forecast By Market Taxonomy, 2023 to 2033

        10.2.1. By Country

            10.2.1.1. Germany

            10.2.1.2. U.K.

            10.2.1.3. France

            10.2.1.4. Spain

            10.2.1.5. Italy

            10.2.1.6. Rest of Western Europe

        10.2.2. By End-User

        10.2.3. By Applications

    10.3. Market Attractiveness Analysis

        10.3.1. By Country

        10.3.2. By End-User

        10.3.3. By Applications

    10.4. Key Takeaways

11. Eastern Europe Analysis 2018 to 2022 and Forecast 2023 to 2033, By Country

    11.1. Historical Market Size Value (US$ Million) & Volume (Units) Trend Analysis By Market Taxonomy, 2018 to 2022

    11.2. Market Size Value (US$ Million) & Volume (Units) Forecast By Market Taxonomy, 2023 to 2033

        11.2.1. By Country

            11.2.1.1. Poland

            11.2.1.2. Russia

            11.2.1.3. Czech Republic

            11.2.1.4. Romania

            11.2.1.5. Rest of Eastern Europe

        11.2.2. By End-User

        11.2.3. By Applications

    11.3. Market Attractiveness Analysis

        11.3.1. By Country

        11.3.2. By End-User

        11.3.3. By Applications

    11.4. Key Takeaways

12. South Asia and Pacific Analysis 2018 to 2022 and Forecast 2023 to 2033, By Country

    12.1. Historical Market Size Value (US$ Million) & Volume (Units) Trend Analysis By Market Taxonomy, 2018 to 2022

    12.2. Market Size Value (US$ Million) & Volume (Units) Forecast By Market Taxonomy, 2023 to 2033

        12.2.1. By Country

            12.2.1.1. India

            12.2.1.2. Bangladesh

            12.2.1.3. Australia

            12.2.1.4. New Zealand

            12.2.1.5. Rest of South Asia and Pacific

        12.2.2. By End-User

        12.2.3. By Applications

    12.3. Market Attractiveness Analysis

        12.3.1. By Country

        12.3.2. By End-User

        12.3.3. By Applications

    12.4. Key Takeaways

13. East Asia Analysis 2018 to 2022 and Forecast 2023 to 2033, By Country

    13.1. Historical Market Size Value (US$ Million) & Volume (Units) Trend Analysis By Market Taxonomy, 2018 to 2022

    13.2. Market Size Value (US$ Million) & Volume (Units) Forecast By Market Taxonomy, 2023 to 2033

        13.2.1. By Country

            13.2.1.1. China

            13.2.1.2. Japan

            13.2.1.3. South Korea

        13.2.2. By End-User

        13.2.3. By Applications

    13.3. Market Attractiveness Analysis

        13.3.1. By Country

        13.3.2. By End-User

        13.3.3. By Applications

    13.4. Key Takeaways

14. Middle East and Africa Analysis 2018 to 2022 and Forecast 2023 to 2033, By Country

    14.1. Historical Market Size Value (US$ Million) & Volume (Units) Trend Analysis By Market Taxonomy, 2018 to 2022

    14.2. Market Size Value (US$ Million) & Volume (Units) Forecast By Market Taxonomy, 2023 to 2033

        14.2.1. By Country

            14.2.1.1. GCC Countries

            14.2.1.2. South Africa

            14.2.1.3. Israel

            14.2.1.4. Rest of MEA

        14.2.2. By End-User

        14.2.3. By Applications

    14.3. Market Attractiveness Analysis

        14.3.1. By Country

        14.3.2. By End-User

        14.3.3. By Applications

    14.4. Key Takeaways

15. Key Countries Analysis

    15.1. U.S.

        15.1.1. Pricing Analysis

        15.1.2. Market Share Analysis, 2022

            15.1.2.1. By End-User

            15.1.2.2. By Applications

    15.2. Canada

        15.2.1. Pricing Analysis

        15.2.2. Market Share Analysis, 2022

            15.2.2.1. By End-User

            15.2.2.2. By Applications

    15.3. Brazil

        15.3.1. Pricing Analysis

        15.3.2. Market Share Analysis, 2022

            15.3.2.1. By End-User

            15.3.2.2. By Applications

    15.4. Mexico

        15.4.1. Pricing Analysis

        15.4.2. Market Share Analysis, 2022

            15.4.2.1. By End-User

            15.4.2.2. By Applications

    15.5. Germany

        15.5.1. Pricing Analysis

        15.5.2. Market Share Analysis, 2022

            15.5.2.1. By End-User

            15.5.2.2. By Applications

    15.6. U.K.

        15.6.1. Pricing Analysis

        15.6.2. Market Share Analysis, 2022

            15.6.2.1. By End-User

            15.6.2.2. By Applications

    15.7. France

        15.7.1. Pricing Analysis

        15.7.2. Market Share Analysis, 2022

            15.7.2.1. By End-User

            15.7.2.2. By Applications

    15.8. Spain

        15.8.1. Pricing Analysis

        15.8.2. Market Share Analysis, 2022

            15.8.2.1. By End-User

            15.8.2.2. By Applications

    15.9. Italy

        15.9.1. Pricing Analysis

        15.9.2. Market Share Analysis, 2022

            15.9.2.1. By End-User

            15.9.2.2. By Applications

    15.10. Poland

        15.10.1. Pricing Analysis

        15.10.2. Market Share Analysis, 2022

            15.10.2.1. By End-User

            15.10.2.2. By Applications

    15.11. Russia

        15.11.1. Pricing Analysis

        15.11.2. Market Share Analysis, 2022

            15.11.2.1. By End-User

            15.11.2.2. By Applications

    15.12. Czech Republic

        15.12.1. Pricing Analysis

        15.12.2. Market Share Analysis, 2022

            15.12.2.1. By End-User

            15.12.2.2. By Applications

    15.13. Romania

        15.13.1. Pricing Analysis

        15.13.2. Market Share Analysis, 2022

            15.13.2.1. By End-User

            15.13.2.2. By Applications

    15.14. India

        15.14.1. Pricing Analysis

        15.14.2. Market Share Analysis, 2022

            15.14.2.1. By End-User

            15.14.2.2. By Applications

    15.15. Bangladesh

        15.15.1. Pricing Analysis

        15.15.2. Market Share Analysis, 2022

            15.15.2.1. By End-User

            15.15.2.2. By Applications

    15.16. Australia

        15.16.1. Pricing Analysis

        15.16.2. Market Share Analysis, 2022

            15.16.2.1. By End-User

            15.16.2.2. By Applications

    15.17. New Zealand

        15.17.1. Pricing Analysis

        15.17.2. Market Share Analysis, 2022

            15.17.2.1. By End-User

            15.17.2.2. By Applications

    15.18. China

        15.18.1. Pricing Analysis

        15.18.2. Market Share Analysis, 2022

            15.18.2.1. By End-User

            15.18.2.2. By Applications

    15.19. Japan

        15.19.1. Pricing Analysis

        15.19.2. Market Share Analysis, 2022

            15.19.2.1. By End-User

            15.19.2.2. By Applications

    15.20. South Korea

        15.20.1. Pricing Analysis

        15.20.2. Market Share Analysis, 2022

            15.20.2.1. By End-User

            15.20.2.2. By Applications

    15.21. GCC Countries

        15.21.1. Pricing Analysis

        15.21.2. Market Share Analysis, 2022

            15.21.2.1. By End-User

            15.21.2.2. By Applications

    15.22. South Africa

        15.22.1. Pricing Analysis

        15.22.2. Market Share Analysis, 2022

            15.22.2.1. By End-User

            15.22.2.2. By Applications

    15.23. Israel

        15.23.1. Pricing Analysis

        15.23.2. Market Share Analysis, 2022

            15.23.2.1. By End-User

            15.23.2.2. By Applications

16. Market Structure Analysis

    16.1. Competition Dashboard

    16.2. Competition Benchmarking

    16.3. Market Share Analysis of Top Players

        16.3.1. By Regional

        16.3.2. By End-User

        16.3.3. By Applications

17. Competition Analysis

    17.1. Competition Deep Dive

        17.1.1. Microsoft Corporation,

            17.1.1.1. Overview

            17.1.1.2. Product Portfolio

            17.1.1.3. Profitability by Market Segments

            17.1.1.4. Sales Footprint

            17.1.1.5. Strategy Overview

                17.1.1.5.1. Marketing Strategy

                17.1.1.5.2. Product Strategy

                17.1.1.5.3. Channel Strategy

        17.1.2. Google,

            17.1.2.1. Overview

            17.1.2.2. Product Portfolio

            17.1.2.3. Profitability by Market Segments

            17.1.2.4. Sales Footprint

            17.1.2.5. Strategy Overview

                17.1.2.5.1. Marketing Strategy

                17.1.2.5.2. Product Strategy

                17.1.2.5.3. Channel Strategy

        17.1.3. SEIKO EPSON CORP.,

            17.1.3.1. Overview

            17.1.3.2. Product Portfolio

            17.1.3.3. Profitability by Market Segments

            17.1.3.4. Sales Footprint

            17.1.3.5. Strategy Overview

                17.1.3.5.1. Marketing Strategy

                17.1.3.5.2. Product Strategy

                17.1.3.5.3. Channel Strategy

        17.1.4. Laster Technologies,

            17.1.4.1. Overview

            17.1.4.2. Product Portfolio

            17.1.4.3. Profitability by Market Segments

            17.1.4.4. Sales Footprint

            17.1.4.5. Strategy Overview

                17.1.4.5.1. Marketing Strategy

                17.1.4.5.2. Product Strategy

                17.1.4.5.3. Channel Strategy

        17.1.5. Penny,

            17.1.5.1. Overview

            17.1.5.2. Product Portfolio

            17.1.5.3. Profitability by Market Segments

            17.1.5.4. Sales Footprint

            17.1.5.5. Strategy Overview

                17.1.5.5.1. Marketing Strategy

                17.1.5.5.2. Product Strategy

                17.1.5.5.3. Channel Strategy

        17.1.6. Sony Mobile Communications Inc.,

            17.1.6.1. Overview

            17.1.6.2. Product Portfolio

            17.1.6.3. Profitability by Market Segments

            17.1.6.4. Sales Footprint

            17.1.6.5. Strategy Overview

                17.1.6.5.1. Marketing Strategy

                17.1.6.5.2. Product Strategy

                17.1.6.5.3. Channel Strategy

        17.1.7. Recon Instruments,

            17.1.7.1. Overview

            17.1.7.2. Product Portfolio

            17.1.7.3. Profitability by Market Segments

            17.1.7.4. Sales Footprint

            17.1.7.5. Strategy Overview

                17.1.7.5.1. Marketing Strategy

                17.1.7.5.2. Product Strategy

                17.1.7.5.3. Channel Strategy

        17.1.8. LUMUS.

            17.1.8.1. Overview

            17.1.8.2. Product Portfolio

            17.1.8.3. Profitability by Market Segments

            17.1.8.4. Sales Footprint

            17.1.8.5. Strategy Overview

                17.1.8.5.1. Marketing Strategy

                17.1.8.5.2. Product Strategy

                17.1.8.5.3. Channel Strategy

        17.1.9. Samsung Group

            17.1.9.1. Overview

            17.1.9.2. Product Portfolio

            17.1.9.3. Profitability by Market Segments

            17.1.9.4. Sales Footprint

            17.1.9.5. Strategy Overview

                17.1.9.5.1. Marketing Strategy

                17.1.9.5.2. Product Strategy

                17.1.9.5.3. Channel Strategy

        17.1.10. Ricoh Company, Ltd.

            17.1.10.1. Overview

            17.1.10.2. Product Portfolio

            17.1.10.3. Profitability by Market Segments

            17.1.10.4. Sales Footprint

            17.1.10.5. Strategy Overview

                17.1.10.5.1. Marketing Strategy

                17.1.10.5.2. Product Strategy

                17.1.10.5.3. Channel Strategy

18. Assumptions & Acronyms Used

19. Research Methodology

Don't pay for what you don't need

Customize your report by selecting specific countries or regions and save 30%!

List of Tables

Table 1: Global Value (US$ Million) Forecast by Region, 2018 to 2033

Table 2: Global Volume (Units) Forecast by Region, 2018 to 2033

Table 3: Global Value (US$ Million) Forecast by End-User, 2018 to 2033

Table 4: Global Volume (Units) Forecast by End-User, 2018 to 2033

Table 5: Global Value (US$ Million) Forecast by Applications, 2018 to 2033

Table 6: Global Volume (Units) Forecast by Applications, 2018 to 2033

Table 7: North America Value (US$ Million) Forecast by Country, 2018 to 2033

Table 8: North America Volume (Units) Forecast by Country, 2018 to 2033

Table 9: North America Value (US$ Million) Forecast by End-User, 2018 to 2033

Table 10: North America Volume (Units) Forecast by End-User, 2018 to 2033

Table 11: North America Value (US$ Million) Forecast by Applications, 2018 to 2033

Table 12: North America Volume (Units) Forecast by Applications, 2018 to 2033

Table 13: Latin America Value (US$ Million) Forecast by Country, 2018 to 2033

Table 14: Latin America Volume (Units) Forecast by Country, 2018 to 2033

Table 15: Latin America Value (US$ Million) Forecast by End-User, 2018 to 2033

Table 16: Latin America Volume (Units) Forecast by End-User, 2018 to 2033

Table 17: Latin America Value (US$ Million) Forecast by Applications, 2018 to 2033

Table 18: Latin America Volume (Units) Forecast by Applications, 2018 to 2033

Table 19: Western Europe Value (US$ Million) Forecast by Country, 2018 to 2033

Table 20: Western Europe Volume (Units) Forecast by Country, 2018 to 2033

Table 21: Western Europe Value (US$ Million) Forecast by End-User, 2018 to 2033

Table 22: Western Europe Volume (Units) Forecast by End-User, 2018 to 2033

Table 23: Western Europe Value (US$ Million) Forecast by Applications, 2018 to 2033

Table 24: Western Europe Volume (Units) Forecast by Applications, 2018 to 2033

Table 25: Eastern Europe Value (US$ Million) Forecast by Country, 2018 to 2033

Table 26: Eastern Europe Volume (Units) Forecast by Country, 2018 to 2033

Table 27: Eastern Europe Value (US$ Million) Forecast by End-User, 2018 to 2033

Table 28: Eastern Europe Volume (Units) Forecast by End-User, 2018 to 2033

Table 29: Eastern Europe Value (US$ Million) Forecast by Applications, 2018 to 2033

Table 30: Eastern Europe Volume (Units) Forecast by Applications, 2018 to 2033

Table 31: South Asia and Pacific Value (US$ Million) Forecast by Country, 2018 to 2033

Table 32: South Asia and Pacific Volume (Units) Forecast by Country, 2018 to 2033

Table 33: South Asia and Pacific Value (US$ Million) Forecast by End-User, 2018 to 2033

Table 34: South Asia and Pacific Volume (Units) Forecast by End-User, 2018 to 2033

Table 35: South Asia and Pacific Value (US$ Million) Forecast by Applications, 2018 to 2033

Table 36: South Asia and Pacific Volume (Units) Forecast by Applications, 2018 to 2033

Table 37: East Asia Value (US$ Million) Forecast by Country, 2018 to 2033

Table 38: East Asia Volume (Units) Forecast by Country, 2018 to 2033

Table 39: East Asia Value (US$ Million) Forecast by End-User, 2018 to 2033

Table 40: East Asia Volume (Units) Forecast by End-User, 2018 to 2033

Table 41: East Asia Value (US$ Million) Forecast by Applications, 2018 to 2033

Table 42: East Asia Volume (Units) Forecast by Applications, 2018 to 2033

Table 43: Middle East and Africa Value (US$ Million) Forecast by Country, 2018 to 2033

Table 44: Middle East and Africa Volume (Units) Forecast by Country, 2018 to 2033

Table 45: Middle East and Africa Value (US$ Million) Forecast by End-User, 2018 to 2033

Table 46: Middle East and Africa Volume (Units) Forecast by End-User, 2018 to 2033

Table 47: Middle East and Africa Value (US$ Million) Forecast by Applications, 2018 to 2033

Table 48: Middle East and Africa Volume (Units) Forecast by Applications, 2018 to 2033
Sudip Saha
Sudip Saha

Principal Consultant

Talk to Analyst

Find your sweet spots for generating winning opportunities in this market.

List of Charts

Figure 1: Global Value (US$ Million) by End-User, 2023 to 2033

Figure 2: Global Value (US$ Million) by Applications, 2023 to 2033

Figure 3: Global Value (US$ Million) by Region, 2023 to 2033

Figure 4: Global Value (US$ Million) Analysis by Region, 2018 to 2033

Figure 5: Global Volume (Units) Analysis by Region, 2018 to 2033

Figure 6: Global Value Share (%) and BPS Analysis by Region, 2023 to 2033

Figure 7: Global Y-o-Y Growth (%) Projections by Region, 2023 to 2033

Figure 8: Global Value (US$ Million) Analysis by End-User, 2018 to 2033

Figure 9: Global Volume (Units) Analysis by End-User, 2018 to 2033

Figure 10: Global Value Share (%) and BPS Analysis by End-User, 2023 to 2033

Figure 11: Global Y-o-Y Growth (%) Projections by End-User, 2023 to 2033

Figure 12: Global Value (US$ Million) Analysis by Applications, 2018 to 2033

Figure 13: Global Volume (Units) Analysis by Applications, 2018 to 2033

Figure 14: Global Value Share (%) and BPS Analysis by Applications, 2023 to 2033

Figure 15: Global Y-o-Y Growth (%) Projections by Applications, 2023 to 2033

Figure 16: Global Attractiveness by End-User, 2023 to 2033

Figure 17: Global Attractiveness by Applications, 2023 to 2033

Figure 18: Global Attractiveness by Region, 2023 to 2033

Figure 19: North America Value (US$ Million) by End-User, 2023 to 2033

Figure 20: North America Value (US$ Million) by Applications, 2023 to 2033

Figure 21: North America Value (US$ Million) by Country, 2023 to 2033

Figure 22: North America Value (US$ Million) Analysis by Country, 2018 to 2033

Figure 23: North America Volume (Units) Analysis by Country, 2018 to 2033

Figure 24: North America Value Share (%) and BPS Analysis by Country, 2023 to 2033

Figure 25: North America Y-o-Y Growth (%) Projections by Country, 2023 to 2033

Figure 26: North America Value (US$ Million) Analysis by End-User, 2018 to 2033

Figure 27: North America Volume (Units) Analysis by End-User, 2018 to 2033

Figure 28: North America Value Share (%) and BPS Analysis by End-User, 2023 to 2033

Figure 29: North America Y-o-Y Growth (%) Projections by End-User, 2023 to 2033

Figure 30: North America Value (US$ Million) Analysis by Applications, 2018 to 2033

Figure 31: North America Volume (Units) Analysis by Applications, 2018 to 2033

Figure 32: North America Value Share (%) and BPS Analysis by Applications, 2023 to 2033

Figure 33: North America Y-o-Y Growth (%) Projections by Applications, 2023 to 2033

Figure 34: North America Attractiveness by End-User, 2023 to 2033

Figure 35: North America Attractiveness by Applications, 2023 to 2033

Figure 36: North America Attractiveness by Country, 2023 to 2033

Figure 37: Latin America Value (US$ Million) by End-User, 2023 to 2033

Figure 38: Latin America Value (US$ Million) by Applications, 2023 to 2033

Figure 39: Latin America Value (US$ Million) by Country, 2023 to 2033

Figure 40: Latin America Value (US$ Million) Analysis by Country, 2018 to 2033

Figure 41: Latin America Volume (Units) Analysis by Country, 2018 to 2033

Figure 42: Latin America Value Share (%) and BPS Analysis by Country, 2023 to 2033

Figure 43: Latin America Y-o-Y Growth (%) Projections by Country, 2023 to 2033

Figure 44: Latin America Value (US$ Million) Analysis by End-User, 2018 to 2033

Figure 45: Latin America Volume (Units) Analysis by End-User, 2018 to 2033

Figure 46: Latin America Value Share (%) and BPS Analysis by End-User, 2023 to 2033

Figure 47: Latin America Y-o-Y Growth (%) Projections by End-User, 2023 to 2033

Figure 48: Latin America Value (US$ Million) Analysis by Applications, 2018 to 2033

Figure 49: Latin America Volume (Units) Analysis by Applications, 2018 to 2033

Figure 50: Latin America Value Share (%) and BPS Analysis by Applications, 2023 to 2033

Figure 51: Latin America Y-o-Y Growth (%) Projections by Applications, 2023 to 2033

Figure 52: Latin America Attractiveness by End-User, 2023 to 2033

Figure 53: Latin America Attractiveness by Applications, 2023 to 2033

Figure 54: Latin America Attractiveness by Country, 2023 to 2033

Figure 55: Western Europe Value (US$ Million) by End-User, 2023 to 2033

Figure 56: Western Europe Value (US$ Million) by Applications, 2023 to 2033

Figure 57: Western Europe Value (US$ Million) by Country, 2023 to 2033

Figure 58: Western Europe Value (US$ Million) Analysis by Country, 2018 to 2033

Figure 59: Western Europe Volume (Units) Analysis by Country, 2018 to 2033

Figure 60: Western Europe Value Share (%) and BPS Analysis by Country, 2023 to 2033

Figure 61: Western Europe Y-o-Y Growth (%) Projections by Country, 2023 to 2033

Figure 62: Western Europe Value (US$ Million) Analysis by End-User, 2018 to 2033

Figure 63: Western Europe Volume (Units) Analysis by End-User, 2018 to 2033

Figure 64: Western Europe Value Share (%) and BPS Analysis by End-User, 2023 to 2033

Figure 65: Western Europe Y-o-Y Growth (%) Projections by End-User, 2023 to 2033

Figure 66: Western Europe Value (US$ Million) Analysis by Applications, 2018 to 2033

Figure 67: Western Europe Volume (Units) Analysis by Applications, 2018 to 2033

Figure 68: Western Europe Value Share (%) and BPS Analysis by Applications, 2023 to 2033

Figure 69: Western Europe Y-o-Y Growth (%) Projections by Applications, 2023 to 2033

Figure 70: Western Europe Attractiveness by End-User, 2023 to 2033

Figure 71: Western Europe Attractiveness by Applications, 2023 to 2033

Figure 72: Western Europe Attractiveness by Country, 2023 to 2033

Figure 73: Eastern Europe Value (US$ Million) by End-User, 2023 to 2033

Figure 74: Eastern Europe Value (US$ Million) by Applications, 2023 to 2033

Figure 75: Eastern Europe Value (US$ Million) by Country, 2023 to 2033

Figure 76: Eastern Europe Value (US$ Million) Analysis by Country, 2018 to 2033

Figure 77: Eastern Europe Volume (Units) Analysis by Country, 2018 to 2033

Figure 78: Eastern Europe Value Share (%) and BPS Analysis by Country, 2023 to 2033

Figure 79: Eastern Europe Y-o-Y Growth (%) Projections by Country, 2023 to 2033

Figure 80: Eastern Europe Value (US$ Million) Analysis by End-User, 2018 to 2033

Figure 81: Eastern Europe Volume (Units) Analysis by End-User, 2018 to 2033

Figure 82: Eastern Europe Value Share (%) and BPS Analysis by End-User, 2023 to 2033

Figure 83: Eastern Europe Y-o-Y Growth (%) Projections by End-User, 2023 to 2033

Figure 84: Eastern Europe Value (US$ Million) Analysis by Applications, 2018 to 2033

Figure 85: Eastern Europe Volume (Units) Analysis by Applications, 2018 to 2033

Figure 86: Eastern Europe Value Share (%) and BPS Analysis by Applications, 2023 to 2033

Figure 87: Eastern Europe Y-o-Y Growth (%) Projections by Applications, 2023 to 2033

Figure 88: Eastern Europe Attractiveness by End-User, 2023 to 2033

Figure 89: Eastern Europe Attractiveness by Applications, 2023 to 2033

Figure 90: Eastern Europe Attractiveness by Country, 2023 to 2033

Figure 91: South Asia and Pacific Value (US$ Million) by End-User, 2023 to 2033

Figure 92: South Asia and Pacific Value (US$ Million) by Applications, 2023 to 2033

Figure 93: South Asia and Pacific Value (US$ Million) by Country, 2023 to 2033

Figure 94: South Asia and Pacific Value (US$ Million) Analysis by Country, 2018 to 2033

Figure 95: South Asia and Pacific Volume (Units) Analysis by Country, 2018 to 2033

Figure 96: South Asia and Pacific Value Share (%) and BPS Analysis by Country, 2023 to 2033

Figure 97: South Asia and Pacific Y-o-Y Growth (%) Projections by Country, 2023 to 2033

Figure 98: South Asia and Pacific Value (US$ Million) Analysis by End-User, 2018 to 2033

Figure 99: South Asia and Pacific Volume (Units) Analysis by End-User, 2018 to 2033

Figure 100: South Asia and Pacific Value Share (%) and BPS Analysis by End-User, 2023 to 2033

Figure 101: South Asia and Pacific Y-o-Y Growth (%) Projections by End-User, 2023 to 2033

Figure 102: South Asia and Pacific Value (US$ Million) Analysis by Applications, 2018 to 2033

Figure 103: South Asia and Pacific Volume (Units) Analysis by Applications, 2018 to 2033

Figure 104: South Asia and Pacific Value Share (%) and BPS Analysis by Applications, 2023 to 2033

Figure 105: South Asia and Pacific Y-o-Y Growth (%) Projections by Applications, 2023 to 2033

Figure 106: South Asia and Pacific Attractiveness by End-User, 2023 to 2033

Figure 107: South Asia and Pacific Attractiveness by Applications, 2023 to 2033

Figure 108: South Asia and Pacific Attractiveness by Country, 2023 to 2033

Figure 109: East Asia Value (US$ Million) by End-User, 2023 to 2033

Figure 110: East Asia Value (US$ Million) by Applications, 2023 to 2033

Figure 111: East Asia Value (US$ Million) by Country, 2023 to 2033

Figure 112: East Asia Value (US$ Million) Analysis by Country, 2018 to 2033

Figure 113: East Asia Volume (Units) Analysis by Country, 2018 to 2033

Figure 114: East Asia Value Share (%) and BPS Analysis by Country, 2023 to 2033

Figure 115: East Asia Y-o-Y Growth (%) Projections by Country, 2023 to 2033

Figure 116: East Asia Value (US$ Million) Analysis by End-User, 2018 to 2033

Figure 117: East Asia Volume (Units) Analysis by End-User, 2018 to 2033

Figure 118: East Asia Value Share (%) and BPS Analysis by End-User, 2023 to 2033

Figure 119: East Asia Y-o-Y Growth (%) Projections by End-User, 2023 to 2033

Figure 120: East Asia Value (US$ Million) Analysis by Applications, 2018 to 2033

Figure 121: East Asia Volume (Units) Analysis by Applications, 2018 to 2033

Figure 122: East Asia Value Share (%) and BPS Analysis by Applications, 2023 to 2033

Figure 123: East Asia Y-o-Y Growth (%) Projections by Applications, 2023 to 2033

Figure 124: East Asia Attractiveness by End-User, 2023 to 2033

Figure 125: East Asia Attractiveness by Applications, 2023 to 2033

Figure 126: East Asia Attractiveness by Country, 2023 to 2033

Figure 127: Middle East and Africa Value (US$ Million) by End-User, 2023 to 2033

Figure 128: Middle East and Africa Value (US$ Million) by Applications, 2023 to 2033

Figure 129: Middle East and Africa Value (US$ Million) by Country, 2023 to 2033

Figure 130: Middle East and Africa Value (US$ Million) Analysis by Country, 2018 to 2033

Figure 131: Middle East and Africa Volume (Units) Analysis by Country, 2018 to 2033

Figure 132: Middle East and Africa Value Share (%) and BPS Analysis by Country, 2023 to 2033

Figure 133: Middle East and Africa Y-o-Y Growth (%) Projections by Country, 2023 to 2033

Figure 134: Middle East and Africa Value (US$ Million) Analysis by End-User, 2018 to 2033

Figure 135: Middle East and Africa Volume (Units) Analysis by End-User, 2018 to 2033

Figure 136: Middle East and Africa Value Share (%) and BPS Analysis by End-User, 2023 to 2033

Figure 137: Middle East and Africa Y-o-Y Growth (%) Projections by End-User, 2023 to 2033

Figure 138: Middle East and Africa Value (US$ Million) Analysis by Applications, 2018 to 2033

Figure 139: Middle East and Africa Volume (Units) Analysis by Applications, 2018 to 2033

Figure 140: Middle East and Africa Value Share (%) and BPS Analysis by Applications, 2023 to 2033

Figure 141: Middle East and Africa Y-o-Y Growth (%) Projections by Applications, 2023 to 2033

Figure 142: Middle East and Africa Attractiveness by End-User, 2023 to 2033

Figure 143: Middle East and Africa Attractiveness by Applications, 2023 to 2033

Figure 144: Middle East and Africa Attractiveness by Country, 2023 to 2033

Recommendations

Technology

Mobile Augmented Reality Market

Published : June 2023

Technology

Augmented Reality and Virtual Reality Market

Published : May 2017

Explore Technology Insights

View Reports

Augmented Reality Glasses Market