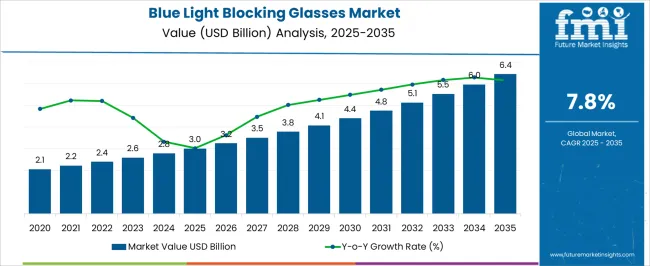
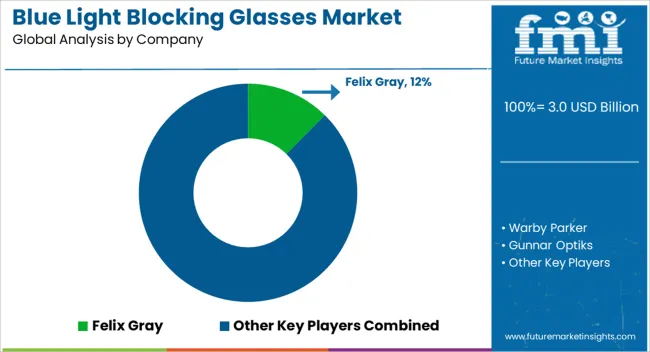
With the rising prevalence of eye-related issues, the global blue light blocking glasses market growth will estimatedly achieve a promising advancement of a CAGR of 7.9%, elevating the blue light blocking glasses market size to USD 5.98 billion by 2034. The market will be lifted from USD 2.79 billion measured in 2024.
In the digital world, it has become common to have severe headaches, strained eyes, and other issues due to overexposure to computer rays. Every person must seek preventive measures to ensure better physical health. What to do?
Switch to a pen-and-paper system by eliminating digital screens No, this can not be the solution. Blue light blocking glasses might be one.
Attributes | Key Insights |
---|---|
Estimated Market Size in 2024 | USD 2.79 billion |
Projected Market Value in 2034 | USD 5.98 billion |
Value-based CAGR from 2024 to 2034 | 7.9% |
Historically, the blue light blocking glasses market growth was occurring at a moderate CAGR of 7.3%. Due to this advancement rate, the blue light blocking glasses market size inflated from USD 1.96 billion to USD 2.6 billion from 2019 to 2023.
The rising prevalence of consumers’ complaints of irregular sleep schedules, eye strain, etc., pointed toward the side effects of digital rays. Due to this, medical professionals started recommending protective eyewear, fueling the blue light blocking glasses market growth.
Historical CAGR from 2019 to 2023 | 7.3% |
---|---|
Forecast CAGR from 2024 to 2034 | 7.9% |
The growing technological infrastructure will assist leading blue light blocking glasses manufacturers in innovating and expanding the market reach. Due to this, consumer demand will surge, enhancing the blue light blocking glasses market size.
The growing demand for customizable products will likely benefit the market as products can be manufactured based on consumer requirements. The growing premium product segment will also govern the market growth.
Technological advancements will likely assist leading blue light blocking glasses manufacturers in North America to innovate and expand. Due to this, the region will likely lead the global market.
The changing fashion trends in Europe will likely govern the blue light blocking glasses market growth. Also, a vast competitive landscape will be created due to changing consumer fashion trends.
Countries in the Asia-Pacific region focus on local development, creating several opportunities for the regional players. They actively participate in the expansion of the market, fueling the blue light blocking glasses market size enlargement.
Forecast CAGRs from 2024 to 2034
Countries | Forecasted CAGR |
---|---|
Spain | 5.7% |
Canada | 8.9% |
Japan | 9.1% |
China | 9.3% |
India | 9.9% |
The blue light blocking glasses market size in Spain will increase at a decent 5.7% CAGR through 2034. Consumer trends in Spain are rapidly changing, shifting toward upgradation and integration of different trend styles.
Spanish consumers prefer a bold look with thick frames. Such trends help leading blue light blocking glasses manufacturers integrate the relevant technology in these frames easily, attracting consumers. Blue light blocking glasses are considered emerging fashion icons in the eyewear market, fueling the market demand.
The Canadian blue light blocking glasses market growth will be occurring at 8.9% through 2034. The corporate culture in Canada has started to shift to hybrid working modes or completely remote working modes.
Due to this, consumers are required to spend more time on digital instruments, exposing themselves to digital screens more. This generates more demand for protective eyewear, driving the market.
Technological advancements in Japan are augmenting the eyewear industry. The recent developments indicate toward changing landscape of the sector due to the developments in lens technology.
Leading blue light blocking glasses manufacturers produce recyclable lenses that will augment the industry, driving the product demand. Due to these factors, the Japanese blue light blocking glasses market size will be increasing at a promising CAGR of 9.1%.
The growing e-commerce network in the country assists in the distribution and contact touchpoints for customers. A strong bridge between manufacturers and customers can be established through this.
Also, consumers get more product choices, which fuels the market progress at a rising rate. Furthermore, the dominance of the D2C network in the country enhances the brand image through elevated customer service. Thus, the Chinese blue light blocking glasses market growth will accelerate at 9.3%.
The Indian blue light blocking glasses market size will increase the fastest, at the highest CAGR of 9.9% through 2034. The Indian government has designed regulatory policies to maintain employee wellness.
Employers are encouraged to prevail over all the protective measures for employees. Blue light blocking glasses are an integral part of any workplace. So, this drives the market. Also, the growing smartphone market in the country will surge the demand for blue light blocking glasses, fueling the market advancement.
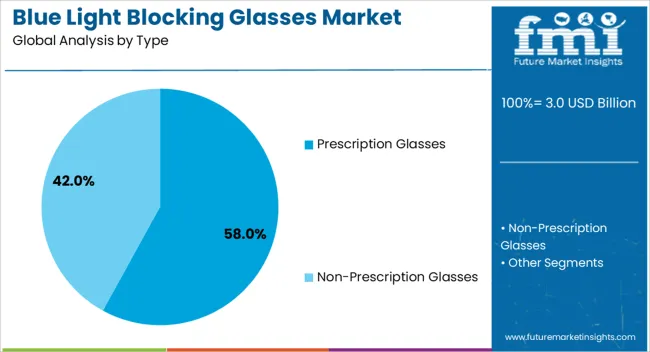
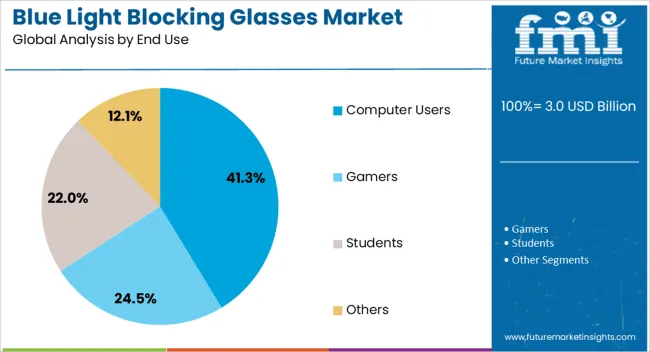
The blue light blocking glasses market growth is governed by the prescription type and computer user segments. Digital transformation and the growing prevalence of health disorders are two major drivers for these two segments.
Category | Type (Prescription) |
---|---|
Market Share in 2024 | 58.00% |
Market Segment Drivers |
|
Category | End Use (Computer Users) |
---|---|
Market Share in 2024 | 41.30% |
Market Segment Drivers |
|
Leading blue light blocking glasses manufacturers find a market niche through their innovation. A substantial market share is occupied using different modes of expansion, which avails a competitive edge to them. The highly cluttered competitive space is expanded using partnerships, collaborations, acquisitions, mergers, and international expansions.
New entrants possess significantly lesser negotiating power due to their lesser market occupancy. However, they can expand using innovation as a key market penetration mode. They can also form strategic alliances with key competitors. This ecosystem creates growth prospects, fueling the blue light blocking glasses market size.
Key Market Developments
Attributes | Details |
---|---|
Estimated Market Size in 2024 | USD 2.79 billion |
Projected Market Valuation in 2034 | USD 5.98 billion |
Value-based CAGR 2024 to 2034 | 7.9% |
Forecast Period | 2024 to 2034 |
Historical Data Available for | 2019 to 2023 |
Market Analysis | Value in USD billion |
Key Regions Covered | North America; Latin America; Western Europe; Eastern Europe; South Asia and Pacific; East Asia; The Middle East and Africa |
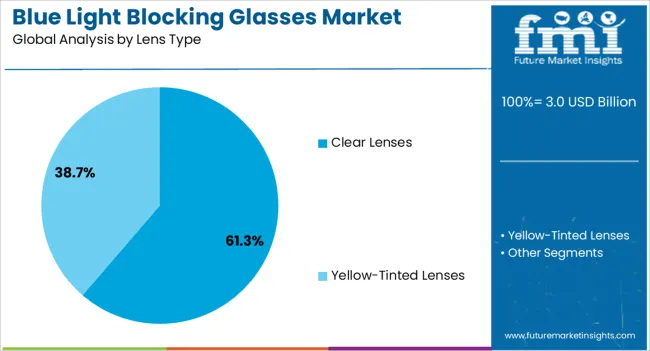
Key Market Segments Covered | Type, Lens Type, End Use, Consumer Orientation, Sales Channel, Region |
Key Countries Profiled | The United States, Canada, Brazil, Mexico, Germany, The United Kingdom, France, Spain, Italy, Poland, Russia, Czech Republic, Romania, India, Bangladesh, Australia, New Zealand, China, Japan, South Korea, GCC Countries, South Africa, Israel |
Key Companies Profiled | Felix Gray; Warby Parker; Gunnar Optiks; EyeBuyDirect; Pixel Eyewear; Zenni Optical; Swanwick Sleep; Spectra479; Prospek; Baxter Blue; Quay Australia; TIJN Eyewear; Swanwick; Blue Planet Eyewear; Cyxus |
Table 1: Global Market Value (US$ Million) Forecast by Region, 2019 to 2034
Table 2: Global Market Volume (Pairs) Forecast by Region, 2019 to 2034
Table 3: Global Market Value (US$ Million) Forecast by Type, 2019 to 2034
Table 4: Global Market Volume (Pairs) Forecast by Type, 2019 to 2034
Table 5: Global Market Value (US$ Million) Forecast by Lens Type, 2019 to 2034
Table 6: Global Market Volume (Pairs) Forecast by Lens Type, 2019 to 2034
Table 7: Global Market Value (US$ Million) Forecast by End Use, 2019 to 2034
Table 8: Global Market Volume (Pairs) Forecast by End Use, 2019 to 2034
Table 9: Global Market Value (US$ Million) Forecast by Consumer Orientation, 2019 to 2034
Table 10: Global Market Volume (Pairs) Forecast by Consumer Orientation, 2019 to 2034
Table 11: Global Market Value (US$ Million) Forecast by Sales Channel, 2019 to 2034
Table 12: Global Market Volume (Pairs) Forecast by Sales Channel, 2019 to 2034
Table 13: North America Market Value (US$ Million) Forecast by Country, 2019 to 2034
Table 14: North America Market Volume (Pairs) Forecast by Country, 2019 to 2034
Table 15: North America Market Value (US$ Million) Forecast by Type, 2019 to 2034
Table 16: North America Market Volume (Pairs) Forecast by Type, 2019 to 2034
Table 17: North America Market Value (US$ Million) Forecast by Lens Type, 2019 to 2034
Table 18: North America Market Volume (Pairs) Forecast by Lens Type, 2019 to 2034
Table 19: North America Market Value (US$ Million) Forecast by End Use, 2019 to 2034
Table 20: North America Market Volume (Pairs) Forecast by End Use, 2019 to 2034
Table 21: North America Market Value (US$ Million) Forecast by Consumer Orientation, 2019 to 2034
Table 22: North America Market Volume (Pairs) Forecast by Consumer Orientation, 2019 to 2034
Table 23: North America Market Value (US$ Million) Forecast by Sales Channel, 2019 to 2034
Table 24: North America Market Volume (Pairs) Forecast by Sales Channel, 2019 to 2034
Table 25: Latin America Market Value (US$ Million) Forecast by Country, 2019 to 2034
Table 26: Latin America Market Volume (Pairs) Forecast by Country, 2019 to 2034
Table 27: Latin America Market Value (US$ Million) Forecast by Type, 2019 to 2034
Table 28: Latin America Market Volume (Pairs) Forecast by Type, 2019 to 2034
Table 29: Latin America Market Value (US$ Million) Forecast by Lens Type, 2019 to 2034
Table 30: Latin America Market Volume (Pairs) Forecast by Lens Type, 2019 to 2034
Table 31: Latin America Market Value (US$ Million) Forecast by End Use, 2019 to 2034
Table 32: Latin America Market Volume (Pairs) Forecast by End Use, 2019 to 2034
Table 33: Latin America Market Value (US$ Million) Forecast by Consumer Orientation, 2019 to 2034
Table 34: Latin America Market Volume (Pairs) Forecast by Consumer Orientation, 2019 to 2034
Table 35: Latin America Market Value (US$ Million) Forecast by Sales Channel, 2019 to 2034
Table 36: Latin America Market Volume (Pairs) Forecast by Sales Channel, 2019 to 2034
Table 37: Western Europe Market Value (US$ Million) Forecast by Country, 2019 to 2034
Table 38: Western Europe Market Volume (Pairs) Forecast by Country, 2019 to 2034
Table 39: Western Europe Market Value (US$ Million) Forecast by Type, 2019 to 2034
Table 40: Western Europe Market Volume (Pairs) Forecast by Type, 2019 to 2034
Table 41: Western Europe Market Value (US$ Million) Forecast by Lens Type, 2019 to 2034
Table 42: Western Europe Market Volume (Pairs) Forecast by Lens Type, 2019 to 2034
Table 43: Western Europe Market Value (US$ Million) Forecast by End Use, 2019 to 2034
Table 44: Western Europe Market Volume (Pairs) Forecast by End Use, 2019 to 2034
Table 45: Western Europe Market Value (US$ Million) Forecast by Consumer Orientation, 2019 to 2034
Table 46: Western Europe Market Volume (Pairs) Forecast by Consumer Orientation, 2019 to 2034
Table 47: Western Europe Market Value (US$ Million) Forecast by Sales Channel, 2019 to 2034
Table 48: Western Europe Market Volume (Pairs) Forecast by Sales Channel, 2019 to 2034
Table 49: Eastern Europe Market Value (US$ Million) Forecast by Country, 2019 to 2034
Table 50: Eastern Europe Market Volume (Pairs) Forecast by Country, 2019 to 2034
Table 51: Eastern Europe Market Value (US$ Million) Forecast by Type, 2019 to 2034
Table 52: Eastern Europe Market Volume (Pairs) Forecast by Type, 2019 to 2034
Table 53: Eastern Europe Market Value (US$ Million) Forecast by Lens Type, 2019 to 2034
Table 54: Eastern Europe Market Volume (Pairs) Forecast by Lens Type, 2019 to 2034
Table 55: Eastern Europe Market Value (US$ Million) Forecast by End Use, 2019 to 2034
Table 56: Eastern Europe Market Volume (Pairs) Forecast by End Use, 2019 to 2034
Table 57: Eastern Europe Market Value (US$ Million) Forecast by Consumer Orientation, 2019 to 2034
Table 58: Eastern Europe Market Volume (Pairs) Forecast by Consumer Orientation, 2019 to 2034
Table 59: Eastern Europe Market Value (US$ Million) Forecast by Sales Channel, 2019 to 2034
Table 60: Eastern Europe Market Volume (Pairs) Forecast by Sales Channel, 2019 to 2034
Table 61: South Asia and Pacific Market Value (US$ Million) Forecast by Country, 2019 to 2034
Table 62: South Asia and Pacific Market Volume (Pairs) Forecast by Country, 2019 to 2034
Table 63: South Asia and Pacific Market Value (US$ Million) Forecast by Type, 2019 to 2034
Table 64: South Asia and Pacific Market Volume (Pairs) Forecast by Type, 2019 to 2034
Table 65: South Asia and Pacific Market Value (US$ Million) Forecast by Lens Type, 2019 to 2034
Table 66: South Asia and Pacific Market Volume (Pairs) Forecast by Lens Type, 2019 to 2034
Table 67: South Asia and Pacific Market Value (US$ Million) Forecast by End Use, 2019 to 2034
Table 68: South Asia and Pacific Market Volume (Pairs) Forecast by End Use, 2019 to 2034
Table 69: South Asia and Pacific Market Value (US$ Million) Forecast by Consumer Orientation, 2019 to 2034
Table 70: South Asia and Pacific Market Volume (Pairs) Forecast by Consumer Orientation, 2019 to 2034
Table 71: South Asia and Pacific Market Value (US$ Million) Forecast by Sales Channel, 2019 to 2034
Table 72: South Asia and Pacific Market Volume (Pairs) Forecast by Sales Channel, 2019 to 2034
Table 73: East Asia Market Value (US$ Million) Forecast by Country, 2019 to 2034
Table 74: East Asia Market Volume (Pairs) Forecast by Country, 2019 to 2034
Table 75: East Asia Market Value (US$ Million) Forecast by Type, 2019 to 2034
Table 76: East Asia Market Volume (Pairs) Forecast by Type, 2019 to 2034
Table 77: East Asia Market Value (US$ Million) Forecast by Lens Type, 2019 to 2034
Table 78: East Asia Market Volume (Pairs) Forecast by Lens Type, 2019 to 2034
Table 79: East Asia Market Value (US$ Million) Forecast by End Use, 2019 to 2034
Table 80: East Asia Market Volume (Pairs) Forecast by End Use, 2019 to 2034
Table 81: East Asia Market Value (US$ Million) Forecast by Consumer Orientation, 2019 to 2034
Table 82: East Asia Market Volume (Pairs) Forecast by Consumer Orientation, 2019 to 2034
Table 83: East Asia Market Value (US$ Million) Forecast by Sales Channel, 2019 to 2034
Table 84: East Asia Market Volume (Pairs) Forecast by Sales Channel, 2019 to 2034
Table 85: Middle East and Africa Market Value (US$ Million) Forecast by Country, 2019 to 2034
Table 86: Middle East and Africa Market Volume (Pairs) Forecast by Country, 2019 to 2034
Table 87: Middle East and Africa Market Value (US$ Million) Forecast by Type, 2019 to 2034
Table 88: Middle East and Africa Market Volume (Pairs) Forecast by Type, 2019 to 2034
Table 89: Middle East and Africa Market Value (US$ Million) Forecast by Lens Type, 2019 to 2034
Table 90: Middle East and Africa Market Volume (Pairs) Forecast by Lens Type, 2019 to 2034
Table 91: Middle East and Africa Market Value (US$ Million) Forecast by End Use, 2019 to 2034
Table 92: Middle East and Africa Market Volume (Pairs) Forecast by End Use, 2019 to 2034
Table 93: Middle East and Africa Market Value (US$ Million) Forecast by Consumer Orientation, 2019 to 2034
Table 94: Middle East and Africa Market Volume (Pairs) Forecast by Consumer Orientation, 2019 to 2034
Table 95: Middle East and Africa Market Value (US$ Million) Forecast by Sales Channel, 2019 to 2034
Table 96: Middle East and Africa Market Volume (Pairs) Forecast by Sales Channel, 2019 to 2034
Figure 1: Global Market Value (US$ Million) by Type, 2024 to 2034
Figure 2: Global Market Value (US$ Million) by Lens Type, 2024 to 2034
Figure 3: Global Market Value (US$ Million) by End Use, 2024 to 2034
Figure 4: Global Market Value (US$ Million) by Consumer Orientation, 2024 to 2034
Figure 5: Global Market Value (US$ Million) by Sales Channel, 2024 to 2034
Figure 6: Global Market Value (US$ Million) by Region, 2024 to 2034
Figure 7: Global Market Value (US$ Million) Analysis by Region, 2019 to 2034
Figure 8: Global Market Volume (Pairs) Analysis by Region, 2019 to 2034
Figure 9: Global Market Value Share (%) and BPS Analysis by Region, 2024 to 2034
Figure 10: Global Market Y-o-Y Growth (%) Projections by Region, 2024 to 2034
Figure 11: Global Market Value (US$ Million) Analysis by Type, 2019 to 2034
Figure 12: Global Market Volume (Pairs) Analysis by Type, 2019 to 2034
Figure 13: Global Market Value Share (%) and BPS Analysis by Type, 2024 to 2034
Figure 14: Global Market Y-o-Y Growth (%) Projections by Type, 2024 to 2034
Figure 15: Global Market Value (US$ Million) Analysis by Lens Type, 2019 to 2034
Figure 16: Global Market Volume (Pairs) Analysis by Lens Type, 2019 to 2034
Figure 17: Global Market Value Share (%) and BPS Analysis by Lens Type, 2024 to 2034
Figure 18: Global Market Y-o-Y Growth (%) Projections by Lens Type, 2024 to 2034
Figure 19: Global Market Value (US$ Million) Analysis by End Use, 2019 to 2034
Figure 20: Global Market Volume (Pairs) Analysis by End Use, 2019 to 2034
Figure 21: Global Market Value Share (%) and BPS Analysis by End Use, 2024 to 2034
Figure 22: Global Market Y-o-Y Growth (%) Projections by End Use, 2024 to 2034
Figure 23: Global Market Value (US$ Million) Analysis by Consumer Orientation, 2019 to 2034
Figure 24: Global Market Volume (Pairs) Analysis by Consumer Orientation, 2019 to 2034
Figure 25: Global Market Value Share (%) and BPS Analysis by Consumer Orientation, 2024 to 2034
Figure 26: Global Market Y-o-Y Growth (%) Projections by Consumer Orientation, 2024 to 2034
Figure 27: Global Market Value (US$ Million) Analysis by Sales Channel, 2019 to 2034
Figure 28: Global Market Volume (Pairs) Analysis by Sales Channel, 2019 to 2034
Figure 29: Global Market Value Share (%) and BPS Analysis by Sales Channel, 2024 to 2034
Figure 30: Global Market Y-o-Y Growth (%) Projections by Sales Channel, 2024 to 2034
Figure 31: Global Market Attractiveness by Type, 2024 to 2034
Figure 32: Global Market Attractiveness by Lens Type, 2024 to 2034
Figure 33: Global Market Attractiveness by End Use, 2024 to 2034
Figure 34: Global Market Attractiveness by Consumer Orientation, 2024 to 2034
Figure 35: Global Market Attractiveness by Sales Channel, 2024 to 2034
Figure 36: Global Market Attractiveness by Region, 2024 to 2034
Figure 37: North America Market Value (US$ Million) by Type, 2024 to 2034
Figure 38: North America Market Value (US$ Million) by Lens Type, 2024 to 2034
Figure 39: North America Market Value (US$ Million) by End Use, 2024 to 2034
Figure 40: North America Market Value (US$ Million) by Consumer Orientation, 2024 to 2034
Figure 41: North America Market Value (US$ Million) by Sales Channel, 2024 to 2034
Figure 42: North America Market Value (US$ Million) by Country, 2024 to 2034
Figure 43: North America Market Value (US$ Million) Analysis by Country, 2019 to 2034
Figure 44: North America Market Volume (Pairs) Analysis by Country, 2019 to 2034
Figure 45: North America Market Value Share (%) and BPS Analysis by Country, 2024 to 2034
Figure 46: North America Market Y-o-Y Growth (%) Projections by Country, 2024 to 2034
Figure 47: North America Market Value (US$ Million) Analysis by Type, 2019 to 2034
Figure 48: North America Market Volume (Pairs) Analysis by Type, 2019 to 2034
Figure 49: North America Market Value Share (%) and BPS Analysis by Type, 2024 to 2034
Figure 50: North America Market Y-o-Y Growth (%) Projections by Type, 2024 to 2034
Figure 51: North America Market Value (US$ Million) Analysis by Lens Type, 2019 to 2034
Figure 52: North America Market Volume (Pairs) Analysis by Lens Type, 2019 to 2034
Figure 53: North America Market Value Share (%) and BPS Analysis by Lens Type, 2024 to 2034
Figure 54: North America Market Y-o-Y Growth (%) Projections by Lens Type, 2024 to 2034
Figure 55: North America Market Value (US$ Million) Analysis by End Use, 2019 to 2034
Figure 56: North America Market Volume (Pairs) Analysis by End Use, 2019 to 2034
Figure 57: North America Market Value Share (%) and BPS Analysis by End Use, 2024 to 2034
Figure 58: North America Market Y-o-Y Growth (%) Projections by End Use, 2024 to 2034
Figure 59: North America Market Value (US$ Million) Analysis by Consumer Orientation, 2019 to 2034
Figure 60: North America Market Volume (Pairs) Analysis by Consumer Orientation, 2019 to 2034
Figure 61: North America Market Value Share (%) and BPS Analysis by Consumer Orientation, 2024 to 2034
Figure 62: North America Market Y-o-Y Growth (%) Projections by Consumer Orientation, 2024 to 2034
Figure 63: North America Market Value (US$ Million) Analysis by Sales Channel, 2019 to 2034
Figure 64: North America Market Volume (Pairs) Analysis by Sales Channel, 2019 to 2034
Figure 65: North America Market Value Share (%) and BPS Analysis by Sales Channel, 2024 to 2034
Figure 66: North America Market Y-o-Y Growth (%) Projections by Sales Channel, 2024 to 2034
Figure 67: North America Market Attractiveness by Type, 2024 to 2034
Figure 68: North America Market Attractiveness by Lens Type, 2024 to 2034
Figure 69: North America Market Attractiveness by End Use, 2024 to 2034
Figure 70: North America Market Attractiveness by Consumer Orientation, 2024 to 2034
Figure 71: North America Market Attractiveness by Sales Channel, 2024 to 2034
Figure 72: North America Market Attractiveness by Country, 2024 to 2034
Figure 73: Latin America Market Value (US$ Million) by Type, 2024 to 2034
Figure 74: Latin America Market Value (US$ Million) by Lens Type, 2024 to 2034
Figure 75: Latin America Market Value (US$ Million) by End Use, 2024 to 2034
Figure 76: Latin America Market Value (US$ Million) by Consumer Orientation, 2024 to 2034
Figure 77: Latin America Market Value (US$ Million) by Sales Channel, 2024 to 2034
Figure 78: Latin America Market Value (US$ Million) by Country, 2024 to 2034
Figure 79: Latin America Market Value (US$ Million) Analysis by Country, 2019 to 2034
Figure 80: Latin America Market Volume (Pairs) Analysis by Country, 2019 to 2034
Figure 81: Latin America Market Value Share (%) and BPS Analysis by Country, 2024 to 2034
Figure 82: Latin America Market Y-o-Y Growth (%) Projections by Country, 2024 to 2034
Figure 83: Latin America Market Value (US$ Million) Analysis by Type, 2019 to 2034
Figure 84: Latin America Market Volume (Pairs) Analysis by Type, 2019 to 2034
Figure 85: Latin America Market Value Share (%) and BPS Analysis by Type, 2024 to 2034
Figure 86: Latin America Market Y-o-Y Growth (%) Projections by Type, 2024 to 2034
Figure 87: Latin America Market Value (US$ Million) Analysis by Lens Type, 2019 to 2034
Figure 88: Latin America Market Volume (Pairs) Analysis by Lens Type, 2019 to 2034
Figure 89: Latin America Market Value Share (%) and BPS Analysis by Lens Type, 2024 to 2034
Figure 90: Latin America Market Y-o-Y Growth (%) Projections by Lens Type, 2024 to 2034
Figure 91: Latin America Market Value (US$ Million) Analysis by End Use, 2019 to 2034
Figure 92: Latin America Market Volume (Pairs) Analysis by End Use, 2019 to 2034
Figure 93: Latin America Market Value Share (%) and BPS Analysis by End Use, 2024 to 2034
Figure 94: Latin America Market Y-o-Y Growth (%) Projections by End Use, 2024 to 2034
Figure 95: Latin America Market Value (US$ Million) Analysis by Consumer Orientation, 2019 to 2034
Figure 96: Latin America Market Volume (Pairs) Analysis by Consumer Orientation, 2019 to 2034
Figure 97: Latin America Market Value Share (%) and BPS Analysis by Consumer Orientation, 2024 to 2034
Figure 98: Latin America Market Y-o-Y Growth (%) Projections by Consumer Orientation, 2024 to 2034
Figure 99: Latin America Market Value (US$ Million) Analysis by Sales Channel, 2019 to 2034
Figure 100: Latin America Market Volume (Pairs) Analysis by Sales Channel, 2019 to 2034
Figure 101: Latin America Market Value Share (%) and BPS Analysis by Sales Channel, 2024 to 2034
Figure 102: Latin America Market Y-o-Y Growth (%) Projections by Sales Channel, 2024 to 2034
Figure 103: Latin America Market Attractiveness by Type, 2024 to 2034
Figure 104: Latin America Market Attractiveness by Lens Type, 2024 to 2034
Figure 105: Latin America Market Attractiveness by End Use, 2024 to 2034
Figure 106: Latin America Market Attractiveness by Consumer Orientation, 2024 to 2034
Figure 107: Latin America Market Attractiveness by Sales Channel, 2024 to 2034
Figure 108: Latin America Market Attractiveness by Country, 2024 to 2034
Figure 109: Western Europe Market Value (US$ Million) by Type, 2024 to 2034
Figure 110: Western Europe Market Value (US$ Million) by Lens Type, 2024 to 2034
Figure 111: Western Europe Market Value (US$ Million) by End Use, 2024 to 2034
Figure 112: Western Europe Market Value (US$ Million) by Consumer Orientation, 2024 to 2034
Figure 113: Western Europe Market Value (US$ Million) by Sales Channel, 2024 to 2034
Figure 114: Western Europe Market Value (US$ Million) by Country, 2024 to 2034
Figure 115: Western Europe Market Value (US$ Million) Analysis by Country, 2019 to 2034
Figure 116: Western Europe Market Volume (Pairs) Analysis by Country, 2019 to 2034
Figure 117: Western Europe Market Value Share (%) and BPS Analysis by Country, 2024 to 2034
Figure 118: Western Europe Market Y-o-Y Growth (%) Projections by Country, 2024 to 2034
Figure 119: Western Europe Market Value (US$ Million) Analysis by Type, 2019 to 2034
Figure 120: Western Europe Market Volume (Pairs) Analysis by Type, 2019 to 2034
Figure 121: Western Europe Market Value Share (%) and BPS Analysis by Type, 2024 to 2034
Figure 122: Western Europe Market Y-o-Y Growth (%) Projections by Type, 2024 to 2034
Figure 123: Western Europe Market Value (US$ Million) Analysis by Lens Type, 2019 to 2034
Figure 124: Western Europe Market Volume (Pairs) Analysis by Lens Type, 2019 to 2034
Figure 125: Western Europe Market Value Share (%) and BPS Analysis by Lens Type, 2024 to 2034
Figure 126: Western Europe Market Y-o-Y Growth (%) Projections by Lens Type, 2024 to 2034
Figure 127: Western Europe Market Value (US$ Million) Analysis by End Use, 2019 to 2034
Figure 128: Western Europe Market Volume (Pairs) Analysis by End Use, 2019 to 2034
Figure 129: Western Europe Market Value Share (%) and BPS Analysis by End Use, 2024 to 2034
Figure 130: Western Europe Market Y-o-Y Growth (%) Projections by End Use, 2024 to 2034
Figure 131: Western Europe Market Value (US$ Million) Analysis by Consumer Orientation, 2019 to 2034
Figure 132: Western Europe Market Volume (Pairs) Analysis by Consumer Orientation, 2019 to 2034
Figure 133: Western Europe Market Value Share (%) and BPS Analysis by Consumer Orientation, 2024 to 2034
Figure 134: Western Europe Market Y-o-Y Growth (%) Projections by Consumer Orientation, 2024 to 2034
Figure 135: Western Europe Market Value (US$ Million) Analysis by Sales Channel, 2019 to 2034
Figure 136: Western Europe Market Volume (Pairs) Analysis by Sales Channel, 2019 to 2034
Figure 137: Western Europe Market Value Share (%) and BPS Analysis by Sales Channel, 2024 to 2034
Figure 138: Western Europe Market Y-o-Y Growth (%) Projections by Sales Channel, 2024 to 2034
Figure 139: Western Europe Market Attractiveness by Type, 2024 to 2034
Figure 140: Western Europe Market Attractiveness by Lens Type, 2024 to 2034
Figure 141: Western Europe Market Attractiveness by End Use, 2024 to 2034
Figure 142: Western Europe Market Attractiveness by Consumer Orientation, 2024 to 2034
Figure 143: Western Europe Market Attractiveness by Sales Channel, 2024 to 2034
Figure 144: Western Europe Market Attractiveness by Country, 2024 to 2034
Figure 145: Eastern Europe Market Value (US$ Million) by Type, 2024 to 2034
Figure 146: Eastern Europe Market Value (US$ Million) by Lens Type, 2024 to 2034
Figure 147: Eastern Europe Market Value (US$ Million) by End Use, 2024 to 2034
Figure 148: Eastern Europe Market Value (US$ Million) by Consumer Orientation, 2024 to 2034
Figure 149: Eastern Europe Market Value (US$ Million) by Sales Channel, 2024 to 2034
Figure 150: Eastern Europe Market Value (US$ Million) by Country, 2024 to 2034
Figure 151: Eastern Europe Market Value (US$ Million) Analysis by Country, 2019 to 2034
Figure 152: Eastern Europe Market Volume (Pairs) Analysis by Country, 2019 to 2034
Figure 153: Eastern Europe Market Value Share (%) and BPS Analysis by Country, 2024 to 2034
Figure 154: Eastern Europe Market Y-o-Y Growth (%) Projections by Country, 2024 to 2034
Figure 155: Eastern Europe Market Value (US$ Million) Analysis by Type, 2019 to 2034
Figure 156: Eastern Europe Market Volume (Pairs) Analysis by Type, 2019 to 2034
Figure 157: Eastern Europe Market Value Share (%) and BPS Analysis by Type, 2024 to 2034
Figure 158: Eastern Europe Market Y-o-Y Growth (%) Projections by Type, 2024 to 2034
Figure 159: Eastern Europe Market Value (US$ Million) Analysis by Lens Type, 2019 to 2034
Figure 160: Eastern Europe Market Volume (Pairs) Analysis by Lens Type, 2019 to 2034
Figure 161: Eastern Europe Market Value Share (%) and BPS Analysis by Lens Type, 2024 to 2034
Figure 162: Eastern Europe Market Y-o-Y Growth (%) Projections by Lens Type, 2024 to 2034
Figure 163: Eastern Europe Market Value (US$ Million) Analysis by End Use, 2019 to 2034
Figure 164: Eastern Europe Market Volume (Pairs) Analysis by End Use, 2019 to 2034
Figure 165: Eastern Europe Market Value Share (%) and BPS Analysis by End Use, 2024 to 2034
Figure 166: Eastern Europe Market Y-o-Y Growth (%) Projections by End Use, 2024 to 2034
Figure 167: Eastern Europe Market Value (US$ Million) Analysis by Consumer Orientation, 2019 to 2034
Figure 168: Eastern Europe Market Volume (Pairs) Analysis by Consumer Orientation, 2019 to 2034
Figure 169: Eastern Europe Market Value Share (%) and BPS Analysis by Consumer Orientation, 2024 to 2034
Figure 170: Eastern Europe Market Y-o-Y Growth (%) Projections by Consumer Orientation, 2024 to 2034
Figure 171: Eastern Europe Market Value (US$ Million) Analysis by Sales Channel, 2019 to 2034
Figure 172: Eastern Europe Market Volume (Pairs) Analysis by Sales Channel, 2019 to 2034
Figure 173: Eastern Europe Market Value Share (%) and BPS Analysis by Sales Channel, 2024 to 2034
Figure 174: Eastern Europe Market Y-o-Y Growth (%) Projections by Sales Channel, 2024 to 2034
Figure 175: Eastern Europe Market Attractiveness by Type, 2024 to 2034
Figure 176: Eastern Europe Market Attractiveness by Lens Type, 2024 to 2034
Figure 177: Eastern Europe Market Attractiveness by End Use, 2024 to 2034
Figure 178: Eastern Europe Market Attractiveness by Consumer Orientation, 2024 to 2034
Figure 179: Eastern Europe Market Attractiveness by Sales Channel, 2024 to 2034
Figure 180: Eastern Europe Market Attractiveness by Country, 2024 to 2034
Figure 181: South Asia and Pacific Market Value (US$ Million) by Type, 2024 to 2034
Figure 182: South Asia and Pacific Market Value (US$ Million) by Lens Type, 2024 to 2034
Figure 183: South Asia and Pacific Market Value (US$ Million) by End Use, 2024 to 2034
Figure 184: South Asia and Pacific Market Value (US$ Million) by Consumer Orientation, 2024 to 2034
Figure 185: South Asia and Pacific Market Value (US$ Million) by Sales Channel, 2024 to 2034
Figure 186: South Asia and Pacific Market Value (US$ Million) by Country, 2024 to 2034
Figure 187: South Asia and Pacific Market Value (US$ Million) Analysis by Country, 2019 to 2034
Figure 188: South Asia and Pacific Market Volume (Pairs) Analysis by Country, 2019 to 2034
Figure 189: South Asia and Pacific Market Value Share (%) and BPS Analysis by Country, 2024 to 2034
Figure 190: South Asia and Pacific Market Y-o-Y Growth (%) Projections by Country, 2024 to 2034
Figure 191: South Asia and Pacific Market Value (US$ Million) Analysis by Type, 2019 to 2034
Figure 192: South Asia and Pacific Market Volume (Pairs) Analysis by Type, 2019 to 2034
Figure 193: South Asia and Pacific Market Value Share (%) and BPS Analysis by Type, 2024 to 2034
Figure 194: South Asia and Pacific Market Y-o-Y Growth (%) Projections by Type, 2024 to 2034
Figure 195: South Asia and Pacific Market Value (US$ Million) Analysis by Lens Type, 2019 to 2034
Figure 196: South Asia and Pacific Market Volume (Pairs) Analysis by Lens Type, 2019 to 2034
Figure 197: South Asia and Pacific Market Value Share (%) and BPS Analysis by Lens Type, 2024 to 2034
Figure 198: South Asia and Pacific Market Y-o-Y Growth (%) Projections by Lens Type, 2024 to 2034
Figure 199: South Asia and Pacific Market Value (US$ Million) Analysis by End Use, 2019 to 2034
Figure 200: South Asia and Pacific Market Volume (Pairs) Analysis by End Use, 2019 to 2034
Figure 201: South Asia and Pacific Market Value Share (%) and BPS Analysis by End Use, 2024 to 2034
Figure 202: South Asia and Pacific Market Y-o-Y Growth (%) Projections by End Use, 2024 to 2034
Figure 203: South Asia and Pacific Market Value (US$ Million) Analysis by Consumer Orientation, 2019 to 2034
Figure 204: South Asia and Pacific Market Volume (Pairs) Analysis by Consumer Orientation, 2019 to 2034
Figure 205: South Asia and Pacific Market Value Share (%) and BPS Analysis by Consumer Orientation, 2024 to 2034
Figure 206: South Asia and Pacific Market Y-o-Y Growth (%) Projections by Consumer Orientation, 2024 to 2034
Figure 207: South Asia and Pacific Market Value (US$ Million) Analysis by Sales Channel, 2019 to 2034
Figure 208: South Asia and Pacific Market Volume (Pairs) Analysis by Sales Channel, 2019 to 2034
Figure 209: South Asia and Pacific Market Value Share (%) and BPS Analysis by Sales Channel, 2024 to 2034
Figure 210: South Asia and Pacific Market Y-o-Y Growth (%) Projections by Sales Channel, 2024 to 2034
Figure 211: South Asia and Pacific Market Attractiveness by Type, 2024 to 2034
Figure 212: South Asia and Pacific Market Attractiveness by Lens Type, 2024 to 2034
Figure 213: South Asia and Pacific Market Attractiveness by End Use, 2024 to 2034
Figure 214: South Asia and Pacific Market Attractiveness by Consumer Orientation, 2024 to 2034
Figure 215: South Asia and Pacific Market Attractiveness by Sales Channel, 2024 to 2034
Figure 216: South Asia and Pacific Market Attractiveness by Country, 2024 to 2034
Figure 217: East Asia Market Value (US$ Million) by Type, 2024 to 2034
Figure 218: East Asia Market Value (US$ Million) by Lens Type, 2024 to 2034
Figure 219: East Asia Market Value (US$ Million) by End Use, 2024 to 2034
Figure 220: East Asia Market Value (US$ Million) by Consumer Orientation, 2024 to 2034
Figure 221: East Asia Market Value (US$ Million) by Sales Channel, 2024 to 2034
Figure 222: East Asia Market Value (US$ Million) by Country, 2024 to 2034
Figure 223: East Asia Market Value (US$ Million) Analysis by Country, 2019 to 2034
Figure 224: East Asia Market Volume (Pairs) Analysis by Country, 2019 to 2034
Figure 225: East Asia Market Value Share (%) and BPS Analysis by Country, 2024 to 2034
Figure 226: East Asia Market Y-o-Y Growth (%) Projections by Country, 2024 to 2034
Figure 227: East Asia Market Value (US$ Million) Analysis by Type, 2019 to 2034
Figure 228: East Asia Market Volume (Pairs) Analysis by Type, 2019 to 2034
Figure 229: East Asia Market Value Share (%) and BPS Analysis by Type, 2024 to 2034
Figure 230: East Asia Market Y-o-Y Growth (%) Projections by Type, 2024 to 2034
Figure 231: East Asia Market Value (US$ Million) Analysis by Lens Type, 2019 to 2034
Figure 232: East Asia Market Volume (Pairs) Analysis by Lens Type, 2019 to 2034
Figure 233: East Asia Market Value Share (%) and BPS Analysis by Lens Type, 2024 to 2034
Figure 234: East Asia Market Y-o-Y Growth (%) Projections by Lens Type, 2024 to 2034
Figure 235: East Asia Market Value (US$ Million) Analysis by End Use, 2019 to 2034
Figure 236: East Asia Market Volume (Pairs) Analysis by End Use, 2019 to 2034
Figure 237: East Asia Market Value Share (%) and BPS Analysis by End Use, 2024 to 2034
Figure 238: East Asia Market Y-o-Y Growth (%) Projections by End Use, 2024 to 2034
Figure 239: East Asia Market Value (US$ Million) Analysis by Consumer Orientation, 2019 to 2034
Figure 240: East Asia Market Volume (Pairs) Analysis by Consumer Orientation, 2019 to 2034
Figure 241: East Asia Market Value Share (%) and BPS Analysis by Consumer Orientation, 2024 to 2034
Figure 242: East Asia Market Y-o-Y Growth (%) Projections by Consumer Orientation, 2024 to 2034
Figure 243: East Asia Market Value (US$ Million) Analysis by Sales Channel, 2019 to 2034
Figure 244: East Asia Market Volume (Pairs) Analysis by Sales Channel, 2019 to 2034
Figure 245: East Asia Market Value Share (%) and BPS Analysis by Sales Channel, 2024 to 2034
Figure 246: East Asia Market Y-o-Y Growth (%) Projections by Sales Channel, 2024 to 2034
Figure 247: East Asia Market Attractiveness by Type, 2024 to 2034
Figure 248: East Asia Market Attractiveness by Lens Type, 2024 to 2034
Figure 249: East Asia Market Attractiveness by End Use, 2024 to 2034
Figure 250: East Asia Market Attractiveness by Consumer Orientation, 2024 to 2034
Figure 251: East Asia Market Attractiveness by Sales Channel, 2024 to 2034
Figure 252: East Asia Market Attractiveness by Country, 2024 to 2034
Figure 253: Middle East and Africa Market Value (US$ Million) by Type, 2024 to 2034
Figure 254: Middle East and Africa Market Value (US$ Million) by Lens Type, 2024 to 2034
Figure 255: Middle East and Africa Market Value (US$ Million) by End Use, 2024 to 2034
Figure 256: Middle East and Africa Market Value (US$ Million) by Consumer Orientation, 2024 to 2034
Figure 257: Middle East and Africa Market Value (US$ Million) by Sales Channel, 2024 to 2034
Figure 258: Middle East and Africa Market Value (US$ Million) by Country, 2024 to 2034
Figure 259: Middle East and Africa Market Value (US$ Million) Analysis by Country, 2019 to 2034
Figure 260: Middle East and Africa Market Volume (Pairs) Analysis by Country, 2019 to 2034
Figure 261: Middle East and Africa Market Value Share (%) and BPS Analysis by Country, 2024 to 2034
Figure 262: Middle East and Africa Market Y-o-Y Growth (%) Projections by Country, 2024 to 2034
Figure 263: Middle East and Africa Market Value (US$ Million) Analysis by Type, 2019 to 2034
Figure 264: Middle East and Africa Market Volume (Pairs) Analysis by Type, 2019 to 2034
Figure 265: Middle East and Africa Market Value Share (%) and BPS Analysis by Type, 2024 to 2034
Figure 266: Middle East and Africa Market Y-o-Y Growth (%) Projections by Type, 2024 to 2034
Figure 267: Middle East and Africa Market Value (US$ Million) Analysis by Lens Type, 2019 to 2034
Figure 268: Middle East and Africa Market Volume (Pairs) Analysis by Lens Type, 2019 to 2034
Figure 269: Middle East and Africa Market Value Share (%) and BPS Analysis by Lens Type, 2024 to 2034
Figure 270: Middle East and Africa Market Y-o-Y Growth (%) Projections by Lens Type, 2024 to 2034
Figure 271: Middle East and Africa Market Value (US$ Million) Analysis by End Use, 2019 to 2034
Figure 272: Middle East and Africa Market Volume (Pairs) Analysis by End Use, 2019 to 2034
Figure 273: Middle East and Africa Market Value Share (%) and BPS Analysis by End Use, 2024 to 2034
Figure 274: Middle East and Africa Market Y-o-Y Growth (%) Projections by End Use, 2024 to 2034
Figure 275: Middle East and Africa Market Value (US$ Million) Analysis by Consumer Orientation, 2019 to 2034
Figure 276: Middle East and Africa Market Volume (Pairs) Analysis by Consumer Orientation, 2019 to 2034
Figure 277: Middle East and Africa Market Value Share (%) and BPS Analysis by Consumer Orientation, 2024 to 2034
Figure 278: Middle East and Africa Market Y-o-Y Growth (%) Projections by Consumer Orientation, 2024 to 2034
Figure 279: Middle East and Africa Market Value (US$ Million) Analysis by Sales Channel, 2019 to 2034
Figure 280: Middle East and Africa Market Volume (Pairs) Analysis by Sales Channel, 2019 to 2034
Figure 281: Middle East and Africa Market Value Share (%) and BPS Analysis by Sales Channel, 2024 to 2034
Figure 282: Middle East and Africa Market Y-o-Y Growth (%) Projections by Sales Channel, 2024 to 2034
Figure 283: Middle East and Africa Market Attractiveness by Type, 2024 to 2034
Figure 284: Middle East and Africa Market Attractiveness by Lens Type, 2024 to 2034
Figure 285: Middle East and Africa Market Attractiveness by End Use, 2024 to 2034
Figure 286: Middle East and Africa Market Attractiveness by Consumer Orientation, 2024 to 2034
Figure 287: Middle East and Africa Market Attractiveness by Sales Channel, 2024 to 2034
Figure 288: Middle East and Africa Market Attractiveness by Country, 2024 to 2034
The blue light blocking glasses market is estimated to progress at a CAGR of 7.9% through 2034.
The blue light blocking glasses market will likely reach USD 5.98 billion by 2034.
The blue light blocking glasses market will attain a market size of USD 2.79 billion in 2024.
The blue light blocking glasses market's prescription segment will hold 58% of the market share in 2024.
The blue light blocking glasses market's computer users segment will likely secure 41.30% of the market space in 2024.
Explore Similar Insights
Thank you!
You will receive an email from our Business Development Manager. Please be sure to check your SPAM/JUNK folder too.