The blue ceramic abrasive market is valued at USD 498.5 million in 2025 and is expected to reach USD 1,086.2 million by 2035, reflecting a CAGR of 8.1%. From 2021 to 2025, the market grows from USD 337.7 million to USD 498.5 million, with intermediate values of USD 365.0 million, USD 394.6 million, USD 426.6 million, and USD 461.1 million. This early-stage growth is driven by the increasing demand for high-performance abrasives in industries such as automotive, aerospace, and metalworking, where precise finishing and polishing are critical. Blue ceramic abrasives are favored for their durability and efficiency, which boosts their adoption in manufacturing processes requiring exacting standards.
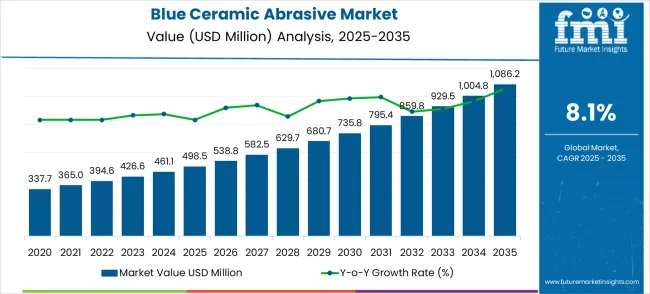
Between 2026 and 2030, the market sees continued expansion, moving from USD 498.5 million to USD 735.8 million, with annual values progressing through USD 538.8 million, 582.5 million, and 629.7 million. This phase marks an acceleration in market growth, driven by advancements in abrasive technology and an increased demand in industries that require fine precision, such as electronics and machinery manufacturing. By 2030, the market is expected to reach USD 795.4 million, driven by technological advancements and increasing industry adoption. From 2031 to 2035, the market continues to strengthen, achieving USD 1,086.2 million, with values advancing from USD 859.8 million to USD 929.5 million and then to USD 1,004.8 million.
| Metric | Value |
|---|---|
| Estimated Value in (2025E) | USD 498.5 million |
| Forecast Value in (2035F) | USD 1,086.2 million |
| Forecast CAGR (2025 to 2035) | 8.1% |
The abrasive materials market contributes about 35-40%, driven by the increasing use of blue ceramic abrasives in grinding, polishing, and surface preparation applications across various industries, including automotive, aerospace, and manufacturing. These abrasives are known for their high hardness, durability, and ability to cut through tough materials. The industrial manufacturing market adds roughly 20-25%, as blue ceramic abrasives are essential in metalworking, glass polishing, and ceramics production, where precision and surface quality are critical.
The automotive market contributes around 15-18%, driven by the demand for high-performance abrasives in vehicle component manufacturing, particularly in the finishing of engine parts, transmission systems, and brake components. The construction and mining market accounts for approximately 10-12%, as blue ceramic abrasives are used in cutting, grinding, and polishing applications for materials like concrete, stone, and metals in the construction and mining industries. The electronics and semiconductor market contributes about 8-10%, with abrasives used for precision polishing and cleaning of semiconductor wafers, components, and circuit boards.
Market expansion is being supported by the increasing demand for high-performance abrasives that deliver superior cutting action and extended operational life compared to conventional aluminum oxide alternatives. Modern manufacturing processes require advanced abrasive materials that can maintain consistent performance while reducing grinding cycle times and improving surface finish quality across demanding applications. Blue ceramic abrasives offer enhanced toughness, self-sharpening characteristics, and thermal stability that enable aggressive material removal while maintaining dimensional accuracy and surface integrity.
The growing focus on precision manufacturing and quality control is driving demand for specialized abrasive materials that enable manufacturers to achieve tight tolerances and superior surface finishes. Rising complexity in aerospace components, automotive precision parts, and medical device manufacturing is contributing to expanded use of blue ceramic abrasives in critical grinding applications. The semiconductor and electronics industries are increasingly requiring ultra-precise surface preparation capabilities that support advanced component manufacturing and assembly processes requiring exceptional material removal control and surface quality consistency.
The market is segmented by grain size, end-use industry, and region. By grain size, the market is divided into coarse grain size (F12-F80), medium grain size (F100-F220), and fine grain size (F230-F800). Based on end-use industry, the market is categorized into aerospace, automobile manufacturing, medical devices, semiconductors, and others. Regionally, the market is divided into North America, Europe, East Asia, South Asia & Pacific, Latin America, and Middle East & Africa.
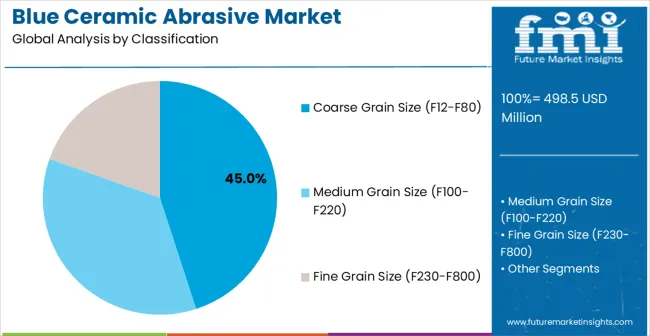
Coarse grain size blue ceramic abrasives (F12-F80) are projected to account for 45% of the market in 2025. This leading share is supported by the widespread use of coarse abrasives in heavy material removal applications including rough grinding, weld preparation, and initial surface conditioning operations. Coarse grain abrasives provide aggressive cutting action and rapid material removal rates that are essential for foundry operations, steel fabrication, and heavy machinery manufacturing. The segment benefits from growing demand in construction equipment manufacturing, shipbuilding, and industrial maintenance applications requiring efficient material removal capabilities.
Manufacturing facilities are increasingly adopting coarse blue ceramic abrasives to improve productivity in heavy grinding operations while reducing wheel wear and replacement frequency. These abrasives feature superior grain retention and self-sharpening characteristics that maintain cutting performance throughout extended grinding cycles. Advanced coarse grain formulations incorporate engineered grain structures and specialized bonding systems that optimize cutting action for specific material types and grinding conditions. The segment growth reflects increasing focus on productivity improvement and operational efficiency in heavy industrial applications requiring aggressive material removal while maintaining operator safety and equipment longevity.
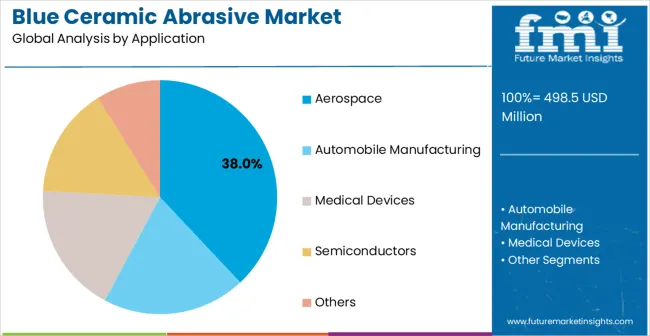
Aerospace applications are expected to represent 38% of blue ceramic abrasive demand in 2025. This dominant share reflects the critical requirements for precision grinding and surface preparation in aerospace component manufacturing and maintenance operations. Modern aerospace production involves complex titanium alloys, nickel-based superalloys, and composite materials that require specialized abrasive technologies for effective machining and finishing. The segment benefits from stringent quality standards, critical safety requirements, and demanding performance specifications that favor advanced ceramic abrasive technologies.
Aerospace manufacturers are expanding their use of blue ceramic abrasives for turbine blade grinding, landing gear component preparation, and structural component finishing operations requiring exceptional surface quality and dimensional accuracy. Engine component manufacturing requires abrasives that can maintain consistent performance while working with heat-resistant alloys and advanced materials used in modern aircraft propulsion systems. Advanced aerospace applications incorporate precision grinding processes that demand abrasives with superior grain toughness, thermal stability, and consistent cutting characteristics throughout extended production runs. The segment expansion reflects growing aircraft production volumes, increasing focus on component performance optimization, and advancing materials technology that requires specialized abrasive solutions for effective processing and quality control operations.
The blue ceramic abrasive market is advancing steadily due to superior performance characteristics compared to conventional abrasives and growing demand for precision surface finishing applications. The market faces challenges, including higher costs compared to aluminum oxide alternatives, a need for specialized application expertise, and varying performance requirements across different material types. Technological advancement efforts and cost optimization initiatives continue to influence product development and market expansion patterns.
The growing implementation of engineered ceramic grain structures and specialized abrasive formulations is enabling improved cutting performance and extended operational life across diverse grinding applications. Advanced grain technologies provide enhanced toughness, improved self-sharpening characteristics, and superior thermal stability that support aggressive material removal while maintaining surface quality standards. These technological advances enable manufacturers to achieve higher productivity levels while reducing abrasive consumption and operational costs in demanding grinding applications.
Abrasive manufacturers are developing advanced application support and process optimization services that help customers maximize blue ceramic abrasive performance while reducing operational costs and improving quality outcomes. Integration of grinding process monitoring, predictive maintenance systems, and comprehensive technical support enables optimized abrasive selection and application parameters that enhance productivity and cost-effectiveness. These service capabilities support broader market adoption by addressing application complexity and ensuring successful implementation across diverse manufacturing environments.
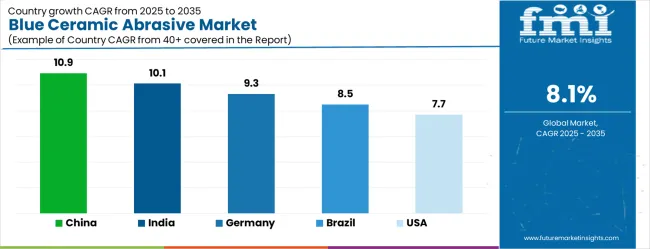
| Country | CAGR (2025-2035) |
|---|---|
| China | 10.9% |
| India | 10.1% |
| Germany | 9.3% |
| Brazil | 8.5% |
| United States | 7.7% |
| United Kingdom | 6.9% |
| Japan | 6.1% |
The blue ceramic abrasive market demonstrates varied growth patterns across key countries, with China leading at a 10.9% CAGR through 2035, driven by massive manufacturing sector expansion, growing aerospace industry development, and increasing adoption of advanced abrasive technologies across diverse industrial applications. India follows at 10.1%, supported by rising manufacturing activities, expanding automotive and aerospace sectors, and growing focus on precision manufacturing capabilities. Germany records 9.3% growth, emphasizing advanced manufacturing excellence, precision engineering requirements, and strong aerospace industry presence. Brazil shows robust growth at 8.5%, driven by expanding industrial sector and increasing adoption of high-performance abrasives. The United States maintains 7.7% growth, focusing on aerospace innovation and advanced manufacturing applications. The United Kingdom demonstrates 6.9% expansion, supported by aerospace and automotive industry requirements. Japan records 6.1% growth, leveraging precision manufacturing expertise and advanced technology development.
The report covers an in-depth analysis of 40+ countries, with top-performing countries highlighted below.
The blue ceramic abrasives market in China is projected to expand at the highest growth rate with a CAGR of 10.9%, driven by comprehensive manufacturing sector development, expanding aerospace industry capabilities, and increasing adoption of advanced abrasive technologies across automotive, machinery, and precision manufacturing applications. The country's strategic focus on manufacturing upgrades includes significant investments in precision grinding equipment, advanced abrasive materials, and comprehensive quality control systems that require high-performance blue ceramic abrasives. Major manufacturing companies and aerospace facilities are implementing sophisticated grinding technologies to improve surface quality and operational efficiency while meeting growing domestic and international demand for precision components.
Revenue from blue ceramic abrasives in India is projected to grow at a CAGR of 10.1%, supported by expanding manufacturing industries, growing automotive and aerospace sectors, and increasing adoption of precision grinding technologies across diverse applications. The country's focus on manufacturing development and industrial modernization is driving demand for high-performance abrasive materials that support component quality, process efficiency, and competitive manufacturing capabilities. Government programs promoting aerospace development and automotive manufacturing are creating favorable conditions for advanced abrasive adoption across precision manufacturing and quality control applications. Educational initiatives and technical training programs are developing workforce capabilities that support sophisticated abrasive technologies and grinding process optimization.
Demand for blue ceramic abrasives in Germany is projected to expand at a CAGR of 9.3%, supported by the country's leadership in precision engineering, advanced manufacturing capabilities, and comprehensive quality management systems across aerospace, automotive, and machinery sectors. German manufacturers and grinding facilities are implementing sophisticated abrasive solutions that meet stringent quality standards while supporting advanced manufacturing operations and precision component production requirements. The country's extensive aerospace and automotive industries are driving significant blue ceramic abrasive demand for precision grinding and surface preparation operations. Advanced engineering partnerships are facilitating technology development and application optimization across abrasive manufacturing and precision grinding sectors.
The blue ceramic abrasives market in Brazil is anticipated to grow at a CAGR of 8.5%, driven by expanding manufacturing industries, growing automotive sector, and increasing adoption of advanced grinding technologies across diverse applications. Brazilian manufacturers and grinding facilities are investing in high-performance abrasive solutions to enhance productivity and quality while supporting domestic industrial development and export competitiveness. Government programs supporting industrial modernization are facilitating access to advanced abrasive technologies and technical expertise. Regional manufacturing centers are developing specialized capabilities that support blue ceramic abrasive distribution and technical support across diverse geographic markets. Economic development initiatives are creating opportunities for both industrial and precision manufacturing abrasive adoption across expanding automotive and machinery sectors.
The sale of blue ceramic abrasives in the United States is expected to expand at a CAGR of 7.7%, driven by aerospace industry leadership, advanced manufacturing applications, and ongoing technology development initiatives across defense, commercial aviation, and precision manufacturing sectors. American manufacturers and aerospace facilities are implementing sophisticated abrasive solutions to maintain manufacturing excellence and competitive advantages while supporting diverse precision grinding and surface preparation applications. The aerospace and defense industries are driving significant blue ceramic abrasive demand for component manufacturing, maintenance operations, and advanced materials processing requirements. Government initiatives supporting aerospace innovation are creating opportunities for advanced abrasive technology development and application optimization.
Demand for blue ceramic abrasives in the United Kingdom is projected to grow at a CAGR of 6.9%, supported by strong aerospace and automotive industries, expanding precision manufacturing capabilities, and increasing quality control requirements across diverse applications. British manufacturers and aerospace facilities are investing in advanced abrasive solutions to support precision component manufacturing, quality assurance operations, and certification compliance requirements. The country's established aerospace sector is facilitating blue ceramic abrasive adoption through comprehensive quality standards and precision manufacturing requirements. Advanced manufacturing initiatives and technology development programs are creating demand for high-performance abrasives that enable manufacturers to meet stringent quality and performance standards.
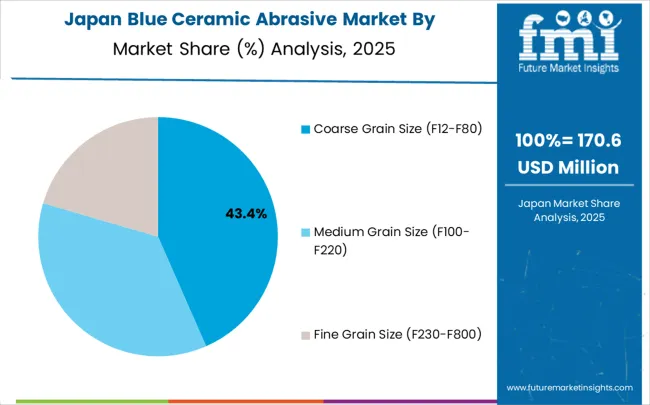
Revenue from blue ceramic abrasives in Japan is projected to grow at a CAGR of 6.1%, supported by precision manufacturing expertise, technological innovation capabilities, and focus on quality excellence across automotive, electronics, and machinery sectors. Japanese manufacturers and grinding facilities are implementing sophisticated abrasive solutions that demonstrate superior performance characteristics while supporting diverse precision manufacturing applications requiring accuracy and reliability. The country's advanced automotive and electronics manufacturing sectors are driving demand for high-quality blue ceramic abrasives that support precision operations and comprehensive quality management systems. Technology development principles and continuous improvement programs are driving adoption of abrasive materials that enhance operational excellence and manufacturing precision across diverse applications.
The blue ceramic abrasive market in Europe is projected to grow from USD 134.7 million in 2025 to USD 293.1 million by 2035, registering a CAGR of 8% over the forecast period. Germany is expected to maintain its leadership with 34.2% market share in 2025, projected to grow to 34.8% by 2035, supported by its strong aerospace and automotive industries, advanced manufacturing capabilities, and comprehensive precision grinding requirements. France follows with 18.5% market share in 2025, expected to reach 18.8% by 2035, driven by aerospace manufacturing activities and precision engineering applications.
The Rest of Europe region is projected to maintain stable share at 16.8% throughout the forecast period, attributed to growing manufacturing activities in Eastern European countries and expanding precision grinding requirements. United Kingdom contributes 15.2% in 2025, projected to reach 15.0% by 2035, supported by strong aerospace and automotive industries. Italy maintains 15.3% share in 2025, expected to grow to 15.6% by 2035, while other European countries demonstrate steady growth patterns reflecting regional manufacturing development and advanced abrasive adoption trends.
The blue ceramic abrasive market is characterized by competition among established abrasive manufacturers, specialized ceramic technology providers, and advanced materials companies. Companies are investing in ceramic grain technology development, manufacturing process optimization, application engineering support, and comprehensive product portfolios to deliver superior grinding performance and cost-effective solutions. Strategic partnerships, technological innovation, and market expansion initiatives are central to strengthening product offerings and market presence.
3M, United States-based, offers comprehensive blue ceramic abrasive solutions with focus on performance, innovation, and application engineering support across diverse industrial grinding applications. DRAGON ABRASIVES, China, provides specialized ceramic abrasive technologies emphasizing manufacturing scale, cost competitiveness, and regional market development. Resonac, Japan, delivers advanced ceramic abrasive materials with focus on precision, quality, and technological excellence for demanding applications.
BINIC, China, emphasizes cost-effective blue ceramic abrasive production with focus on volume manufacturing and competitive pricing strategies. YUANDONG provides specialized abrasive solutions with focus on application-specific formulations and technical support services. Other key players including Binic, Niceabrasive, Zibo Bingyang Abrasives Co., Ltd., United Abrasives, and RUNBAO contribute specialized expertise and diverse product offerings across global and regional markets.
Blue ceramic abrasive represents a premium segment within the industrial abrasives market, characterized by superior hardness, thermal stability, and consistent performance across demanding applications. With the market valued at $498.5 million and projected to reach $1,086.2 million by 2030 at an 8% CAGR, blue ceramic abrasives are becoming essential for precision manufacturing in aerospace, automotive, medical devices, and semiconductor industries. Success in this market requires coordinated efforts across equipment manufacturers, raw material suppliers, end-user industries, and regulatory bodies.
How Governments Could Accelerate Industrial Competitiveness?
Advanced Manufacturing Incentives: Establish tax credits and grants for companies adopting precision abrasive technologies in strategic sectors like aerospace and semiconductors, particularly in high-growth markets like China (10.9% market share) and India (10.1%).
Technical Standards Development: Collaborate with industry bodies to develop national standards for ceramic abrasive performance metrics, ensuring consistent quality benchmarks that support export competitiveness and import substitution strategies.
Research Infrastructure: Fund specialized testing facilities and R&D centers focused on advanced ceramic materials, particularly in Germany (9.3% market share) and Japan (6.1%) where precision manufacturing expertise already exists.
Supply Chain Resilience: Implement strategic material stockpiling programs and diversify raw material sourcing to reduce dependency on single-source suppliers, especially for critical applications in defense and aerospace.
Workforce Development: Create specialized training programs for precision grinding and finishing techniques, addressing the skills gap in operating advanced ceramic abrasive systems across different grain sizes and applications.
How Industry Bodies Could Strengthen Market Standards?
Performance Standardization: Develop unified grading systems for coarse (F12-F80), medium (F100-F220), and fine (F230-F800) grain sizes that enable reliable performance comparisons across suppliers like 3M, DRAGON ABRASIVES, and Resonac.
Application Guidelines: Create technical handbooks for optimal ceramic abrasive selection across end-use industries - from aerospace titanium machining to semiconductor wafer processing - reducing trial-and-error costs for manufacturers.
Quality Certification Programs: Establish third-party certification for blue ceramic abrasive performance in critical applications, particularly for medical device manufacturing where consistency and traceability are paramount.
Market Intelligence: Develop comprehensive databases tracking performance benchmarks, cost structures, and emerging applications to help smaller players like BINIC and YUANDONG compete effectively with established leaders.
Environmental Frameworks: Create lifecycle assessment standards for ceramic abrasive production and disposal, addressing ecological concerns while maintaining performance requirements.
How OEMs and Processing Equipment Manufacturers Could Enable Growth?
Precision Grinding Systems: Develop specialized equipment optimized for blue ceramic abrasives' unique properties, including variable speed controls and advanced coolant systems that maximize abrasive life and surface finish quality.
Automation Integration: Incorporate smart sensors and AI-driven controls that automatically adjust grinding parameters based on workpiece material, abrasive wear, and desired surface finish across different grain sizes.
Modular Solutions: Design scalable grinding systems that accommodate both high-volume automotive applications and precision aerospace work, allowing manufacturers to optimize equipment utilization across diverse requirements.
Predictive Maintenance: Integrate IoT capabilities that monitor abrasive performance in real-time, predicting optimal replacement intervals and reducing unplanned downtime in critical manufacturing operations.
Training and Support: Provide comprehensive technical support including application engineering, process optimization, and operator training to ensure maximum performance from ceramic abrasive investments.
How Suppliers Could Navigate Competitive Dynamics?
Product Differentiation: Develop specialized ceramic abrasive formulations for specific applications - ultra-fine grades for semiconductor polishing, heat-resistant variants for aerospace alloys, and biocompatible options for medical device manufacturing.
Geographic Expansion: Leverage strong positions in key markets (China's 10.9% dominance, growing opportunities in Brazil's 8.5% and UK's 6.9% markets) to establish regional distribution networks and technical support centers.
Partnership Strategies: Form strategic alliances with equipment manufacturers and end-users to co-develop application-specific solutions, particularly in high-growth sectors like semiconductors and medical devices.
Supply Chain Optimization: Invest in vertical integration or long-term supplier agreements for critical raw materials, ensuring consistent quality while managing cost pressures in a competitive market.
Technical Services: Expand beyond product supply to offer comprehensive grinding solutions including process optimization, training, and performance guarantees that create switching costs for customers.
How Investors and Financial Enablers Could Capture Value?
Technology Investment: Fund R&D initiatives focused on next-generation ceramic abrasive chemistry, particularly for emerging applications in advanced semiconductors and additive manufacturing post-processing.
Market Consolidation: Support strategic acquisitions that combine regional players (like Zibo Bingyang Abrasives, United Abrasives, and RUNBAO) to achieve scale advantages against global leaders like 3M and Resonac.
Manufacturing Expansion: Finance production capacity expansion in high-growth regions, particularly in Asia-Pacific markets where industrial manufacturing growth is driving demand across all grain size categories.
Digital Transformation: Invest in companies developing smart abrasive systems with embedded sensors and data analytics that optimize performance and create recurring revenue opportunities through data services.
Environmental Innovation: Support the development of eco-friendly ceramic abrasive production processes and recycling technologies that address growing regulatory pressure while maintaining performance standards.
| Item | Value |
|---|---|
| Quantitative Units (2025) | USD 498.5 million |
| Grain Size | Coarse Grain Size (F12-F80), Medium Grain Size (F100-F220), Fine Grain Size (F230-F800) |
| End-Use Industry | Aerospace, Automobile Manufacturing, Medical Devices, Semiconductors, and Others |
| Regions Covered | North America, Europe, East Asia, South Asia & Pacific, Latin America, Middle East & Africa |
| Countries Covered | United States, Canada, United Kingdom, Germany, France, China, Japan, South Korea, India, Brazil, Australia and 40+ countries |
| Key Companies Profiled | 3M, DRAGON ABRASIVES, Resonac, BINIC, YUANDONG, Binic, Niceabrasive, Zibo Bingyang Abrasives Co., Ltd., United Abrasives, RUNBAO |
| Additional Attributes | Dollar sales by grain size and end-use industry segments, regional demand trends across North America, Europe, and Asia-Pacific, competitive landscape with established abrasive manufacturers and specialized ceramic technology providers, buyer preferences for different grain sizes and abrasive formulations, integration with advanced grinding systems and precision manufacturing processes, innovations in ceramic grain technology and surface treatment capabilities, and adoption of smart grinding solutions and process optimization systems for enhanced performance and operational efficiency |
The global grating indicator calibrator market is estimated to be valued at USD 395.4 million in 2025.
The market size for the grating indicator calibrator market is projected to reach USD 675.4 million by 2035.
The grating indicator calibrator market is expected to grow at a 5.5% CAGR between 2025 and 2035.
The key product types in grating indicator calibrator market are fully automatic, semi-automatic and manual.
In terms of application, metrology and testing segment to command 42.0% share in the grating indicator calibrator market in 2025.


Our Research Products

The "Full Research Suite" delivers actionable market intel, deep dives on markets or technologies, so clients act faster, cut risk, and unlock growth.

The Leaderboard benchmarks and ranks top vendors, classifying them as Established Leaders, Leading Challengers, or Disruptors & Challengers.

Locates where complements amplify value and substitutes erode it, forecasting net impact by horizon

We deliver granular, decision-grade intel: market sizing, 5-year forecasts, pricing, adoption, usage, revenue, and operational KPIs—plus competitor tracking, regulation, and value chains—across 60 countries broadly.

Spot the shifts before they hit your P&L. We track inflection points, adoption curves, pricing moves, and ecosystem plays to show where demand is heading, why it is changing, and what to do next across high-growth markets and disruptive tech

Real-time reads of user behavior. We track shifting priorities, perceptions of today’s and next-gen services, and provider experience, then pace how fast tech moves from trial to adoption, blending buyer, consumer, and channel inputs with social signals (#WhySwitch, #UX).

Partner with our analyst team to build a custom report designed around your business priorities. From analysing market trends to assessing competitors or crafting bespoke datasets, we tailor insights to your needs.
Supplier Intelligence
Discovery & Profiling
Capacity & Footprint
Performance & Risk
Compliance & Governance
Commercial Readiness
Who Supplies Whom
Scorecards & Shortlists
Playbooks & Docs
Category Intelligence
Definition & Scope
Demand & Use Cases
Cost Drivers
Market Structure
Supply Chain Map
Trade & Policy
Operating Norms
Deliverables
Buyer Intelligence
Account Basics
Spend & Scope
Procurement Model
Vendor Requirements
Terms & Policies
Entry Strategy
Pain Points & Triggers
Outputs
Pricing Analysis
Benchmarks
Trends
Should-Cost
Indexation
Landed Cost
Commercial Terms
Deliverables
Brand Analysis
Positioning & Value Prop
Share & Presence
Customer Evidence
Go-to-Market
Digital & Reputation
Compliance & Trust
KPIs & Gaps
Outputs
Full Research Suite comprises of:
Market outlook & trends analysis
Interviews & case studies
Strategic recommendations
Vendor profiles & capabilities analysis
5-year forecasts
8 regions and 60+ country-level data splits
Market segment data splits
12 months of continuous data updates
DELIVERED AS:
PDF EXCEL ONLINE
Ceramic to Metal Assemblies Market Size and Share Forecast Outlook 2025 to 2035
Blue Light Protection Ingredient Market Size and Share Forecast Outlook 2025 to 2035
Abrasive Market Forecast and Outlook 2025 to 2035
Ceramic Textile Market Size and Share Forecast Outlook 2025 to 2035
Ceramic and Porcelain Tableware Market Size and Share Forecast Outlook 2025 to 2035
Blue Light Protection Skincare Market Size and Share Forecast Outlook 2025 to 2035
Blue Light Blocking Glasses Market Size and Share Forecast Outlook 2025 to 2035
Ceramic Matrix Composites Market Size and Share Forecast Outlook 2025 to 2035
Ceramic Frit Market Size and Share Forecast Outlook 2025 to 2035
Ceramic Substrates Market Size and Share Forecast Outlook 2025 to 2035
Blueberry Extract Antioxidants Market Size and Share Forecast Outlook 2025 to 2035
Bluetooth Photo Capture Device Market Size and Share Forecast Outlook 2025 to 2035
Blue Hydrogen Market Size and Share Forecast Outlook 2025 to 2035
Ceramic 3D Printing Market Size and Share Forecast Outlook 2025 to 2035
Ceramic Injection Molding Market Size and Share Forecast Outlook 2025 to 2035
Ceramic Tableware Market Size and Share Forecast Outlook 2025 to 2035
Ceramic Paper Market Size and Share Forecast Outlook 2025 to 2035
Ceramic Balls Market Size and Share Forecast Outlook 2025 to 2035
Ceramic Tester Market Size and Share Forecast Outlook 2025 to 2035
Ceramic Membranes Market Analysis - Size, Share and Forecast Outlook 2025 to 2035

Thank you!
You will receive an email from our Business Development Manager. Please be sure to check your SPAM/JUNK folder too.
Chat With
MaRIA