Blue Light Protection Ingredient Market Outlook for 2024 to 2034

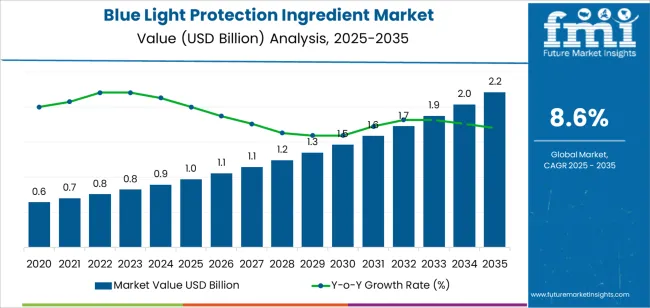
The blue light protection ingredient market is expected to reach US$ 890.9 million in 2024 due to the rising use of smartphones and awareness about the harmful effects of blue light. The market is predicted to develop at a CAGR of 8.6% during the forecast period and reach a valuation of US$ 2.02 billion by 2034.

Consumption Analysis of the Blue Light Protection Ingredient Market

  • The market ingredient is rapidly expanding as botanical ingredients, like ginger, pomegranate, noni fruits, and carrot root, are gaining traction. These are getting popular due to their ability to safeguard against harmful blue light. These ingredients contain active compounds that shield the skin from blue light-induced damage.
  • Blue-light protection ingredient producers have created revolutionary anti-blue light solutions for multiple skin and cosmetic care products, including primers, serums, and facial gels. This has resulted in increased global sales of blue light protection components.
  • The cosmetic and personal care sector also increasingly demands devices featuring blue-light protection ingredients to cure skin-related diseases, including redness, dark spots, skin aging, and wrinkles, developing a novel consumer base for blue light defense ingredients.
  • The escalating usage of electronic devices such as tablets, smartphones, computers, and laptops has led to an upsurge in the requirement for blue-light protection ingredients globally.
  • The blue light protection ingredient market is expanding due to rising social media platforms, advertising strategies, research and development activities, novel formulations, and innovation in affordable and conventional products, particularly in the health and wellness as well as cosmetics sectors.
Attributes Details
Blue Light Protection Ingredient Market Value for 2024 US$ 890.9 million
Blue Light Protection Ingredient Market Value for 2034 US$ 2.02 billion
Blue Light Protection Ingredient Market Forecast CAGR for 2024 to 2034 8.6%

Don't pay for what you don't need

Customize your report by selecting specific countries or regions and save 30%!

Historical Performance and Future Growth of the Blue Light Protection Ingredient Market

This study examines the blue light protection ingredient market's growth over the past five years, revealing a historical CAGR of 6.4% and a projected 8.6% CAGR growth up to 2034, indicating a growing trend in the blue light protection ingredient market.

Attributes Details
Blue Light Protection Ingredient Market Historical CAGR for 2019 to 2023 6.4%

The market for blue-light protection ingredients in cosmetic and skin care products is anticipated to face several challenges during the forecast period due to high costs, a lack of raw materials, and supply chain issues. Additionally, shifting preferences in makeup and emergency health services have limited the global market expansion.

Critical aspects that are anticipated to influence the demand for blue light protection ingredients through 2034.

  • The blue light protection ingredient market is experiencing growth due to rising consumer awareness, demand for blue light-protective skincare and cosmetic products, as well as advancements in ingredient technologies.
  • The expanding use of digital devices, especially in emerging areas, has untapped potential, and creative product offerings can result from partnerships between skincare brands and technology enterprises.
  • The blue light protection ingredient market's development prospects are further enhanced by creating customized blue light protection chemicals and formulations that cater to certain customer demands.
  • The blue light protection ingredient manufacturers are expected to experience significant opportunities due to increased smartphone usage, technological advancements, and research expenditures.

Market players are going to desire to be prudent and flexible over the anticipated period since these challenging attributes position the industry for accomplishment in subsequent decade.

Key Trends Influencing the Blue Light Protection Ingredient Market

Amplified Usage of Smart Gadgets Skyrockets the Blue Light Protection Ingredient Market

The rise in popularity of smart devices, such as smartphones, tablets, and personal computers, has led to increased exposure to blue light, causing health and skin issues. As people spend more time on their smartphones, concerns about the impact on their skin health and attractiveness have grown.

Expansion of technological gadgets this has led to an increased demand for blue light-protecting chemicals. As people become aware of the harmful effects of blue light on their skin and eyes, the number of blue light-protecting ingredient is expanding forming the anti-blue light ingredient market.

As more research is conducted on the effects of blue light exposure, the demand for protective goods is expected to continue to rise. Many people experience adverse health impacts, including difficulty sleeping and skin damage. Thus, this is expected to develope elevated demand for the blue light shield ingredients in the forthcoming decade.

Global Populace Demand for the Organic Ingredient

Prolonged exposure to blue light from the sun or electronic devices like smartphones, laptops, and other gadgets can lead to premature aging, wrinkles, dryness, and other skin issues. Producers of blue light protection components are likelier to employ organic raw materials when producing blue light skincare additives. The manufacturers utilize natural alternatives for zinc oxide, titanium dioxide, and iron oxide in their blue light products.

The consumers in the blue light protection ingredient market expect to have more natural, glowing, and radiant skin, so market players offer more expensive organic blue light defense ingredients.

For the protection of the skin and youthful appearance, patrons in the blue light defense ingredient market opt for expensive blue light protection ingredient, following the trends in the blue light protection ingredient market.

Growing Cosmetic Industry Boosts the Demand for the Blue Light Shield Ingredient

The cosmetics and personal care industries are rapidly changing, with companies sourcing natural materials and creating high demand for blue light protection ingredients, highlighting the growing integration of natural components.

The increasing demand for natural personal care products with minimal chemicals and harmful pollutants has led to a surge in demand for blue light protection ingredients. This, thereby, boosts consumer demand for blue light protection formulations.

The cosmetics industry has been exploring the potential benefits of blue light skincare chemicals in treating various skin conditions. The effectiveness of these substances in refining the skin's appearance and reducing sunspots has led to their inclusion in multiple types of face masks and serums.

Blue light skincare products have gained significant traction in the beauty sector and are now considered essential to any effective skincare regimen, developing the demand for blue light skincare solutions.

Sudip Saha
Sudip Saha

Principal Consultant

Talk to Analyst

Find your sweet spots for generating winning opportunities in this market.

Category-wise Insights

This section offers in-depth analyses of particular blue light protection ingredient market sectors. The two main topics of the research are the segment with the solid or semi-solid form and the cosmetic products as the application segment. Through a comprehensive examination, this section attempts to provide a fuller knowledge of these segments and their relevance in the larger context of the blue light protection ingredient market.

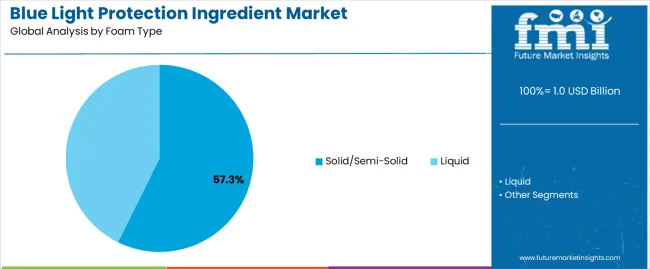
Solid or Semi-solid Form of the Blue Light Protection Ingredient Shields 64.30% of Market Share

Attributes Details
Top Form Type Solid or Semi-solid
Market share in 2024 64.30%

The demand for solid or semi-solid form of the blue light protection ingredient is projected to witness a significant demand, holding a market share of 64.30% in 2024. The following aspects display the aspects supporting the development of solid and semi-solid blue light protection ingredients:

  • Solid or semi-solid blue-light protection ingredients, such as zinc oxide, dominate the global demand in terms of the form of blue-light protection ingredients.
  • Solid or semi-solid ingredients are more convenient for skin care and cosmetic products as they offer excellent protection against blue light and UV rays at a reasonable price.
  • Cosmetics manufacturers prefer solid/semi-solid ingredients because they simplify the production cycle for their skincare and cosmetic products, such as blue-light protection body lotions and creams.
  • Solid and semi-solid components, such as zinc oxide, are cost-effective and offer excellent UV and blue light protection, developing the high demand from the blue light skincare market.

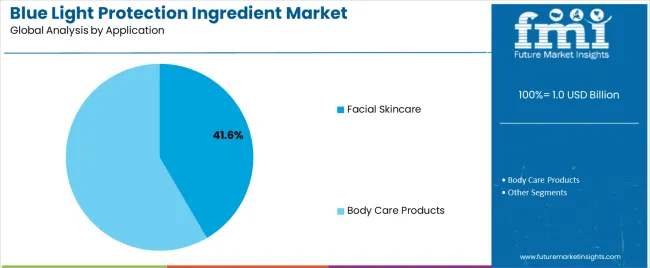
Cosmetic Products Develops a 39.80% Market Share by the Application of the Blue Light Protection Ingredient

Attributes Details
Top Application Cosmetic Products
Market share in 2024 39.80%

The cosmetic products infused with blue light protection ingredients is set to acquire a 39.80% market share in 2024. Factors backing up the development of blue light protection cosmetics include:

  • The cosmetic products segment is currently the most significant contributor to the beauty and personal care industry, and it is expected to continue growing during the forecast period.
  • The cosmetic products segment includes various products such as creams, serums, and moisturizers, which are primarily used for enhancing the appearance of the skin.
  • Manufacturers of blue light protection ingredient have reported a steady demand for cosmetic products. These ingredient are essential as they protect against the harmful blue light emitted from electronic devices that can cause skin damage.
  • Due to the high demand for such products, cosmetic manufacturers focus on strengthening their foothold in the anti-aging skincare market by infusing blue light protection ingredients.
  • In contrast to regular skincare products, anti-aging skincare products are designed to target wrinkles, fine lines, and other signs of aging, making them a popular choice among consumers.

Country-wise Insights

This section anticipates examining the markets for blue light protection ingredient in some of the most important countries on the global stage, such as the United States, China, India, Japan, and the United Kingdom. Through in-depth research, explore the several aspects influencing these nations' acceptability and demand for blue light skincare products.

Countries CAGR from 2024 to 2034
United States 4.9%
United Kingdom 5.6%
China 8.6%
Japan 11.0%
India 17.4%

Demand for the Blue Light Defense Ingredient Ripens in the United States

The United States beauty and cosmetic sector is developing the demand for blue light protection ingredients with a CAGR of 4.9% from 2024 to 2034. Here are a few of the key trends:

  • The United States has emerged as a highly lucrative market for blue light protection ingredients among North American countries.
  • The surge in the United States can be attributed to the widespread use of technological devices that emit blue light. This is leading to a rise in demand for blue light protection ingredients across various sectors.
  • Skin cancer is a major concern in the United States, with the highest number of cases reported in the country. As per the American Academy of Dermatology (AAD), skin cancer is the most commonly occurring cancer in the United States.
  • More than two people die due to skin cancer every hour in the United States, further intensifying the demand for blue light protection ingredients.

Consumers in the United Kingdom Demand Organic Blue Light Protection Ingredients

Demand for blue light protection ingredients in the United Kingdom is expected to develop at a CAGR of 5.6%. The following factors are propelling the demand for organic blue light protection ingredients:

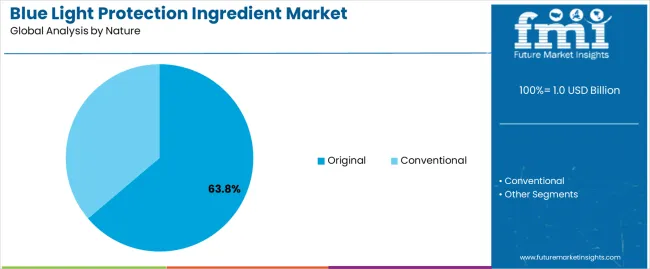
  • In the United Kingdom, the organic blue light protection ingredients are the highest contributor to the market and are expected to grow during the forthcoming decade.
  • The demand for standard components remains high in the United Kingdom because of the blue light protection ingredient's high antioxidant and UVB absorption qualities.
  • The United Kingdom's shoppers are increasingly aware of the health benefits of organic ingredients, and the demand for organic blue light protection compounds has increased rapidly in recent years.

Rising Skin Conditions Drive the Demand for Blue Light Protection Ingredients in China

China has witnessed an increasing number of skin diseases, and the demand for blue light protection ingredients is predicted to extend at a CAGR of 8.6% between 2024 and 2034. Some of the primary trends in the industry are:

  • The World Health Organization (WHO) 2018 research states that 0.08% of all fatalities in China were attributable to skin diseases. Over the past decade, there has been a steady rise in the prevalence of dry skin illnesses, dermatitis, allergic skin diseases, and other skin conditions.
  • China’s dermatologists have been researching and developing blue light-blocking compounds to treat various skin diseases, including cancer, infections, and allergies.
  • China's huge population drives the need for natural blue light protection mixtures to treat skin problems, and the country's many provinces contribute to the development of the need for blue light protection ingredients.

Indian Industrialists are Increasingly Integrating Ingredients of Blue Light Protection

The demand for blue light protection ingredients in India is expected to register a CAGR of 17.4% from 2024 to 2034. Some of the primary trends are:

  • India's well-established skincare sector and the growth in investments in the cosmetics industry are the main drivers of sales for blue light protection chemicals in India.
  • Recently, India has experienced a significant surge in the usage of blue-light-blocking chemicals due to the increased acceptance of preventative skin care practices.
  • Indian cosmetic producers have been enhancing the blue light-blocking components in their products by using Ayurvedic remedies.
  • India's extensive Ayurvedic knowledge has significantly influenced product innovation, formulation, packaging techniques, and marketing of blue light protection products, providing greater opportunities for ingredient manufacturers and suppliers in India.

The Cosmetics Industry in Japan Hits the Roof in the Blue Light Protection Ingredient Demand

The blue light protection ingredient industry in Japan is expected to register a CAGR of 11.0% by 2034. Among the primary drivers are:

  • Japan's cosmetics industry is gaining traction, attracting manufacturers of blue-light protection ingredients, thereby boosting the demand for blue-light protection products in East Asia.
  • Japan's cosmetics market is dominated by skin care goods, which increases the need for chemicals that guard against blue light when creating skincare and cosmetic products.
  • The growth of eCommerce platforms specializing in cosmetics and increased internet penetration are anticipated to drive Japan's blue light protection ingredient market.

Get the data you need at a Fraction of the cost

Personalize your report by choosing insights you need
and save 40%!

Market players Shaping the Outlook of the Global Blue Light Protection Ingredient Market

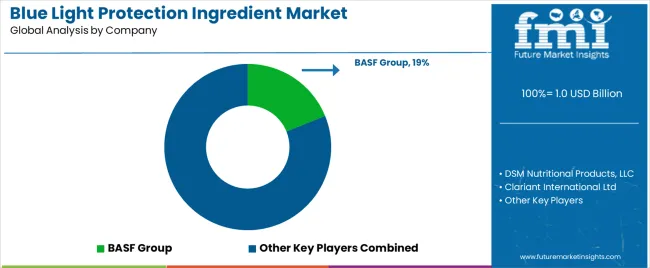
The market remains highly fragmented, with numerous players vying for market share. However, despite the intense competition, product quality and safety remain top priorities for consumers. As the shift toward organic and natural products continues to gain momentum, ingredient manufacturers are diversifying their offerings or launching new units dedicated to organic production to meet this growing demand.

Market players focus on boosting their social media presence and investing in effective advertising tactics to increase customer awareness of their products. Additionally, expansion initiatives play a significant role in various businesses' strategies. By participating in such events, companies can increase their customer base and more easily adapt to the rising demand for blue light protection ingredients.

Looking ahead, players in the blue light protection ingredient market are actively developing their businesses in the forthcoming decade through strategic alliances, product innovations, partnerships, research and development, and targeted marketing campaigns. By adopting these measures, companies strive to stay ahead of the curve and establish themselves as key players in this highly competitive industry.

Recent Developments in the Blue Light Protection Ingredient Market
  • In October 2023, Symrise AG increased its stake in United States pigment and powder specialist Kobo Products Inc. to 49%, providing innovative raw materials for the cosmetics industry. The deal began in 2021 and is anticipated to expand capacity and enhance the supply chain, benefiting mineral UV filters and decorative cosmetics companies.
  • In September 2023, IBG Brand Incubator launched a blue light-blocking cosmetics line named Screensaver at Walmart. The line is designed to protect the skin from the harmful effects of digital devices. The nine-product line includes primer, eyeshadow, blush, highlighter, and lip gloss.
  • In February 2022, India's first Gen-Z skincare brand, FABBEU, launched a Blue Light Protection Cream to protect users from blue light and digital pollution. The startup uses AI-based skin analysis to recommend ideal products for Gen-Z customers.

Key Companies in the Blue Light Protection Ingredient Market

  • DSM Nutritional Products, LLC
  • Clariant International Ltd
  • RAHN AG
  • BASF Group
  • Croda International Plc
  • Ashland Global Specialty Chemicals Inc.
  • Kobo Products, Inc.
  • Evonik Industries
  • Lonza Group
  • SkinCeuticals International
  • Solara Suncare Inc.
  • Skinbetter Science LLC
  • Galactic Beauty LLC
  • ISDIN S.A.
  • EltaMD Inc.
  • COOLA LLC.

Key Coverage in the Blue Light Protection Ingredient Market Report

  • Sales Assessment of the Radiation Protection Apparels Market from 2024 to 2034
  • Growth Analysis of the Global Active Protection System Market in 2024
  • Top 10 Blue Light Beauty Products in the Market
  • Opportunity Analysis of the Global Blue Light Protection Ingredient Market Scenario
  • In-depth Assessment of Blue Light Protection Ingredient Market Research Report Forecast
  • Emerging Consumer Demand for Blue Light Protection Formulations in the United States

Key Segments

By Foam Type:

  • Solid/Semi-solid
  • Liquid

By Nature:

  • Original
  • Conventional

By Application:

  • Facial Skincare
    • Facial Creams & Moisturizer
    • Serums
    • Facial Gels/Oils
    • Others
  • Body Care Products
    • Cosmetic Products
    • Foundations
    • Primers & Concealers
    • Others

By Region:

  • North America
  • Latin America
  • Europe
  • East Asia
  • South Asia
  • Oceania
  • Middle East and Africa

Frequently Asked Questions

How Big is the Blue Light Protection Ingredient Market?

The blue light protection ingredient market is set to be valued at US$ 890.9 million in 2024.

What is the Demand Forecast for Blue Light Protection Ingredients?

By 2034, the blue light protection ingredient market is anticipated to be valued at US$ 2.02 billion.

What Ingredient Protects Against Blue Light?

Ingredients such as zinc oxide, titanium dioxide, and iron oxide are in demand in the blue light protection ingredient industry.

What is the Growth Potential of the Blue Light Protection Ingredient Market?

The market is anticipated to expand at a CAGR of 8.6% from 2024 to 2034.

Which Application of the Blue Light Protection Ingredient has High Demand?

The demand for blue light protection ingredients in cosmetic products dominates the market, with a market share of 39.80% in 2024.

Table of Content
1. Executive Summary
    1.1. Global Market Outlook
    1.2. Demand-side Trends
    1.3. Supply-side Trends
    1.4. Technology Roadmap Analysis
    1.5. Analysis and Recommendations
2. Market Overview
    2.1. Market Coverage / Taxonomy
    2.2. Market Definition / Scope / Limitations
3. Market Background
    3.1. Market Dynamics
        3.1.1. Drivers
        3.1.2. Restraints
        3.1.3. Opportunity
        3.1.4. Trends
    3.2. Scenario Forecast
        3.2.1. Demand in Optimistic Scenario
        3.2.2. Demand in Likely Scenario
        3.2.3. Demand in Conservative Scenario
    3.3. Opportunity Map Analysis
    3.4. Product Life Cycle Analysis
    3.5. Supply Chain Analysis
        3.5.1. Supply Side Participants and their Roles
            3.5.1.1. Manufacturer
            3.5.1.2. Mid-Level Participants (Traders)
            3.5.1.3. Distributors
        3.5.2. Value Added and Value Created at Node in the Supply Chain
        3.5.3. List of Raw Material Suppliers
        3.5.4. List of Existing and Potential Buyer’s
    3.6. Investment Feasibility Matrix
    3.7. Value Chain Analysis
        3.7.1. Profit Margin Analysis
        3.7.2. Distributors
    3.8. PESTLE and Porter’s Analysis
    3.9. Regulatory Landscape
        3.9.1. By Key Regions
        3.9.2. By Key Countries
    3.10. Regional Parent Market Outlook
    3.11. Production and Consumption Statistics
    3.12. Import and Export Statistics
4. Global Market Analysis 2019 to 2023 and Forecast, 2024 to 2034
    4.1. Historical Market Size Value (US$ Million) & Volume (Tons) Analysis, 2019 to 2023
    4.2. Current and Future Market Size Value (US$ Million) & Volume (Tons) Projections, 2024 to 2034
        4.2.1. Y-o-Y Growth Trend Analysis
        4.2.2. Absolute $ Opportunity Analysis
5. Global Market Analysis 2019 to 2023 and Forecast 2024 to 2034, By Form Type
    5.1. Introduction / Key Findings
    5.2. Historical Market Size Value (US$ Million) & Volume (Tons) Analysis By Form Type, 2019 to 2023
    5.3. Current and Future Market Size Value (US$ Million) & Volume (Tons) Analysis and Forecast By Form Type, 2024 to 2034
        5.3.1. Solid/Semi-Solid
        5.3.2. Liquid
    5.4. Y-o-Y Growth Trend Analysis By Form Type, 2019 to 2023
    5.5. Absolute $ Opportunity Analysis By Form Type, 2024 to 2034
6. Global Market Analysis 2019 to 2023 and Forecast 2024 to 2034, By Nature
    6.1. Introduction / Key Findings
    6.2. Historical Market Size Value (US$ Million) & Volume (Tons) Analysis By Nature, 2019 to 2023
    6.3. Current and Future Market Size Value (US$ Million) & Volume (Tons) Analysis and Forecast By Nature, 2024 to 2034
        6.3.1. Original
        6.3.2. Conventional
    6.4. Y-o-Y Growth Trend Analysis By Nature, 2019 to 2023
    6.5. Absolute $ Opportunity Analysis By Nature, 2024 to 2034
7. Global Market Analysis 2019 to 2023 and Forecast 2024 to 2034, By Application
    7.1. Introduction / Key Findings
    7.2. Historical Market Size Value (US$ Million) & Volume (Tons) Analysis By Application, 2019 to 2023
    7.3. Current and Future Market Size Value (US$ Million) & Volume (Tons) Analysis and Forecast By Application, 2024 to 2034
        7.3.1. Facial Skincare
            7.3.1.1. Facial Creams & Moisturizer
            7.3.1.2. Serums
            7.3.1.3. Facial Gels/Oils
            7.3.1.4. Others
        7.3.2. Body Care Products
            7.3.2.1. Cosmetic Products
            7.3.2.2. Foundations
            7.3.2.3. Primers & Concealers
            7.3.2.4. Others
    7.4. Y-o-Y Growth Trend Analysis By Application, 2019 to 2023
    7.5. Absolute $ Opportunity Analysis By Application, 2024 to 2034
8. Global Market Analysis 2019 to 2023 and Forecast 2024 to 2034, By Region
    8.1. Introduction
    8.2. Historical Market Size Value (US$ Million) & Volume (Tons) Analysis By Region, 2019 to 2023
    8.3. Current Market Size Value (US$ Million) & Volume (Tons) Analysis and Forecast By Region, 2024 to 2034
        8.3.1. North America
        8.3.2. Latin America
        8.3.3. Western Europe
        8.3.4. Eastern Europe
        8.3.5. South Asia and Pacific
        8.3.6. East Asia
        8.3.7. Middle East and Africa
    8.4. Market Attractiveness Analysis By Region
9. North America Market Analysis 2019 to 2023 and Forecast 2024 to 2034, By Country
    9.1. Historical Market Size Value (US$ Million) & Volume (Tons) Trend Analysis By Market Taxonomy, 2019 to 2023
    9.2. Market Size Value (US$ Million) & Volume (Tons) Forecast By Market Taxonomy, 2024 to 2034
        9.2.1. By Country
            9.2.1.1. USA
            9.2.1.2. Canada
        9.2.2. By Form Type
        9.2.3. By Nature
        9.2.4. By Application
    9.3. Market Attractiveness Analysis
        9.3.1. By Country
        9.3.2. By Form Type
        9.3.3. By Nature
        9.3.4. By Application
    9.4. Key Takeaways
10. Latin America Market Analysis 2019 to 2023 and Forecast 2024 to 2034, By Country
    10.1. Historical Market Size Value (US$ Million) & Volume (Tons) Trend Analysis By Market Taxonomy, 2019 to 2023
    10.2. Market Size Value (US$ Million) & Volume (Tons) Forecast By Market Taxonomy, 2024 to 2034
        10.2.1. By Country
            10.2.1.1. Brazil
            10.2.1.2. Mexico
            10.2.1.3. Rest of Latin America
        10.2.2. By Form Type
        10.2.3. By Nature
        10.2.4. By Application
    10.3. Market Attractiveness Analysis
        10.3.1. By Country
        10.3.2. By Form Type
        10.3.3. By Nature
        10.3.4. By Application
    10.4. Key Takeaways
11. Western Europe Market Analysis 2019 to 2023 and Forecast 2024 to 2034, By Country
    11.1. Historical Market Size Value (US$ Million) & Volume (Tons) Trend Analysis By Market Taxonomy, 2019 to 2023
    11.2. Market Size Value (US$ Million) & Volume (Tons) Forecast By Market Taxonomy, 2024 to 2034
        11.2.1. By Country
            11.2.1.1. Germany
            11.2.1.2. UK
            11.2.1.3. France
            11.2.1.4. Spain
            11.2.1.5. Italy
            11.2.1.6. Rest of Western Europe
        11.2.2. By Form Type
        11.2.3. By Nature
        11.2.4. By Application
    11.3. Market Attractiveness Analysis
        11.3.1. By Country
        11.3.2. By Form Type
        11.3.3. By Nature
        11.3.4. By Application
    11.4. Key Takeaways
12. Eastern Europe Market Analysis 2019 to 2023 and Forecast 2024 to 2034, By Country
    12.1. Historical Market Size Value (US$ Million) & Volume (Tons) Trend Analysis By Market Taxonomy, 2019 to 2023
    12.2. Market Size Value (US$ Million) & Volume (Tons) Forecast By Market Taxonomy, 2024 to 2034
        12.2.1. By Country
            12.2.1.1. Poland
            12.2.1.2. Russia
            12.2.1.3. Czech Republic
            12.2.1.4. Romania
            12.2.1.5. Rest of Eastern Europe
        12.2.2. By Form Type
        12.2.3. By Nature
        12.2.4. By Application
    12.3. Market Attractiveness Analysis
        12.3.1. By Country
        12.3.2. By Form Type
        12.3.3. By Nature
        12.3.4. By Application
    12.4. Key Takeaways
13. South Asia and Pacific Market Analysis 2019 to 2023 and Forecast 2024 to 2034, By Country
    13.1. Historical Market Size Value (US$ Million) & Volume (Tons) Trend Analysis By Market Taxonomy, 2019 to 2023
    13.2. Market Size Value (US$ Million) & Volume (Tons) Forecast By Market Taxonomy, 2024 to 2034
        13.2.1. By Country
            13.2.1.1. India
            13.2.1.2. Bangladesh
            13.2.1.3. Australia
            13.2.1.4. New Zealand
            13.2.1.5. Rest of South Asia and Pacific
        13.2.2. By Form Type
        13.2.3. By Nature
        13.2.4. By Application
    13.3. Market Attractiveness Analysis
        13.3.1. By Country
        13.3.2. By Form Type
        13.3.3. By Nature
        13.3.4. By Application
    13.4. Key Takeaways
14. East Asia Market Analysis 2019 to 2023 and Forecast 2024 to 2034, By Country
    14.1. Historical Market Size Value (US$ Million) & Volume (Tons) Trend Analysis By Market Taxonomy, 2019 to 2023
    14.2. Market Size Value (US$ Million) & Volume (Tons) Forecast By Market Taxonomy, 2024 to 2034
        14.2.1. By Country
            14.2.1.1. China
            14.2.1.2. Japan
            14.2.1.3. South Korea
        14.2.2. By Form Type
        14.2.3. By Nature
        14.2.4. By Application
    14.3. Market Attractiveness Analysis
        14.3.1. By Country
        14.3.2. By Form Type
        14.3.3. By Nature
        14.3.4. By Application
    14.4. Key Takeaways
15. Middle East and Africa Market Analysis 2019 to 2023 and Forecast 2024 to 2034, By Country
    15.1. Historical Market Size Value (US$ Million) & Volume (Tons) Trend Analysis By Market Taxonomy, 2019 to 2023
    15.2. Market Size Value (US$ Million) & Volume (Tons) Forecast By Market Taxonomy, 2024 to 2034
        15.2.1. By Country
            15.2.1.1. GCC Countries
            15.2.1.2. South Africa
            15.2.1.3. Israel
            15.2.1.4. Rest of MEA
        15.2.2. By Form Type
        15.2.3. By Nature
        15.2.4. By Application
    15.3. Market Attractiveness Analysis
        15.3.1. By Country
        15.3.2. By Form Type
        15.3.3. By Nature
        15.3.4. By Application
    15.4. Key Takeaways
16. Key Countries Market Analysis
    16.1. USA
        16.1.1. Pricing Analysis
        16.1.2. Market Share Analysis, 2023
            16.1.2.1. By Form Type
            16.1.2.2. By Nature
            16.1.2.3. By Application
    16.2. Canada
        16.2.1. Pricing Analysis
        16.2.2. Market Share Analysis, 2023
            16.2.2.1. By Form Type
            16.2.2.2. By Nature
            16.2.2.3. By Application
    16.3. Brazil
        16.3.1. Pricing Analysis
        16.3.2. Market Share Analysis, 2023
            16.3.2.1. By Form Type
            16.3.2.2. By Nature
            16.3.2.3. By Application
    16.4. Mexico
        16.4.1. Pricing Analysis
        16.4.2. Market Share Analysis, 2023
            16.4.2.1. By Form Type
            16.4.2.2. By Nature
            16.4.2.3. By Application
    16.5. Germany
        16.5.1. Pricing Analysis
        16.5.2. Market Share Analysis, 2023
            16.5.2.1. By Form Type
            16.5.2.2. By Nature
            16.5.2.3. By Application
    16.6. UK
        16.6.1. Pricing Analysis
        16.6.2. Market Share Analysis, 2023
            16.6.2.1. By Form Type
            16.6.2.2. By Nature
            16.6.2.3. By Application
    16.7. France
        16.7.1. Pricing Analysis
        16.7.2. Market Share Analysis, 2023
            16.7.2.1. By Form Type
            16.7.2.2. By Nature
            16.7.2.3. By Application
    16.8. Spain
        16.8.1. Pricing Analysis
        16.8.2. Market Share Analysis, 2023
            16.8.2.1. By Form Type
            16.8.2.2. By Nature
            16.8.2.3. By Application
    16.9. Italy
        16.9.1. Pricing Analysis
        16.9.2. Market Share Analysis, 2023
            16.9.2.1. By Form Type
            16.9.2.2. By Nature
            16.9.2.3. By Application
    16.10. Poland
        16.10.1. Pricing Analysis
        16.10.2. Market Share Analysis, 2023
            16.10.2.1. By Form Type
            16.10.2.2. By Nature
            16.10.2.3. By Application
    16.11. Russia
        16.11.1. Pricing Analysis
        16.11.2. Market Share Analysis, 2023
            16.11.2.1. By Form Type
            16.11.2.2. By Nature
            16.11.2.3. By Application
    16.12. Czech Republic
        16.12.1. Pricing Analysis
        16.12.2. Market Share Analysis, 2023
            16.12.2.1. By Form Type
            16.12.2.2. By Nature
            16.12.2.3. By Application
    16.13. Romania
        16.13.1. Pricing Analysis
        16.13.2. Market Share Analysis, 2023
            16.13.2.1. By Form Type
            16.13.2.2. By Nature
            16.13.2.3. By Application
    16.14. India
        16.14.1. Pricing Analysis
        16.14.2. Market Share Analysis, 2023
            16.14.2.1. By Form Type
            16.14.2.2. By Nature
            16.14.2.3. By Application
    16.15. Bangladesh
        16.15.1. Pricing Analysis
        16.15.2. Market Share Analysis, 2023
            16.15.2.1. By Form Type
            16.15.2.2. By Nature
            16.15.2.3. By Application
    16.16. Australia
        16.16.1. Pricing Analysis
        16.16.2. Market Share Analysis, 2023
            16.16.2.1. By Form Type
            16.16.2.2. By Nature
            16.16.2.3. By Application
    16.17. New Zealand
        16.17.1. Pricing Analysis
        16.17.2. Market Share Analysis, 2023
            16.17.2.1. By Form Type
            16.17.2.2. By Nature
            16.17.2.3. By Application
    16.18. China
        16.18.1. Pricing Analysis
        16.18.2. Market Share Analysis, 2023
            16.18.2.1. By Form Type
            16.18.2.2. By Nature
            16.18.2.3. By Application
    16.19. Japan
        16.19.1. Pricing Analysis
        16.19.2. Market Share Analysis, 2023
            16.19.2.1. By Form Type
            16.19.2.2. By Nature
            16.19.2.3. By Application
    16.20. South Korea
        16.20.1. Pricing Analysis
        16.20.2. Market Share Analysis, 2023
            16.20.2.1. By Form Type
            16.20.2.2. By Nature
            16.20.2.3. By Application
    16.21. GCC Countries
        16.21.1. Pricing Analysis
        16.21.2. Market Share Analysis, 2023
            16.21.2.1. By Form Type
            16.21.2.2. By Nature
            16.21.2.3. By Application
    16.22. South Africa
        16.22.1. Pricing Analysis
        16.22.2. Market Share Analysis, 2023
            16.22.2.1. By Form Type
            16.22.2.2. By Nature
            16.22.2.3. By Application
    16.23. Israel
        16.23.1. Pricing Analysis
        16.23.2. Market Share Analysis, 2023
            16.23.2.1. By Form Type
            16.23.2.2. By Nature
            16.23.2.3. By Application
17. Market Structure Analysis
    17.1. Competition Dashboard
    17.2. Competition Benchmarking
    17.3. Market Share Analysis of Top Players
        17.3.1. By Regional
        17.3.2. By Form Type
        17.3.3. By Nature
        17.3.4. By Application
18. Competition Analysis
    18.1. Competition Deep Dive
        18.1.1. DSM Nutritional Products, LLC
            18.1.1.1. Overview
            18.1.1.2. Product Portfolio
            18.1.1.3. Profitability by Market Segments
            18.1.1.4. Sales Footprint
            18.1.1.5. Strategy Overview
                18.1.1.5.1. Marketing Strategy
                18.1.1.5.2. Product Strategy
                18.1.1.5.3. Channel Strategy
        18.1.2. Clariant International Ltd
            18.1.2.1. Overview
            18.1.2.2. Product Portfolio
            18.1.2.3. Profitability by Market Segments
            18.1.2.4. Sales Footprint
            18.1.2.5. Strategy Overview
                18.1.2.5.1. Marketing Strategy
                18.1.2.5.2. Product Strategy
                18.1.2.5.3. Channel Strategy
        18.1.3. RAHN AG
            18.1.3.1. Overview
            18.1.3.2. Product Portfolio
            18.1.3.3. Profitability by Market Segments
            18.1.3.4. Sales Footprint
            18.1.3.5. Strategy Overview
                18.1.3.5.1. Marketing Strategy
                18.1.3.5.2. Product Strategy
                18.1.3.5.3. Channel Strategy
        18.1.4. BASF Group
            18.1.4.1. Overview
            18.1.4.2. Product Portfolio
            18.1.4.3. Profitability by Market Segments
            18.1.4.4. Sales Footprint
            18.1.4.5. Strategy Overview
                18.1.4.5.1. Marketing Strategy
                18.1.4.5.2. Product Strategy
                18.1.4.5.3. Channel Strategy
        18.1.5. Croda International Plc
            18.1.5.1. Overview
            18.1.5.2. Product Portfolio
            18.1.5.3. Profitability by Market Segments
            18.1.5.4. Sales Footprint
            18.1.5.5. Strategy Overview
                18.1.5.5.1. Marketing Strategy
                18.1.5.5.2. Product Strategy
                18.1.5.5.3. Channel Strategy
        18.1.6. Ashland Global Specialty Chemicals Inc.
            18.1.6.1. Overview
            18.1.6.2. Product Portfolio
            18.1.6.3. Profitability by Market Segments
            18.1.6.4. Sales Footprint
            18.1.6.5. Strategy Overview
                18.1.6.5.1. Marketing Strategy
                18.1.6.5.2. Product Strategy
                18.1.6.5.3. Channel Strategy
        18.1.7. Kobo Products, Inc.
            18.1.7.1. Overview
            18.1.7.2. Product Portfolio
            18.1.7.3. Profitability by Market Segments
            18.1.7.4. Sales Footprint
            18.1.7.5. Strategy Overview
                18.1.7.5.1. Marketing Strategy
                18.1.7.5.2. Product Strategy
                18.1.7.5.3. Channel Strategy
        18.1.8. Evonik Industries
            18.1.8.1. Overview
            18.1.8.2. Product Portfolio
            18.1.8.3. Profitability by Market Segments
            18.1.8.4. Sales Footprint
            18.1.8.5. Strategy Overview
                18.1.8.5.1. Marketing Strategy
                18.1.8.5.2. Product Strategy
                18.1.8.5.3. Channel Strategy
        18.1.9. Lonza Group
            18.1.9.1. Overview
            18.1.9.2. Product Portfolio
            18.1.9.3. Profitability by Market Segments
            18.1.9.4. Sales Footprint
            18.1.9.5. Strategy Overview
                18.1.9.5.1. Marketing Strategy
                18.1.9.5.2. Product Strategy
                18.1.9.5.3. Channel Strategy
19. Assumptions & Acronyms Used
20. Research Methodology
Recommendations

Consumer Product

Skin Lightening Product Market

January 2024

REP-GB-642

315 pages

Healthcare

Skincare Market

December 2023

REP-GB-13122

324 pages

Technology

LED Modules and Light Engines Market

August 2023

REP-GB-4895

324 pages

Technology

Chip-on-Board Light Emitting Diode (LED) Market

March 2023

REP-GB-2320

300 pages

Explore Consumer Product Insights

View Reports
Future Market Insights

Blue Light Protection Ingredient Market

Schedule a Call