The Brilliant Blue FCF Colors Market is estimated to be valued at USD 61.9 million in 2025 and is projected to reach USD 99.0 million by 2035, registering a compound annual growth rate (CAGR) of 4.8% over the forecast period.
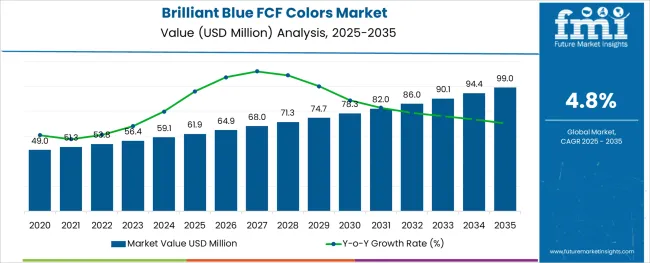
The Brilliant Blue FCF colors market is witnessing stable growth driven by increased demand from food and beverage manufacturers, cosmetics producers, and pharmaceutical formulators seeking high-performance synthetic colorants with consistent output. Ongoing formulation innovations and shelf-life optimization requirements have accelerated the use of certified colorants that offer strong solubility, heat resistance, and pH stability.
Regulatory approvals in key regions including North America, Europe, and Asia-Pacific have further supported expansion, as manufacturers increasingly prioritize uniform batch quality and visual appeal in end products. Demand is also being shaped by the rise of processed food and ready-to-drink beverages, where synthetic colors play a vital role in product identity and consumer perception.
Additionally, manufacturing advancements in pigment processing, reduced heavy metal content, and controlled particle sizing are improving dispersibility and application flexibility. With industry focus on reproducibility, compliance, and functional aesthetics, the market is expected to see ongoing growth across solid forms, lake-soluble variants, and beverage-centered applications.
The market is segmented by Form, Solubility, and Application and region. By Form, the market is divided into Solid, Powder, and Granulated. In terms of Solubility, the market is classified into Lakes and Dyes. Based on Application, the market is segmented into Beverage, Bakery, Snacks, and Cereals, Candy/Confectionery, Dairy, Fruit Preparations/ Fillings, Meat, Poultry, Fish, and Eggs, Potatoes, Pasta, and Rice, Sauces, Soups, and Dressings, Seasonings, Pet Food, and Others. Regionally, the market is classified into North America, Latin America, Western Europe, Eastern Europe, Balkan & Baltic Countries, Russia & Belarus, Central Asia, East Asia, South Asia & Pacific, and the Middle East & Africa.
The market is segmented by Form, Solubility, and Application and region. By Form, the market is divided into Solid, Powder, and Granulated. In terms of Solubility, the market is classified into Lakes and Dyes. Based on Application, the market is segmented into Beverage, Bakery, Snacks, and Cereals, Candy/Confectionery, Dairy, Fruit Preparations/ Fillings, Meat, Poultry, Fish, and Eggs, Potatoes, Pasta, and Rice, Sauces, Soups, and Dressings, Seasonings, Pet Food, and Others. Regionally, the market is classified into North America, Latin America, Western Europe, Eastern Europe, Balkan & Baltic Countries, Russia & Belarus, Central Asia, East Asia, South Asia & Pacific, and the Middle East & Africa.
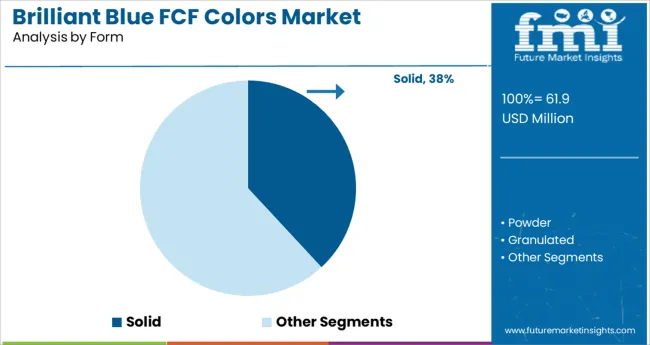
In the form category, the solid segment is projected to account for 38.1% of the Brilliant Blue FCF colors market revenue in 2025, emerging as the dominant formulation. This leadership is attributed to the extended shelf life, ease of transport, and cost-effectiveness of solid formulations.
The segment’s appeal lies in its compatibility with a wide range of dry and semi-solid applications, including tablet coatings, powdered beverages, and bakery mixes. Solid forms enable accurate dosing, better control during manufacturing, and simplified storage, which has proven beneficial for bulk procurement across food and pharmaceutical industries.
Additionally, the ability to blend solid dyes into customized formulations has reinforced their utility in niche manufacturing environments. As manufacturers increasingly favor formulations with enhanced shelf stability and minimal wastage, the demand for solid forms is expected to remain strong, supporting the segment’s continued growth.
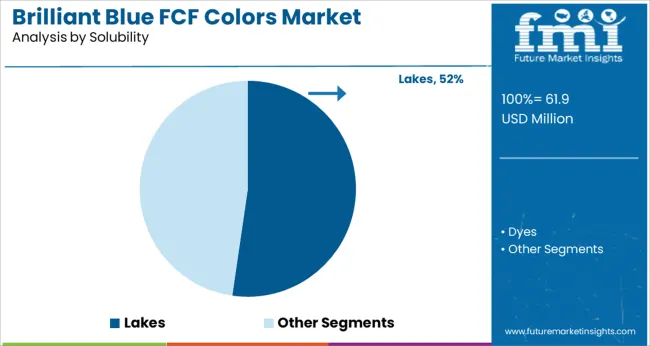
The lakes segment within the solubility category is projected to hold 52.3% of revenue share in 2025, establishing itself as the leading solubility type. This leadership stems from the superior stability that lake colors provide in low-moisture and oil-based applications.
Their insoluble nature ensures enhanced resistance to bleeding and migration, making them highly suitable for processed foods, confectionery coatings, and cosmetic products. Lakes also offer vibrant opacity and adherence in fatty media, expanding their relevance across use cases where water-soluble dyes are less effective.
Manufacturers have adopted lake-soluble variants for consistent color uniformity in complex formulations where ingredient interaction needs to be minimized. The ability to maintain color integrity under varying processing conditions, coupled with regulatory approval for specific applications, has reinforced the dominance of lakes in the Brilliant Blue FCF solubility segment.
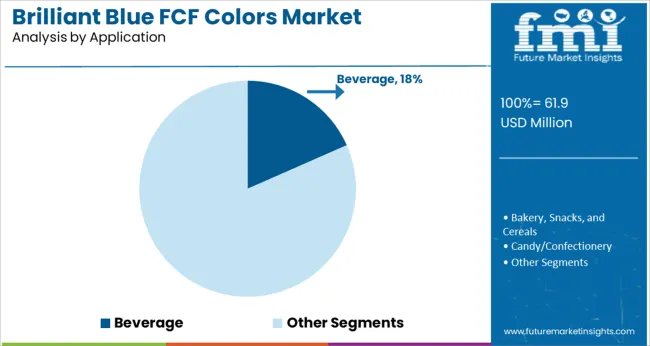
Within the application category, the beverage segment is expected to contribute 18.4% of the Brilliant Blue FCF colors market revenue in 2025, positioning it as the leading end-use area. This segment’s growth has been fueled by the demand for visually appealing carbonated soft drinks, sports beverages, and energy drinks.
Brilliant Blue FCF offers excellent solubility, clarity, and pH stability in liquid formulations, allowing for vibrant and long-lasting coloration in both still and sparkling beverages. The increasing use of synthetic dyes to differentiate flavors and enhance product recognition on retail shelves has supported its uptake in beverage production.
Additionally, the compatibility of Brilliant Blue FCF with sugar and sugar-free formulations has expanded its applicability across diverse product lines. As beverage manufacturers continue to innovate with multi-layered flavor profiles and functional ingredients, the consistent performance and visual appeal of this colorant are expected to sustain its dominance in the segment.
The rapid expansion of the food processing industry with rising internet penetration, as well as affordability and accessibility, would drive sales of brilliant blue FCF colors in the evaluation period. As the beverage industry has found no other replacement for brilliant blue FCF colors, it is also expected to create high demand in the future.
Blue food colorants must have multiple chemical properties like aromatic rings, pi-bond conjugation, heteroatoms, and ionic charges to absorb low-energy red light. The majority of natural blue dye attempts are either unstable, blue only in alkaline conditions, or toxic. Synthetic colors such as brilliant blue FCF are cost-effective and thus would generate high demand, as compared to natural colors.
The brilliant blue FCF colors market is set to be driven by their increasing application in the food and beverage industry. Compared to natural blue colorants, brilliant blue FCF colors make the food or beverage brighter, as well as add greater vibrancy and stability. These colors are extensively utilized in frozen, convenience, ready-to-eat, processed, and baked foods, as well as carbonated drinks, alcoholic beverages, juices, and sauces.
Brilliant blue is not only used in the food and beverages industry but also utilized in soaps, mouthwashes, shampoos, and other personal care products owing to its non-toxic nature. It can outperform other dye tracers at a fast pace and is thus used as a water-tracing agent.
Brilliant blue FCF colors are sometimes poorly absorbed in the gastrointestinal tract. Also, stringent regulations controlling the use of colorants in a few regions and the rising inclination of consumers towards organic food colorants are expected to hamper growth. Key food and beverage manufacturers are nowadays using natural food colors like spirulina colorants to provide safety to consumers, which may also hinder growth.
Use of FCF Blue in Milk Additives and Baked Goods to Aid Growth
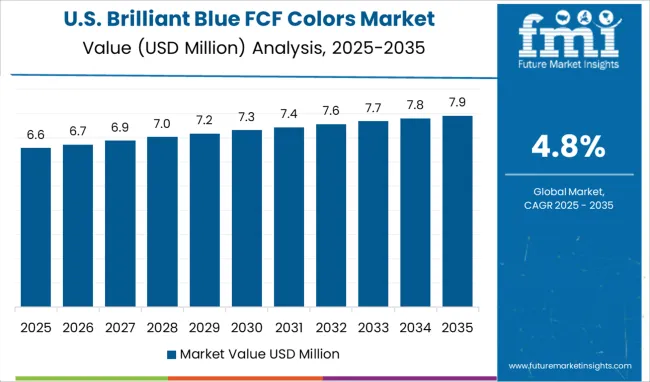
The USA brilliant blue FCF colors market was valued at USD 59.1 Million in 2024, which is approximately 30.18% of the global brilliant blue FCF colors market, says FMI. Increasing the use of brilliant blue FCF colors in dairy products, milk additives, baked goods, snacks, cereals, beverages, and fruit fillings is expected to drive the market.
The Canada brilliant blue FCF colors market, on the other hand, stood at USD 2.8 Million in 2024. The presence of technologically advanced manufacturing facilities and strong distribution networks of renowned food-grade color manufacturers across Canada and the USA is likely to propel the market.
Brilliant Blue FCF Dye Producers to Open New Facilities in India
The India brilliant blue FCF colors market is anticipated to grow at a steady pace in the assessment period. Growth is attributed to the surging use of brilliant blue FCF colorants in the meat processing, bakery & confectionery, and functional food manufacturing industries.
The trend of organic food and beverages in the country is expected to push sales of brilliant blue FCF colors in the upcoming decade. The easy availability of relatively low-cost raw materials and labor is another vital factor that would attract international companies to open their production facilities in India.
Dairy and Confectionery Product Manufacturers to Use Blue FCF
Based on application, the dairy, beverage, bakery, fruit fillings, and candy/confectionery segments are expected to account for the largest share in the global brilliant blue FCF colors market. Brilliant blue FCF colors are extensively used in dairy products, sweets, gummy bears, cotton candies, ice creams, packaged soups, icings, ice pops, blueberry-flavored products, children's medications, and soft drinks.
The dairy segment is expected to exhibit a CAGR of 4.19% through 2035. Besides, the beverage segment is set to hold over 18.7% of the brilliant blue FCF colors market share. The fruit fillings segment is also one of the leading applications of brilliant blue FCF colors and it was valued at USD 59.1 Million in 2024.
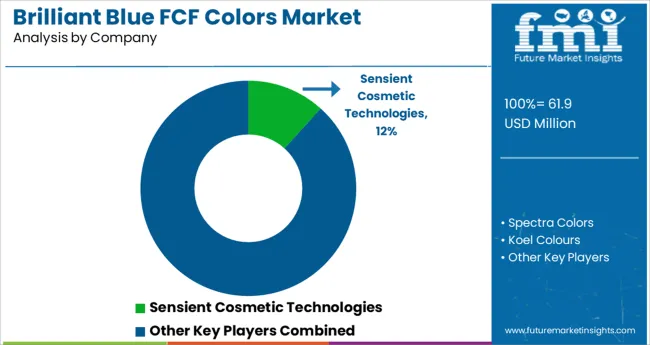
Key companies in the global brilliant blue FCF colors market are focusing on expanding their distribution channels to gain a competitive edge. Several regional market players are striving to use new technologies to innovate their existing product portfolios to attract end-use industries.
Some of the prominent players operating in the global brilliant blue FCF colors market include Sensient Colors LLC, Koel Colors, Clariant, BASF, Spectra Colors, MIFAR, Sun Chemical (DIC), Daito Kasei Kogyo, Neelikon Food Dyes & Chemicals, Symrise, Sunfoodtech, GNT International B.V., GFS Chemicals Inc., Dynamic Products Ltd., Sigma-Aldrich Co. LLC., and Shanghai Dyestuffs Research Institute Co. Ltd., among others.
| Attributes | Details |
|---|---|
| Estimated Market Size (2025) | USD 61.9 million |
| Projected Market Valuation (2035) | USD 99.0 million |
| Value-based CAGR (2025 to 2035) | 4.8% |
| Forecast Period | 2025 to 2035 |
| Historical Data Available for | 2020 to 2024 |
| Market Analysis | Value (million) and Volume (MT) |
| Key Regions Covered | North America; Latin America; Europe; East Asia; South Asia; Oceania; and the Middle East and Africa |
| Key Countries Covered | USA, Canada, Mexico, Brazil, Peru, Argentina, UK, China, India, Japan, Germany, Italy, France, South Africa, South Korea, Australia, and GCC Countries |
| Key Segments Covered | Form, Solubility, Application, and Region |
| Key Companies Profiled | Sensient Cosmetic Technologies; Spectra Colors; Koel Colors; Clariant; BASF; MIFAR; Neelikon Food Dyes and Chemicals; Symrise; Sun Chemical (DIC); Daito Kasei Kogyo; Others |
| Report Coverage | Market forecast, Drivers, Restraints, Opportunities and Threats analysis, company share analysis, competition intelligence, market dynamics and challenges, and strategic growth initiatives |
The global brilliant blue fcf colors market is estimated to be valued at USD 61.9 million in 2025.
It is projected to reach USD 99.0 million by 2035.
The market is expected to grow at a 4.8% CAGR between 2025 and 2035.
The key product types are solid, powder and granulated.
lakes segment is expected to dominate with a 52.3% industry share in 2025.


Our Research Products

The "Full Research Suite" delivers actionable market intel, deep dives on markets or technologies, so clients act faster, cut risk, and unlock growth.

The Leaderboard benchmarks and ranks top vendors, classifying them as Established Leaders, Leading Challengers, or Disruptors & Challengers.

Locates where complements amplify value and substitutes erode it, forecasting net impact by horizon

We deliver granular, decision-grade intel: market sizing, 5-year forecasts, pricing, adoption, usage, revenue, and operational KPIs—plus competitor tracking, regulation, and value chains—across 60 countries broadly.

Spot the shifts before they hit your P&L. We track inflection points, adoption curves, pricing moves, and ecosystem plays to show where demand is heading, why it is changing, and what to do next across high-growth markets and disruptive tech

Real-time reads of user behavior. We track shifting priorities, perceptions of today’s and next-gen services, and provider experience, then pace how fast tech moves from trial to adoption, blending buyer, consumer, and channel inputs with social signals (#WhySwitch, #UX).

Partner with our analyst team to build a custom report designed around your business priorities. From analysing market trends to assessing competitors or crafting bespoke datasets, we tailor insights to your needs.
Supplier Intelligence
Discovery & Profiling
Capacity & Footprint
Performance & Risk
Compliance & Governance
Commercial Readiness
Who Supplies Whom
Scorecards & Shortlists
Playbooks & Docs
Category Intelligence
Definition & Scope
Demand & Use Cases
Cost Drivers
Market Structure
Supply Chain Map
Trade & Policy
Operating Norms
Deliverables
Buyer Intelligence
Account Basics
Spend & Scope
Procurement Model
Vendor Requirements
Terms & Policies
Entry Strategy
Pain Points & Triggers
Outputs
Pricing Analysis
Benchmarks
Trends
Should-Cost
Indexation
Landed Cost
Commercial Terms
Deliverables
Brand Analysis
Positioning & Value Prop
Share & Presence
Customer Evidence
Go-to-Market
Digital & Reputation
Compliance & Trust
KPIs & Gaps
Outputs
Full Research Suite comprises of:
Market outlook & trends analysis
Interviews & case studies
Strategic recommendations
Vendor profiles & capabilities analysis
5-year forecasts
8 regions and 60+ country-level data splits
Market segment data splits
12 months of continuous data updates
DELIVERED AS:
PDF EXCEL ONLINE
Competitive Overview of Brilliant Blue FCF Colors Market Share
UK Brilliant Blue FCF Colors Market Analysis – Growth, Applications & Outlook 2025-2035
USA Brilliant Blue FCF Colors Market Report – Demand, Trends & Industry Forecast 2025-2035
Europe Brilliant Blue FCF Colors Market Trends – Size, Share & Growth 2025-2035
Asia Pacific Brilliant Blue FCF Colors Market Trends – Growth, Demand & Forecast 2025-2035
Brilliant Black BN Colors Market Size and Share Forecast Outlook 2025 to 2035
Blue Light Protection Ingredient Market Size and Share Forecast Outlook 2025 to 2035
Blue Light Protection Skincare Market Size and Share Forecast Outlook 2025 to 2035
Blue Light Blocking Glasses Market Size and Share Forecast Outlook 2025 to 2035
Blue Ceramic Abrasive Market Size and Share Forecast Outlook 2025 to 2035
Blueberry Extract Antioxidants Market Size and Share Forecast Outlook 2025 to 2035
Bluetooth Photo Capture Device Market Size and Share Forecast Outlook 2025 to 2035
Blue Hydrogen Market Size and Share Forecast Outlook 2025 to 2035
Bluetooth Hearing Aids Market Trends – Growth & Forecast 2025 to 2035
Bluetooth Low Energy Market Analysis by Technology, Application and Region Through 2035
Analyzing Blue Light Blocking Glasses Market Share & Industry Leaders
Market Share Insights for Blueberry Ingredient Providers
Competitive Landscape of Blue Light Protection Ingredient Providers
Blueberries Market Analysis – Size, Share & Forecast 2025-2035
Bluetooth Adapter Market

Thank you!
You will receive an email from our Business Development Manager. Please be sure to check your SPAM/JUNK folder too.
Chat With
MaRIA