Brilliant Black BN Color Market Outlook (2022 to 2032)

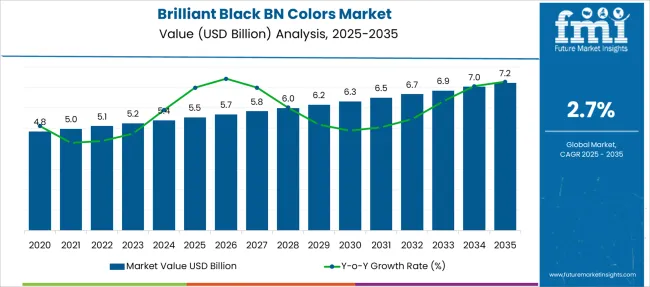
The global brilliant black BN Colors market is holding USD 5.11 Million in the year 2022, lingering with a lower CAGR of 2.7% by 2022 to 2032. FMI analysis indicates that the brilliant black BN color market is anticipated to reach a market value of USD 6.7 Million in sales in the global market by 2032. By volume, Brilliant black BN colors had a consumption of 1200 metric tons globally in 2021.

Attributes Details
Brilliant Black BN Colors Market Size (2022E) USD 5.11 Million
Brilliant Black BN Colors Market Projected Size (2032F) USD 6.7 Million
Value CAGR (2022 to 2032) 2.7%
Top Region Market Share (EMEAI) 47%

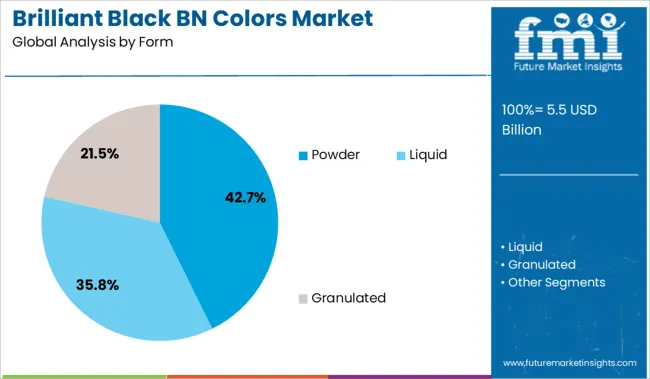
Brilliant black BN, which is also known as Black PN, Food Black 1, Brilliant Black PN, Brilliant Black A, Naphthol Black, CI 28440, or CI Food Black 1, is a synthetic black diazo dye that is soluble in water. It is usually offered as tetrasodium, calcium, or potassium salt having an appearance of a fine powder, solid, or granules.

Brilliant black BN food colors market demand analysis suggests that the demand for brilliant black BN color is expected to grow faster than in other adjacent markets. The overall market is driven by the highly growing demand for innovative, unique, and displayed food dishes and altering taste and food appeal preferences.

This trend has been complemented further due to the advent of rapid connectivity through social media among the worldwide population which pushes the different trends that shape the market’s future.

Don't pay for what you don't need

Customize your report by selecting specific countries or regions and save 30%!

What Is The Key Driver Behind The Growth Of Brilliant Black BN Colors?

Brilliant black BN food colors are one of the few edible black pigments that are produced in higher quantities; they are also much cheaper than their counterparts. Food processing industries in Cakes & Pastries, Cookies, Biscuits & Cones, Frosting/Icing, crackers & Savoury snacks have traditionally been using brilliant black BN colors.

Ready-to-eat food products have been consistently gaining popularity in view of rapid urbanization, adopting, and exploring new tastes and colors altogether.

Rapid urbanization, growth in population, advanced distribution systems, and increase in disposable income also influence the brilliant Black BN colors market positively as the rise in production and demand of food and beverage products across the globe also affects the brilliant Black BN colors market.

As compared with natural food colors, brilliant black BN colors are highly effective and impart intense and uniform color in food & beverage products at a faster pace and can easily get miscible with the solution and make more unequivocal solutions. Also, brilliant black BN colors are widely sold in emerging and underdeveloped economies due to the lesser awareness of organic food colors that will boost their forecasted sales.

Brilliant Black BN Colors Market

Consumer Demand For Confectioneries And Dessert Food Products Is Driving The Market Growth

A new market research report on brilliant black BN food colors explains that the market growth is owing to the growing demand for confectionery, baked items, pastries, desserts, ready-to-eat, and ready-to-drink foods.

Food manufacturers are widely using synthetic food colors to restore the attractiveness of food and beverage products after processing. Brilliant black BN food color is perfect for creating special treats on birthday and Halloween parties and other holidays or as a dye for decorating eggs.

Nandini Roy Choudhury

Principal Consultant

Talk to Analyst

Find your sweet spots for generating winning opportunities in this market.

What Is A Key Challenge To The Brilliant Black BN Colors Market?

Stringent regulation about brilliant black BN colors among consumers is a key restraint to the market. Brilliant black food color has been banned in the USA, Switzerland, and Japan. The USA is the largest market for food colorants, and this ban has shrunk the overall sales of brilliant black BN colors ultimately.

It is approved by the European Union. Though until 2001, the dye was banned in Norway and was unbanned due to trade relationships with the EU, resulting in the expansion of the brilliant black BN color market size.

Potential health hazards of synthetic colors and consumer hesitations are key factors creating a significant challenge for the food colors market growth. Also, the changing consumer preference toward the natural ingredient may cut the growth in the demand for brilliant black BN colors.
Country-Wise Insights

What are the Growth Prospects of the Asia-Pacific Region in the Brilliant Black BN Colors Market?

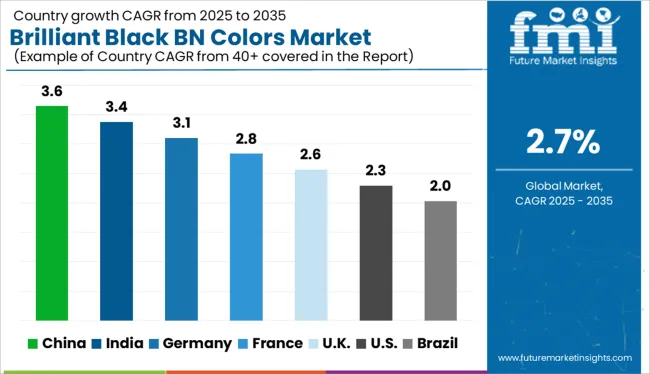
A global study on the brilliant black BN color market explains that the Asia-Pacific region had a consumption of about 370 metric tons in 2021, which is approximately 30.5% of the global brilliant black BN colors market. Beverages have been the best-performing application for brilliant black BN colors in North American countries.

The Chinese food colorant market is one of the largest markets for brilliant black colorants. Key brilliant black BN colors manufacturers like Hangzhou Dayangchem Co. Ltd. and San-Ei Gen F.F.I., Inc. have strong manufacturing facilities, strong distribution networks, and commercial presence in South East Asia and particularly China and Thailand.

Which other Countries have a High Market Share for Brilliant Black BN Colors Market?

Emerging trends in the brilliant black BN color market state that India currently has a high-volume sale of about 130 metric tons annually for brilliant black BN colors. European Brilliant Black BN colors sales clocked over 250 metric tons in 2021. The expansion of food processing industries in the Middle East and Africa will continue to create impressive prospects while increasing the sales of brilliant black BN colors in EMEAI.

Brazil recorded sales of USD 570,000 in 2021. The continuous advancements in various food industries, such as meat processing, bakery & confectionery, pet food industry, and functional food products, and the rise in demand for innovative and exotic food colors by restaurants and cafeterias are expected to drive the brilliant black BN colors market growth in Latin America.

Get the data you need at a Fraction of the cost

Personalize your report by choosing insights you need
and save 40%!

Category-Wise Insights

What is the Leading Application of Brilliant Black BN colors?

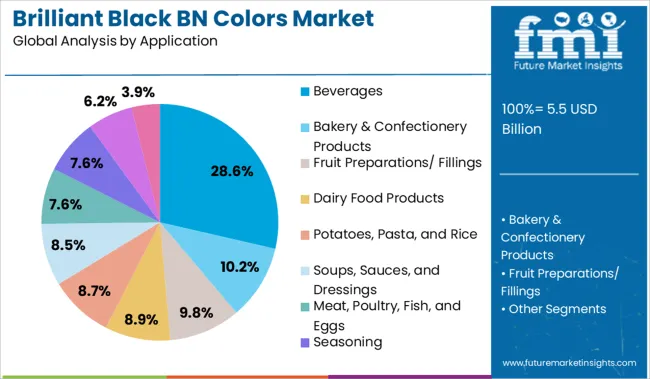
Brilliant black BN colors market analysis divides the application category into candy, confectioneries, beverages and bakery, snacks, and cereals segments have been and are projected to account for the largest share in the market, increasing the demand for brilliant black BN colors globally.

The confectionery and bakery segments have over 17.66% and 16.37% of Brilliant Black BN colors market share respectively. Besides this, the chocolate and compound coating industry is anticipated to clock a revenue of USD 251,300 in 2022.

How Does Social Media Impact the Brilliant Black BN Colors Market?

Brilliant black BN colors market survey puts social media as a propelling shift in consumers’ preference towards food with extravagant appearances, which increases the consumption of such food colors. Enhancement in the product looks by manufacturers to cater to the requirements of the consumers is forecasted to expand the brilliant black BN colors market size.

Unique food colors like black are difficult to create using natural food colorants, and usually, the last resort is brilliant black BN colors, benefiting the end users in creating new and unique dishes. New food trends on social media platforms like Instagram involve videos and reels that go viral and create large traction for new food practices, fueling the sales of Brilliant black BN colors.

The internet has also helped in propelling e-commerce and giving efficient supply chains and logistics a boost. Brilliant black BN colors are in high demand in food processing industries of emerging economies like China and India coupled with the penetration of the internet into these regions.
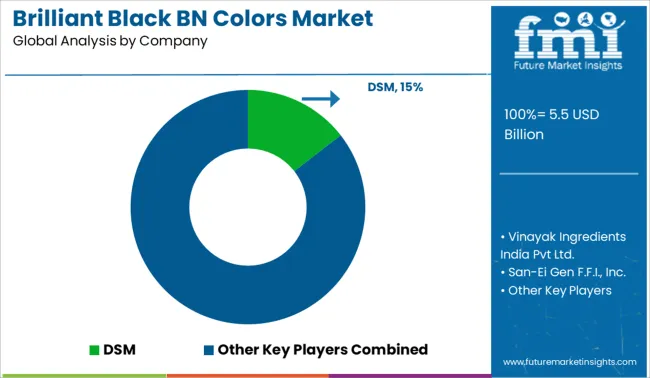
Competitive Landscape

Brilliant black BN colors market players have been investing in research and development to reduce health hazards and minimize barriers to entry in markets, while simultaneously making the product attractive to end-user industries and consumers.

Large manufacturers such as Sigma-Aldrich International GmbH are acquiring innovative regional units. Manufacturers are also diversifying towards various applications like pet foods and edible cosmetics.

Latest Market Developments

  • Vinayak Ingredients Pvt Ltd., completing its 45th year in the food color market, being one of the first menthol producers in India has deployed its new batch of brilliant black BN color that is primarily used in decorations and coating and color confectionery. This drives the sales of brilliant black BN colors globally.
  • Sensient Food Colors have upgraded their brilliant black BN colors that come with better water solubility and strong heat stability, giving them an edge over their counterparts, and pushing the overall demand for brilliant black BN colors in new regions.

Scope Of The Report

Attributes Details
CAGR % (2022 to 2032) 2.7%
Forecast Period 2022 to 2032
Historical Data Available for 2017 to 2021
Market Analysis USD Million for Value and MT for Volume
Key Regions Covered Global North America; Latin America; Europe; Middle East and Africa; and India; Asia Pacific
Key Countries Covered USA, Canada, Mexico, Brazil, Peru, Argentina, United Kingdom, China, India, Japan, Germany, Italy, France, South Africa, South Korea, Australia, and GCC Countries
Key Segments Covered Type, Form, Color, Application, and Region
Key Companies Profiled DSM; Vinayak Ingredients India Pvt Ltd.; San-Ei Gen F.F.I., Inc.; Sensient Colors LLC.; Symrise AG; Chr. Hansen Holding A/S; Allied Biotech Corporation; Sigma-Aldrich International GmbH; DDW; The Color House; Hangzhou Dayangchem Co. Ltd.; Döhler Group; Kancor; Kalsec Inc.; Others
Report Coverage Market Forecast, Drivers, Restraints, Opportunities and Threats Analysis, Company Share Analysis, Competition Intelligence, Market Dynamics and Challenges, and Strategic Growth Initiatives
Customization & Pricing Available upon Request

Brilliant Black BN Colors Market By Category

On the basis of form:

  • Solid
  • Powder
  • Granulated

By Application:

  • Beverage
  • Bakery, Snacks, and Cereals
  • Candy/ Confectionery
  • Dairy
  • Fruit Preparations/ Fillings
  • Meat, Poultry, Fish, and Eggs
  • Potatoes, Pasta, and Rice
  • Sauces, Soups, and Dressings
  • Seasonings
  • Pet Food

By Region:

  • Global
  • North America
  • Latin America
  • Europe, the Middle East and Africa, and India
  • Asia Pacific

Frequently Asked Questions

How Big is the Brilliant Black BN Colors Market?

The brilliant black BN colors market is valued at USD 5.11 Million in 2022 and is likely to cross USD 6.73 million in value by 2032.

How Much Does Bakery, Cereal, and Snack Industry Contribute to Food Colors Market?

Bakery, Cereal, and Snacks accounted for 16.31% of sales by volume in the brilliant black BN colors market in 2022.

What is the growth outlook of Brilliant Black BN Colors market in EMEAI?

In Europe, the Middle East, Africa, and India, the demand for brilliant black BN colors are expected to grow at 2.3% CAGR through 2032.

Table of Content
1. Executive Summary | Brilliant Black BN Colors Market
    1.1. Global Market Outlook
    1.2. Demand-side Trends
    1.3. Supply-side Trends
    1.4. Technology Roadmap Analysis
    1.5. Analysis and Recommendations
2. Market Overview
    2.1. Market Coverage / Taxonomy
    2.2. Market Definition / Scope / Limitations
3. Market Background
    3.1. Market Dynamics
        3.1.1. Drivers
        3.1.2. Restraints
        3.1.3. Opportunity
        3.1.4. Trends
    3.2. Scenario Forecast
        3.2.1. Demand in Optimistic Scenario
        3.2.2. Demand in Likely Scenario
        3.2.3. Demand in Conservative Scenario
    3.3. Product Launches & Recent Developments
    3.4. Product Life Cycle Analysis
    3.5. Value Chain Analysis
        3.5.1. Supply Side Participants and Their Roles
            3.5.1.1. Producers
            3.5.1.2. Mid-Level Participants (Traders/ Agents/ Brokers)
            3.5.1.3. Wholesalers and Distributors
        3.5.2. % of Operating Margin Analysis
        3.5.3. List of Raw Material Suppliers
        3.5.4. List of Existing and Potential Buyers
    3.6. Global Market- Pricing Analysis
        3.6.1. Price Point Assessment by Region
        3.6.2. Price Point Assessment by Form
        3.6.3. Price Forecast till 2032
        3.6.4. Factors Affecting Pricing
    3.7. Forecast Factors - Relevance & Impact
    3.8. PESTLE and Porter's Analysis
    3.9. Regulatory Landscape
        3.9.1. Packaging & Labelling Regulations
        3.9.2. Certifications and Certifying Agency Overview
        3.9.3. Import/Export Policies
    3.10. Regional Parent Market Outlook
    3.11. Consumers Survey Analysis
    3.12. Macro-Economic Factors
    3.13. Product Claims & Nutritional Information scanned by Buyers
4. Global Market Analysis 2017 to 2021 and Forecast, 2022 to 2032
    4.1. Historical Market Size Value (US$ Million) & Volume (MT) Analysis, 2017 to 2021
    4.2. Current and Future Market Size Value (US$ Million) & Volume (MT) Projections, 2022 to 2032
        4.2.1. Y-o-Y Growth Trend Analysis
        4.2.2. Absolute $ Opportunity Analysis
5. Global Market Analysis 2017 to 2021 and Forecast 2022 to 2032, By Form
    5.1. Introduction / Key Findings
    5.2. Historical Market Size Value (US$ Million) & Volume (MT) Analysis By Form, 2017 to 2021
    5.3. Current and Future Market Size Value (US$ Million) & Volume (MT) Analysis and Forecast By Form, 2022 to 2032
        5.3.1. Powder
        5.3.2. Liquid
        5.3.3. Granulated
    5.4. Y-o-Y Growth Trend Analysis By Form, 2017 to 2021
    5.5. Absolute $ Opportunity Analysis By Form, 2022 to 2032
6. Global Market Analysis 2017 to 2021 and Forecast 2022 to 2032, By Application
    6.1. Introduction / Key Findings
    6.2. Historical Market Size Value (US$ Million) & Volume (MT) Analysis By Application, 2017 to 2021
    6.3. Current and Future Market Size Value (US$ Million) & Volume (MT) Analysis and Forecast By Application, 2022 to 2032
        6.3.1. Beverages
        6.3.2. Bakery & Confectionery Products
        6.3.3. Fruit Preparations/ Fillings
        6.3.4. Dairy Food Products
        6.3.5. Potatoes, Pasta, and Rice
        6.3.6. Soups, Sauces, and Dressings
        6.3.7. Meat, Poultry, Fish, and Eggs
        6.3.8. Seasoning
        6.3.9. Candy/Confectionary
        6.3.10. Pet Food
    6.4. Y-o-Y Growth Trend Analysis By Application, 2017 to 2021
    6.5. Absolute $ Opportunity Analysis By Application, 2022 to 2032
7. Global Market Analysis 2017 to 2021 and Forecast 2022 to 2032, By Region
    7.1. Introduction
    7.2. Historical Market Size Value (US$ Million) & Volume (MT) Analysis By Region, 2017 to 2021
    7.3. Current Market Size Value (US$ Million) & Volume (MT) Analysis and Forecast By Region, 2022 to 2032
        7.3.1. North America
        7.3.2. Latin America
        7.3.3. Europe
        7.3.4. East Asia
        7.3.5. South Asia
        7.3.6. Oceania
        7.3.7. Middle East and Africa
    7.4. Market Attractiveness Analysis By Region
8. North America Market Analysis 2017 to 2021 and Forecast 2022 to 2032, By Country
    8.1. Historical Market Size Value (US$ Million) & Volume (MT) Trend Analysis By Market Taxonomy, 2017 to 2021
    8.2. Market Size Value (US$ Million) & Volume (MT) Forecast By Market Taxonomy, 2022 to 2032
        8.2.1. By Country
            8.2.1.1. USA
            8.2.1.2. Canada
        8.2.2. By Form
        8.2.3. By Application
    8.3. Market Attractiveness Analysis
        8.3.1. By Country
        8.3.2. By Form
        8.3.3. By Application
    8.4. Key Takeaways
9. Latin America Market Analysis 2017 to 2021 and Forecast 2022 to 2032, By Country
    9.1. Historical Market Size Value (US$ Million) & Volume (MT) Trend Analysis By Market Taxonomy, 2017 to 2021
    9.2. Market Size Value (US$ Million) & Volume (MT) Forecast By Market Taxonomy, 2022 to 2032
        9.2.1. By Country
            9.2.1.1. Brazil
            9.2.1.2. Mexico
            9.2.1.3. Argentina
            9.2.1.4. Chile
            9.2.1.5. Peru
            9.2.1.6. Rest of Latin America
        9.2.2. By Form
        9.2.3. By Application
    9.3. Market Attractiveness Analysis
        9.3.1. By Country
        9.3.2. By Form
        9.3.3. By Application
    9.4. Key Takeaways
10. Europe Market Analysis 2017 to 2021 and Forecast 2022 to 2032, By Country
    10.1. Historical Market Size Value (US$ Million) & Volume (MT) Trend Analysis By Market Taxonomy, 2017 to 2021
    10.2. Market Size Value (US$ Million) & Volume (MT) Forecast By Market Taxonomy, 2022 to 2032
        10.2.1. By Country
            10.2.1.1. Germany
            10.2.1.2. Italy
            10.2.1.3. France
            10.2.1.4. United Kingdom
            10.2.1.5. Spain
            10.2.1.6. Russia
            10.2.1.7. BENELUX
            10.2.1.8. Poland
            10.2.1.9. Nordic Countries
            10.2.1.10. Rest of Europe
        10.2.2. By Form
        10.2.3. By Application
    10.3. Market Attractiveness Analysis
        10.3.1. By Country
        10.3.2. By Form
        10.3.3. By Application
    10.4. Key Takeaways
11. East Asia Market Analysis 2017 to 2021 and Forecast 2022 to 2032, By Country
    11.1. Historical Market Size Value (US$ Million) & Volume (MT) Trend Analysis By Market Taxonomy, 2017 to 2021
    11.2. Market Size Value (US$ Million) & Volume (MT) Forecast By Market Taxonomy, 2022 to 2032
        11.2.1. By Country
            11.2.1.1. China
            11.2.1.2. Japan
            11.2.1.3. South Korea
        11.2.2. By Form
        11.2.3. By Application
    11.3. Market Attractiveness Analysis
        11.3.1. By Country
        11.3.2. By Form
        11.3.3. By Application
    11.4. Key Takeaways
12. South Asia Market Analysis 2017 to 2021 and Forecast 2022 to 2032, By Country
    12.1. Historical Market Size Value (US$ Million) & Volume (MT) Trend Analysis By Market Taxonomy, 2017 to 2021
    12.2. Market Size Value (US$ Million) & Volume (MT) Forecast By Market Taxonomy, 2022 to 2032
        12.2.1. By Country
            12.2.1.1. India
            12.2.1.2. Thailand
            12.2.1.3. Malaysia
            12.2.1.4. Indonesia
            12.2.1.5. Rest of South Asia
        12.2.2. By Form
        12.2.3. By Application
    12.3. Market Attractiveness Analysis
        12.3.1. By Country
        12.3.2. By Form
        12.3.3. By Application
    12.4. Key Takeaways
13. Oceania Market Analysis 2017 to 2021 and Forecast 2022 to 2032, By Country
    13.1. Historical Market Size Value (US$ Million) & Volume (MT) Trend Analysis By Market Taxonomy, 2017 to 2021
    13.2. Market Size Value (US$ Million) & Volume (MT) Forecast By Market Taxonomy, 2022 to 2032
        13.2.1. By Country
            13.2.1.1. Australia
            13.2.1.2. New Zealand
        13.2.2. By Form
        13.2.3. By Application
    13.3. Market Attractiveness Analysis
        13.3.1. By Country
        13.3.2. By Form
        13.3.3. By Application
    13.4. Key Takeaways
14. Middle East and Africa Market Analysis 2017 to 2021 and Forecast 2022 to 2032, By Country
    14.1. Historical Market Size Value (US$ Million) & Volume (MT) Trend Analysis By Market Taxonomy, 2017 to 2021
    14.2. Market Size Value (US$ Million) & Volume (MT) Forecast By Market Taxonomy, 2022 to 2032
        14.2.1. By Country
            14.2.1.1. GCC Countries
            14.2.1.2. South Africa
            14.2.1.3. Central Africa
            14.2.1.4. North Africa
        14.2.2. By Form
        14.2.3. By Application
    14.3. Market Attractiveness Analysis
        14.3.1. By Country
        14.3.2. By Form
        14.3.3. By Application
    14.4. Key Takeaways
15. Key Countries Market Analysis
    15.1. USA
        15.1.1. Pricing Analysis
        15.1.2. Market Share Analysis, 2021
            15.1.2.1. By Form
            15.1.2.2. By Application
    15.2. Canada
        15.2.1. Pricing Analysis
        15.2.2. Market Share Analysis, 2021
            15.2.2.1. By Form
            15.2.2.2. By Application
    15.3. Brazil
        15.3.1. Pricing Analysis
        15.3.2. Market Share Analysis, 2021
            15.3.2.1. By Form
            15.3.2.2. By Application
    15.4. Mexico
        15.4.1. Pricing Analysis
        15.4.2. Market Share Analysis, 2021
            15.4.2.1. By Form
            15.4.2.2. By Application
    15.5. Argentina
        15.5.1. Pricing Analysis
        15.5.2. Market Share Analysis, 2021
            15.5.2.1. By Form
            15.5.2.2. By Application
    15.6. Chile
        15.6.1. Pricing Analysis
        15.6.2. Market Share Analysis, 2021
            15.6.2.1. By Form
            15.6.2.2. By Application
    15.7. Peru
        15.7.1. Pricing Analysis
        15.7.2. Market Share Analysis, 2021
            15.7.2.1. By Form
            15.7.2.2. By Application
    15.8. Germany
        15.8.1. Pricing Analysis
        15.8.2. Market Share Analysis, 2021
            15.8.2.1. By Form
            15.8.2.2. By Application
    15.9. Italy
        15.9.1. Pricing Analysis
        15.9.2. Market Share Analysis, 2021
            15.9.2.1. By Form
            15.9.2.2. By Application
    15.10. France
        15.10.1. Pricing Analysis
        15.10.2. Market Share Analysis, 2021
            15.10.2.1. By Form
            15.10.2.2. By Application
    15.11. Spain
        15.11.1. Pricing Analysis
        15.11.2. Market Share Analysis, 2021
            15.11.2.1. By Form
            15.11.2.2. By Application
    15.12. United Kingdom
        15.12.1. Pricing Analysis
        15.12.2. Market Share Analysis, 2021
            15.12.2.1. By Form
            15.12.2.2. By Application
    15.13. Russia
        15.13.1. Pricing Analysis
        15.13.2. Market Share Analysis, 2021
            15.13.2.1. By Form
            15.13.2.2. By Application
    15.14. Poland
        15.14.1. Pricing Analysis
        15.14.2. Market Share Analysis, 2021
            15.14.2.1. By Form
            15.14.2.2. By Application
    15.15. BENELUX
        15.15.1. Pricing Analysis
        15.15.2. Market Share Analysis, 2021
            15.15.2.1. By Form
            15.15.2.2. By Application
    15.16. Nordic Countries
        15.16.1. Pricing Analysis
        15.16.2. Market Share Analysis, 2021
            15.16.2.1. By Form
            15.16.2.2. By Application
    15.17. China
        15.17.1. Pricing Analysis
        15.17.2. Market Share Analysis, 2021
            15.17.2.1. By Form
            15.17.2.2. By Application
    15.18. Japan
        15.18.1. Pricing Analysis
        15.18.2. Market Share Analysis, 2021
            15.18.2.1. By Form
            15.18.2.2. By Application
    15.19. South Korea
        15.19.1. Pricing Analysis
        15.19.2. Market Share Analysis, 2021
            15.19.2.1. By Form
            15.19.2.2. By Application
    15.20. India
        15.20.1. Pricing Analysis
        15.20.2. Market Share Analysis, 2021
            15.20.2.1. By Form
            15.20.2.2. By Application
    15.21. Thailand
        15.21.1. Pricing Analysis
        15.21.2. Market Share Analysis, 2021
            15.21.2.1. By Form
            15.21.2.2. By Application
    15.22. Indonesia
        15.22.1. Pricing Analysis
        15.22.2. Market Share Analysis, 2021
            15.22.2.1. By Form
            15.22.2.2. By Application
    15.23. Malaysia
        15.23.1. Pricing Analysis
        15.23.2. Market Share Analysis, 2021
            15.23.2.1. By Form
            15.23.2.2. By Application
    15.24. Singapore
        15.24.1. Pricing Analysis
        15.24.2. Market Share Analysis, 2021
            15.24.2.1. By Form
            15.24.2.2. By Application
    15.25. GCC Countries
        15.25.1. Pricing Analysis
        15.25.2. Market Share Analysis, 2021
            15.25.2.1. By Form
            15.25.2.2. By Application
    15.26. South Africa
        15.26.1. Pricing Analysis
        15.26.2. Market Share Analysis, 2021
            15.26.2.1. By Form
            15.26.2.2. By Application
    15.27. Central Africa
        15.27.1. Pricing Analysis
        15.27.2. Market Share Analysis, 2021
            15.27.2.1. By Form
            15.27.2.2. By Application
    15.28. North Africa
        15.28.1. Pricing Analysis
        15.28.2. Market Share Analysis, 2021
            15.28.2.1. By Form
            15.28.2.2. By Application
16. Market Structure Analysis
    16.1. Competition Dashboard
    16.2. Competition Benchmarking
    16.3. Market Share Analysis of Top Players
        16.3.1. By Regional
        16.3.2. By Form
        16.3.3. By Application
17. Competition Analysis
    17.1. Competition Deep Dive
        17.1.1. DSM 
            17.1.1.1. Overview
            17.1.1.2. Product Portfolio
            17.1.1.3. Profitability by Market Segments (Product/Age /Sales Channel/Region)
            17.1.1.4. Sales Footprint
            17.1.1.5. Strategy Overview
                17.1.1.5.1. Marketing Strategy
                17.1.1.5.2. Product Strategy
                17.1.1.5.3. Channel Strategy
        17.1.2. Vinayak Ingredients India Pvt Ltd.
            17.1.2.1. Overview
            17.1.2.2. Product Portfolio
            17.1.2.3. Profitability by Market Segments (Product/Age /Sales Channel/Region)
            17.1.2.4. Sales Footprint
            17.1.2.5. Strategy Overview
                17.1.2.5.1. Marketing Strategy
                17.1.2.5.2. Product Strategy
                17.1.2.5.3. Channel Strategy
        17.1.3. San-Ei Gen F.F.I., Inc.
            17.1.3.1. Overview
            17.1.3.2. Product Portfolio
            17.1.3.3. Profitability by Market Segments (Product/Age /Sales Channel/Region)
            17.1.3.4. Sales Footprint
            17.1.3.5. Strategy Overview
                17.1.3.5.1. Marketing Strategy
                17.1.3.5.2. Product Strategy
                17.1.3.5.3. Channel Strategy
        17.1.4. Sensient Colors LLC.
            17.1.4.1. Overview
            17.1.4.2. Product Portfolio
            17.1.4.3. Profitability by Market Segments (Product/Age /Sales Channel/Region)
            17.1.4.4. Sales Footprint
            17.1.4.5. Strategy Overview
                17.1.4.5.1. Marketing Strategy
                17.1.4.5.2. Product Strategy
                17.1.4.5.3. Channel Strategy
        17.1.5. Symrise AG
            17.1.5.1. Overview
            17.1.5.2. Product Portfolio
            17.1.5.3. Profitability by Market Segments (Product/Age /Sales Channel/Region)
            17.1.5.4. Sales Footprint
            17.1.5.5. Strategy Overview
                17.1.5.5.1. Marketing Strategy
                17.1.5.5.2. Product Strategy
                17.1.5.5.3. Channel Strategy
        17.1.6. Chr. Hansen Holding A/S
            17.1.6.1. Overview
            17.1.6.2. Product Portfolio
            17.1.6.3. Profitability by Market Segments (Product/Age /Sales Channel/Region)
            17.1.6.4. Sales Footprint
            17.1.6.5. Strategy Overview
                17.1.6.5.1. Marketing Strategy
                17.1.6.5.2. Product Strategy
                17.1.6.5.3. Channel Strategy
        17.1.7. Allied Biotech Corporation
            17.1.7.1. Overview
            17.1.7.2. Product Portfolio
            17.1.7.3. Profitability by Market Segments (Product/Age /Sales Channel/Region)
            17.1.7.4. Sales Footprint
            17.1.7.5. Strategy Overview
                17.1.7.5.1. Marketing Strategy
                17.1.7.5.2. Product Strategy
                17.1.7.5.3. Channel Strategy
        17.1.8. Sigma-Aldrich International GmbH
            17.1.8.1. Overview
            17.1.8.2. Product Portfolio
            17.1.8.3. Profitability by Market Segments (Product/Age /Sales Channel/Region)
            17.1.8.4. Sales Footprint
            17.1.8.5. Strategy Overview
                17.1.8.5.1. Marketing Strategy
                17.1.8.5.2. Product Strategy
                17.1.8.5.3. Channel Strategy
        17.1.9. DDW, The Color House
            17.1.9.1. Overview
            17.1.9.2. Product Portfolio
            17.1.9.3. Profitability by Market Segments (Product/Age /Sales Channel/Region)
            17.1.9.4. Sales Footprint
            17.1.9.5. Strategy Overview
                17.1.9.5.1. Marketing Strategy
                17.1.9.5.2. Product Strategy
                17.1.9.5.3. Channel Strategy
        17.1.10. Hangzhou Dayangchem Co. Ltd.
            17.1.10.1. Overview
            17.1.10.2. Product Portfolio
            17.1.10.3. Profitability by Market Segments (Product/Age /Sales Channel/Region)
            17.1.10.4. Sales Footprint
            17.1.10.5. Strategy Overview
                17.1.10.5.1. Marketing Strategy
                17.1.10.5.2. Product Strategy
                17.1.10.5.3. Channel Strategy
        17.1.11. Döhler Group
            17.1.11.1. Overview
            17.1.11.2. Product Portfolio
            17.1.11.3. Profitability by Market Segments (Product/Age /Sales Channel/Region)
            17.1.11.4. Sales Footprint
            17.1.11.5. Strategy Overview
                17.1.11.5.1. Marketing Strategy
                17.1.11.5.2. Product Strategy
                17.1.11.5.3. Channel Strategy
        17.1.12. Kancor
            17.1.12.1. Overview
            17.1.12.2. Product Portfolio
            17.1.12.3. Profitability by Market Segments (Product/Age /Sales Channel/Region)
            17.1.12.4. Sales Footprint
            17.1.12.5. Strategy Overview
                17.1.12.5.1. Marketing Strategy
                17.1.12.5.2. Product Strategy
                17.1.12.5.3. Channel Strategy
        17.1.13. Kalsec Inc
            17.1.13.1. Overview
            17.1.13.2. Product Portfolio
            17.1.13.3. Profitability by Market Segments (Product/Age /Sales Channel/Region)
            17.1.13.4. Sales Footprint
            17.1.13.5. Strategy Overview
                17.1.13.5.1. Marketing Strategy
                17.1.13.5.2. Product Strategy
                17.1.13.5.3. Channel Strategy
        17.1.14. Others (On additional request)
18. Assumptions & Acronyms Used
19. Research Methodology
Recommendations

Food and Beverage

Synthetic Food Color Market

May 2024

REP-GB-15299

333 pages

Food and Beverage

Lycopene Food Colors Market

July 2022

REP-GB-15286

300 pages

Food and Beverage

Brilliant Blue FCF Colors Market

July 2022

REP-GB-15284

300 pages

Food and Beverage

Ponceau 4R Colors Market

July 2022

REP-GB-15252

300 pages

Explore Food and Beverage Insights

View Reports
Future Market Insights

Brilliant Black BN Colors Market

Schedule a Call