Blackcurrant Powder Market Size and Share Forecast Outlook 2025 to 2035

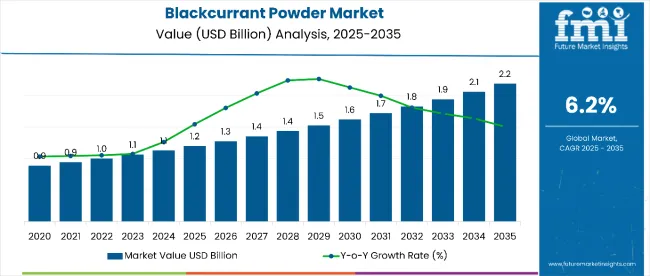
The blackcurrant powder market is estimated to be valued at USD 1.2 billion in 2025. It is projected to reach USD 2.2 billion by 2035, registering a CAGR of 6.2% over the forecast period. The market is set to generate an absolute dollar opportunity of USD 1.0 billion between 2025 and 2035, reflecting a 1.83 times growth.
Quick Stats for Blackcurrant Powder Market

  • Blackcurrant Powder Market Value (2025): USD 1.2 billion
  • Blackcurrant Powder Market Forecast Value (2035): USD 2.2 billion
  • Blackcurrant Powder Market Forecast CAGR: 6.2%
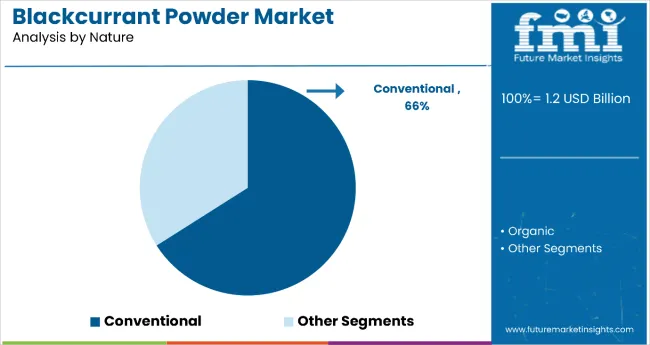
  • Leading Segment in Blackcurrant Powder Market in 2025: Conventional (66% Market Share)
  • Key Growth Regions in Blackcurrant Powder Market: North America, Europe and Asia-Pacific
  • Top Players in Blackcurrant Powder Market: Arctic Power Berries, LOOV Food, LYO FOOD Sp. z o.o, FutureCeuticals, CurrantC LLC, Z Natural Foods LLC, Active Micro Technologies, LLC (AMT), Waitaki Bio, ConnOils LLC, Northwest Wild Foods, Whitestone Mountain Orchard, NutriCargo, and Artemis Nutraceutical

Blackcurrant Powder Market

Metric Value
Estimated Value in (2025E) USD 1.2 billion
Forecast Value in (2035F) USD 2.2 billion
Forecast CAGR (2025 to 2035) 6.2%

This upward trajectory is primarily driven by heightened consumer awareness around immunity-boosting ingredients, rising demand for clean-label products, and the expanding footprint of functional foods and beverages.

By 2030, the market is expected to reach approximately USD 1.66 billion, creating an incremental opportunity of USD 460 million during the first half of the forecast period. The remaining USD 540 million is likely to be generated between 2030 and 2035, reflecting robust and sustained demand.

The surge in demand for natural antioxidants, Vitamin C-rich ingredients, and botanical extracts is prompting food and beverage manufacturers to incorporate blackcurrant powder into juices, smoothies, dietary supplements, and personal care products.

Companies such as LOOV Food and FutureCeuticals are strengthening their positions through organic product launches and sustainable sourcing initiatives. LOOV Food introduced a new line of organic blackcurrant powders in 2024, while FutureCeuticals expanded its ethical supply chain practices, reflecting the market's evolution toward health-centric, environmentally conscious innovation.

Advancements in freeze-drying and microencapsulation technologies have enhanced shelf life and nutrient retention, reinforcing blackcurrant powder’s appeal across wellness, beauty, and cosmeceutical sectors. E-commerce platforms are widening product access, particularly in high-growth economies across Asia-Pacific.

The blackcurrant powder market constitutes approximately 5.2% of the global fruit powder market, driven by rising preference for antioxidant-dense, nutrient-rich ingredients. It accounts for nearly 3.8% of the functional food ingredients segment, particularly through beverage and dietary supplement formats. In the nutraceutical sector, it represents about 4.5% share, attributed to its health-promoting polyphenol and anthocyanin profile.

Its role in dietary supplements is also notable at 3.1%, while in natural food colors and superfood categories, it holds 2.6% and 4.9% respectively. The product’s botanical identity aligns well with the clean-label and plant-based movement, further elevating its position in health-forward consumer segments.

The market is undergoing structural transformation propelled by innovations in extraction methods, improved product traceability, and growing regulatory support for superfoods and organic ingredients. Strategic collaborations with organic farms and transparent sourcing are strengthening supply chains and building consumer trust.

The adoption of blackcurrant powder in beauty-from-within products, skincare supplements, and natural colorants for functional beverages is likely to broaden application diversity over the next decade.

Analyzing Blackcurrant Powder Market by Top Investment Segments

The market is segmented by nature, end-use application, distribution channel, and region. By nature, the market is bifurcated into organic and conventional. Based on end-use application, the market includes food (bakery, dessert and ice-cream, sauces & seasonings, meat & egg replacement, beverages, flavoring & coatings, snacks & meals) and beverages (sports drinks, functional beverages, fruit juices).

In terms of distribution channel, the market is classified into direct sales and indirect sales (modern trade, convenience stores, independent grocery retailers, specialty food stores, online retail, other retail formats [such as vending machines, pop-up shops, and health expo stalls]). Regionally, the market is divided into North America, Latin America, Europe, East Asia, South Asia, Oceania, the Middle East and Africa.
By Nature, the Conventional Segment Accounts for 66% of the Market Share

Blackcurrant Powder Market By Nature

The conventional segment accounts for 66% of the nature category in the blackcurrant powder market, reflecting its dominant position in large-scale food and nutraceutical production. Conventional blackcurrant powder remains the preferred choice for manufacturers due to its affordability, wide availability, and established supply chains. It is extensively used in ready-to-drink (RTD) beverages, functional foods, and dietary supplements where volume efficiency and competitive pricing are critical.

Lower regulatory complexities compared to organic certifications further support its widespread adoption, especially in emerging markets. Mass-market consumer appeal and compatibility with industrial-scale formulations allow conventional variants to maintain a stronghold despite rising interest in clean-label and organic alternatives. As high-volume applications continue to drive demand, the conventional segment is expected to retain its leadership position through cost efficiency and operational scalability.
By Distribution Channel, Direct Sales Account for 55% of the Market Share

Blackcurrant Powder Market By Distribution Channel

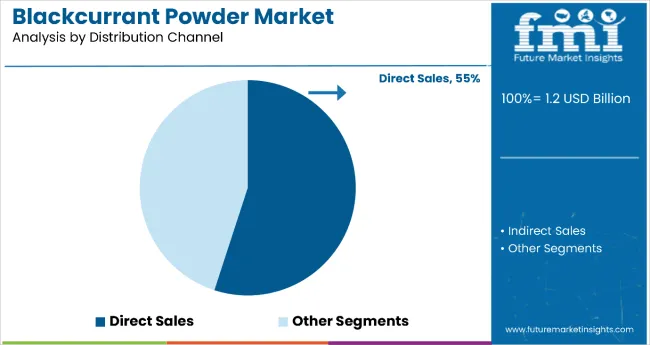
Direct sales dominate the distribution channel segment, accounting for 55% of the blackcurrant powder market in 2025. This route is favored by manufacturers for its ability to support bulk transactions with food processors, nutraceutical companies, and beverage brands. Direct sales offer pricing control, volume stability, and streamlined logistics, making it ideal for securing long-term B2B partnerships and private-label supply agreements.

Unlike retail-based distribution, direct sales channels enable tailored formulations and on-demand customization to meet the specific needs of commercial clients. This segment also enhances supply chain traceability and supplier-manufacturer integration. While online retail and specialty outlets are expanding rapidly, direct sales remain foundational for high-volume transactions and global supply agreements, securing their critical role in the value chain.

Why is the Blackcurrant Powder Market Growing?

Blackcurrant powder’s rich antioxidant profile, high vitamin C content, and natural flavoring qualities make it an appealing ingredient for health-conscious consumers and manufacturers seeking plant-based nutritional and functional enhancement solutions.

Rising awareness of immune-boosting diets and antioxidant-rich foods is driving adoption, particularly in functional beverages, dietary supplements, sports nutrition, and confectionery sectors. Government and industry initiatives promoting natural fortification, coupled with advancements in drying and encapsulation technologies, are further improving product stability, nutrient retention, and formulation flexibility.

As demand for clean-label, plant-derived, and nutrient-dense ingredients continues to accelerate, the market outlook remains positive. With both consumers and manufacturers prioritizing natural sources of antioxidants, flavor, and health benefits, blackcurrant powder is well-positioned for growth across food, beverage, nutraceutical, and cosmetic applications.

What are the Drivers, Restraints, and Key Trends of the Blackcurrant Powder Market?

In 2024, global demand for blackcurrant powder increased by 10.5% year-on-year, supported by rapid expansion in functional foods, wellness beverages, and dietary supplements. Asia-Pacific accounted for nearly 38% of new consumption, led by Japan and South Korea, where immunity-boosting and antioxidant-rich ingredients remain top consumer priorities.

Manufacturers are investing in freeze-drying and encapsulation technologies to preserve nutrient content and extend shelf life, while also introducing organic and ethically sourced variants for health-conscious and sustainability-driven markets.

Functional Nutrition and Clean-Label Movements Propel Market Growth

Consumer demand for natural, minimally processed, and functional ingredients is a primary driver of market expansion. Blackcurrant powder, rich in anthocyanins and vitamin C, is increasingly used in immunity-boosting products, sports nutrition, and anti-aging formulations. Clinical studies show that blackcurrant extract improves blood flow and reduces oxidative stress, supporting its integration in cardiovascular and cognitive health supplements.

The rise in plant-based dietary preferences and clean-label product lines has driven a 22% increase in demand across North America and Western Europe in 2024 alone. Ready-to-drink beverages and nutraceuticals represent the two largest contributors to this growth.

Seasonal Crop Dependency and Price Instability Pose Constraints

Despite rising demand, market growth is challenged by seasonal variability in blackcurrant harvests, limited cultivation zones, and climate-related yield risks. Blackcurrant crops are highly sensitive to frost and require specific temperate conditions, restricting production to a few regions like Poland, the UK, and New Zealand. This leads to supply concentration and price fluctuations of up to 18% per season. Additionally, organic variants require strict certification and extended lead times, creating challenges for rapid scalability.

Key Trends Include Cosmeceutical Applications and E-Commerce Expansion

Emerging trends include the incorporation of blackcurrant powder in cosmeceutical products and personalized nutrition formats. Online platforms now account for over 27% of global sales, providing visibility and access to specialty wellness consumers across developed and emerging markets.
Analysis of Blackcurrant Powder Market by Key Countries

Blackcurrant Powder Market Country Wise Analysis

Country CAGR (2025 to 2035)
Japan 5.9%
UK 4.7%
USA 4.3%
France 4.1%
Germany 3.9%

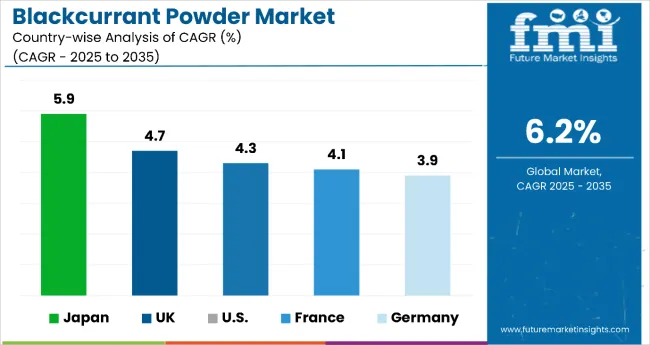
Among the top countries in the blackcurrant powder market, Japan leads with the highest CAGR of 5.9% from 2025 to 2035, driven by its aging population and strong demand for functional wellness products. The UK follows with 4.7%, supported by domestic cultivation and a preference for clean labels. The USA sees a 4.3% CAGR, fueled by rising functional food use.

France grows at 4.1%, influenced by beauty and gourmet applications, while Germany registers the slowest growth at 3.9%, despite a strong innovation ecosystem. Overall, Japan’s proactive health culture positions it as the fastest-growing market in this segment.

The report covers an in-depth analysis of 40+ countries; five top-performing OECD countries are highlighted below.
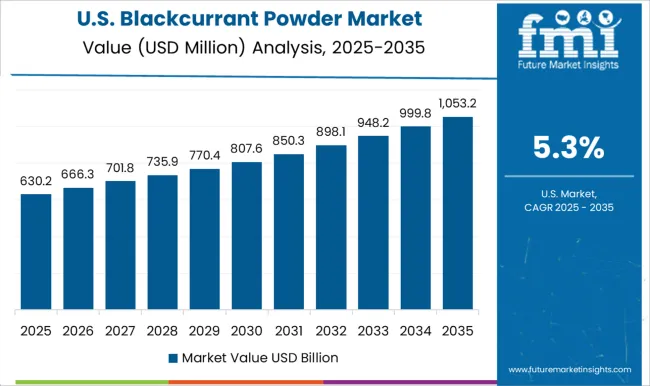
Production and Consumption Trends in the Blackcurrant Powder Market in the United States

The revenue from blackcurrant powder in the USA is projected to grow at a CAGR of 4.3% from 2025 to 2035. This growth is driven by rising consumer interest in functional nutrition, especially among health-focused millennials and aging baby boomers. The product is increasingly used in dietary supplements, wellness beverages, and fortified snack bars. The lifting of historic cultivation bans is also enabling limited domestic production, creating new sourcing opportunities and boosting local supply chains.

The USA market benefits from strong retail and e-commerce distribution networks, facilitating broader access to clean-label, antioxidant-rich formulations. With ongoing investment in health-oriented food categories and personalized nutrition, blackcurrant powder is finding growing relevance across B2C and B2B applications.

  • Over 5.4 million units of blackcurrant-infused wellness products sold in 2024
  • 37% of surveyed USA consumers link blackcurrant to immune health benefits
  • 1,120 domestic food and supplement brands now include blackcurrant powder

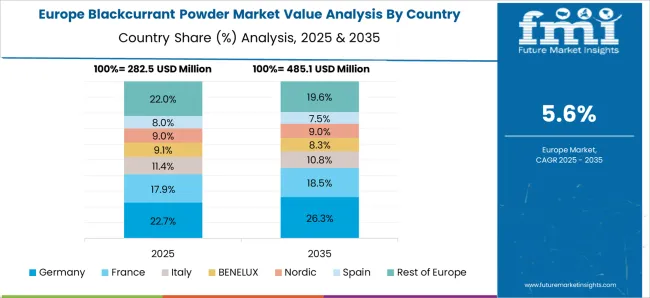
Growth Outlook for the Blackcurrant Powder Market in the United Kingdom

The blackcurrant powder market in the UK is expected to expand at a CAGR of 4.7% between 2025 and 2035. The UK boasts a long-established blackcurrant cultivation base, particularly in Scotland and Northern England, which enables traceable, locally sourced product lines. Domestic brands are emphasizing origin-based marketing and organic certification to appeal to clean-label consumers.

Applications in the UK are broadening from traditional beverages to skincare formulations and wellness supplements, supported by premiumization trends in health food retail. Seasonality aligns with summer beverage launches and immune-boosting campaigns.
  • Over 3.8 million units of blackcurrant beverages and capsules sold in 2024
  • 59% of UK dietary supplement users prefer locally sourced botanical ingredients
  • 740 brands feature British-grown blackcurrant powder in their wellness portfolios

Demand Analysis in the Blackcurrant Powder Market in Germany

The blackcurrant powder market in Germany is projected to grow at a CAGR of 3.9% from 2025 to 2035. Known for food innovation and regulatory rigor, Germany’s market emphasizes quality and scientific substantiation in product development. Functional food and supplement companies are using blackcurrant powder in immune-boosting drinks, gummies, and clean-label capsules.

Germany’s pharma-grade supplement industry is also incorporating blackcurrant in cardiovascular and anti-fatigue formulas. With strict quality certifications and a focus on plant-based wellness, Germany is emerging as a stable growth market.

  • 2.9 million functional food SKUs launched with blackcurrant ingredients in 2024
  • 71% of surveyed supplement manufacturers use EU-certified botanical extracts
  • 810 nutraceutical brands offer blackcurrant formulations across Germany

Market Development in the Blackcurrant Powder Market in France

The blackcurrant powder market in France is expected to register a CAGR of 4.1% between 2025 and 2035. France’s deep-rooted culinary tradition and domestic Ribes nigrum cultivation, especially in Burgundy, support widespread use in gourmet applications. Blackcurrant powder is gaining traction in desserts, high-end beverages, and beauty nutrition products.

In parallel, nutraceutical companies are marketing it for skin health and anti-aging benefits, supported by local R&D capabilities. Wellness-focused branding around French botanical heritage is further strengthening its appeal among consumers who prioritize authenticity and traceability.

  • 1.7 million gourmet food items containing blackcurrant powder sold in 2024
  • 33% of French nutricosmetic launches feature antioxidant-rich fruit powders
  • 920 cosmetic brands exploring blackcurrant powder in skin-nutrition hybrids

Market Insights for the Blackcurrant Powder Market in Japan

The blackcurrant powder market in Japan is anticipated to lead globally, growing at a CAGR of 5.9% from 2025 to 2035. The aging population and strong alignment with food-as-medicine traditions are key growth enablers. Japanese manufacturers are developing RTD drinks, functional jellies, and anti-aging supplements using blackcurrant powder, targeting both eldercare and beauty segments.

Innovation in product solubility, flavor enhancement, and bioavailability is enhancing consumer acceptance. Moreover, cultural familiarity with botanical wellness supports sustained demand across food, pharmaceutical, and cosmeceutical verticals.
  • 4.1 million units of blackcurrant functional beverages sold in Japan in 2024
  • 61% of surveyed consumers over age 50 use botanical supplements
  • 1,580 new beauty-from-within products launched with blackcurrant ingredients

Competitive Landscape of Blackcurrant Powder Market

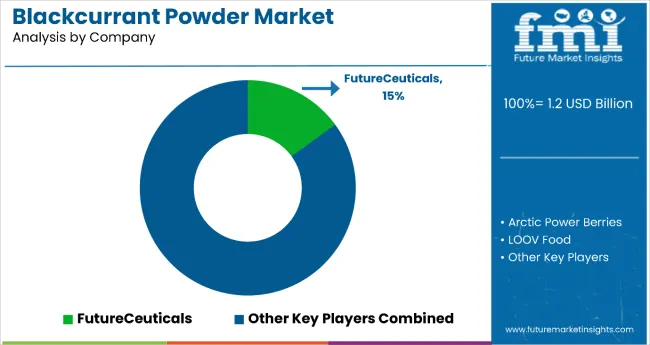
Blackcurrant Powder Market Analysis By Company

The blackcurrant powder market is fragmented, featuring a blend of large multinational players and specialized regional firms that contribute to a diverse and competitive environment. Leading companies such as FutureCeuticals, LOOV Food, and Arctic Power Berries command significant market presence through broad distribution networks, ongoing product innovation, and strategic acquisitions.

Mid-sized players like CurrantC LLC and Z Natural Foods focus on niche segments and clean-label consumer demands, leveraging direct-to-consumer approaches and collaborations within the functional food space. Pricing strategies and supply chain transparency remain critical competitive factors across this fragmented landscape.

FutureCeuticals has expanded its superfood ingredient portfolio through acquisitions, reinforcing its leadership in functional nutrition. LOOV Food is differentiating by emphasizing organic certifications and clean-label positioning to attract health-conscious consumers. Arctic Power Berries capitalizes on sustainable sourcing and Nordic purity narratives, establishing strong regional branding.

Additionally, companies like NutriCargo and Waitaki Bio prioritize traceability, premium sourcing, and nutraceutical-grade formulations to secure their foothold in B2B supply chains. Together, these strategies shape a dynamic competitive arena characterized by innovation, sustainability, and evolving consumer preferences.

Scope of Report

Item Value
Quantitative Units USD 1.2 billion
Nature Organic, Conventional
Application Food (Bakery, Dessert and Ice-cream, Sauces & Seasonings, Meat & Egg Replacement, Beverages, Flavoring & Coatings, Snacks & Meals), Beverages (Sports Drinks, Functional Beverage, Fruit Juices)
Sales Channel Direct Sales, Indirect Sales (Modern Trade, Convenience Stores, Independent Grocery Retailers, Specialty Food Stores, Online Retail, Other Retail Formats)
Regions Covered North America, Latin America, Europe, Middle East & Africa, East Asia, South Asia, Oceania
Country Covered United States, Canada, United Kingdom, Germany, France, China, Japan, South Korea, Brazil, Australia and 40+ countries
Key Companies Profiled Arctic Power Berries, LOOV Food, LYO FOOD Sp. z o.o, FutureCeuticals, CurrantC LLC, Z Natural Foods LLC, Active Micro Technologies, LLC (AMT), Waitaki Bio, ConnOils LLC, Northwest Wild Foods, Whitestone Mountain Orchard, NutriCargo, and Artemis Nutraceutical
Additional Attributes Dollar sales by value, market share analysis by region, country-wise analysis, consumer preferences for organic versus conventional variants, innovations in processing technologies, competitive landscape analysis

Key Segments

By Nature:

  • Organic
  • Conventional

By End-Use Application:

  • Food
    • Bakery
    • Dessert and Ice-cream
    • Sauces & Seasonings
    • Meat & Egg Replacement
    • Beverages
    • Flavoring & Coatings
    • Snacks & Meals
  • Beverages
    • Sports Drinks
    • Functional Beverage
    • Fruit Juices

By Distribution Channel:

  • Direct Sales
  • Indirect Sales
    • Modern Trade
    • Convenience Stores
    • Independent Grocery Retailers
    • Specialty Food Stores
    • Online Retail
    • Other Retail Formats

By Region:

  • North America
  • Latin America
  • Western Europe
  • Eastern Europe
  • East Asia
  • South Asia & Pacific
  • Middle East and Africa

Table of Content

  1. Executive Summary
    • Global Market Outlook
    • Demand-side Trends
    • Supply-side Trends
    • Technology Roadmap Analysis
    • Analysis and Recommendations
  2. Market Overview
    • Market Coverage / Taxonomy
    • Market Definition / Scope / Limitations
  3. Market Background
    • Market Dynamics
      • Drivers
      • Restraints
      • Opportunity
      • Trends
    • Scenario Forecast
      • Demand in Optimistic Scenario
      • Demand in Likely Scenario
      • Demand in Conservative Scenario
    • Opportunity Map Analysis
    • Product Life Cycle Analysis
    • Supply Chain Analysis
      • Supply Side Participants and their Roles
        • Producers
        • Mid-Level Participants (Traders/ Agents/ Brokers)
        • Wholesalers and Distributors
      • Value Added and Value Created at Node in the Supply Chain
      • List of Raw Material Suppliers
      • List of Existing and Potential Buyer’s
    • Investment Feasibility Matrix
    • Value Chain Analysis
      • Profit Margin Analysis
      • Wholesalers and Distributors
      • Retailers
    • PESTLE and Porter’s Analysis
    • Regulatory Landscape
      • By Key Regions
      • By Key Countries
    • Regional Parent Market Outlook
    • Production and Consumption Statistics
    • Import and Export Statistics
  4. Global Market Analysis 2020 to 2024 and Forecast, 2025 to 2035
    • Historical Market Size Value (USD Billion) & Volume (Metric Tons) Analysis, 2020 to 2024
    • Current and Future Market Size Value (USD Billion) & Volume (Metric Tons) Projections, 2025 to 2035
      • Y-o-Y Growth Trend Analysis
      • Absolute $ Opportunity Analysis
  5. Global Market Pricing Analysis 2020 to 2024 and Forecast 2025 to 2035
  6. Global Market Analysis 2020 to 2024 and Forecast 2025 to 2035, By Nature
    • Introduction / Key Findings
    • Historical Market Size Value (USD Billion) & Volume (Metric Tons) Analysis By Nature, 2020 to 2024
    • Current and Future Market Size Value (USD Billion) & Volume (Metric Tons) Analysis and Forecast By Nature, 2025 to 2035
      • Organic
      • Conventional
    • Y-o-Y Growth Trend Analysis By Nature, 2020 to 2024
    • Absolute $ Opportunity Analysis By Nature, 2025 to 2035
  7. Global Market Analysis 2020 to 2024 and Forecast 2025 to 2035, By End-Use Application
    • Introduction / Key Findings
    • Historical Market Size Value (USD Billion) & Volume (Metric Tons) Analysis By End-Use Application, 2020 to 2024
    • Current and Future Market Size Value (USD Billion) & Volume (Metric Tons) Analysis and Forecast By End-Use Application, 2025 to 2035
      • Food
        • Bakery
        • Dessert and Ice-cream
        • Sauces & Seasonings
        • Meat & Egg Replacement
        • Beverages
        • Flavoring & Coatings
        • Snacks & Meals
      • Beverages
        • Sports Drinks
        • Functional Beverage
        • Fruit Juices
    • Y-o-Y Growth Trend Analysis By End-Use Application, 2020 to 2024
    • Absolute $ Opportunity Analysis By End-Use Application, 2025 to 2035
  8. Global Market Analysis 2020 to 2024 and Forecast 2025 to 2035, By Distribution Channel
    • Introduction / Key Findings
    • Historical Market Size Value (USD Billion) & Volume (Metric Tons) Analysis By Distribution Channel, 2020 to 2024
    • Current and Future Market Size Value (USD Billion) & Volume (Metric Tons) Analysis and Forecast By Distribution Channel, 2025 to 2035
      • Direct Sales
      • Indirect Sales
        • Modern Trade
        • Convenience Stores
        • Independent Grocery Retailers
        • Specialty Food Stores
        • Online Retail
        • Other Retail Formats
    • Y-o-Y Growth Trend Analysis By Distribution Channel, 2020 to 2024
    • Absolute $ Opportunity Analysis By Distribution Channel, 2025 to 2035
  9. Global Market Analysis 2020 to 2024 and Forecast 2025 to 2035, By Region
    • Introduction
    • Historical Market Size Value (USD Billion) & Volume (Metric Tons) Analysis By Region, 2020 to 2024
    • Current Market Size Value (USD Billion) & Volume (Metric Tons) Analysis and Forecast By Region, 2025 to 2035
      • North America
      • Latin America
      • Western Europe
      • Eastern Europe
      • East Asia
      • South Asia & Pacific
      • Middle East and Africa
    • Market Attractiveness Analysis By Region
  10. North America Market Analysis 2020 to 2024 and Forecast 2025 to 2035, By Country
    • Historical Market Size Value (USD Billion) & Volume (Metric Tons) Trend Analysis By Market Taxonomy, 2020 to 2024
    • Market Size Value (USD Billion) & Volume (Metric Tons) Forecast By Market Taxonomy, 2025 to 2035
      • By Country
        • USA
        • Canada
        • Mexico
      • By Nature
      • By End-Use Application
      • By Distribution Channel
    • Market Attractiveness Analysis
      • By Country
      • By Nature
      • By End-Use Application
      • By Distribution Channel
    • Key Takeaways
  11. Latin America Market Analysis 2020 to 2024 and Forecast 2025 to 2035, By Country
    • Historical Market Size Value (USD Billion) & Volume (Metric Tons) Trend Analysis By Market Taxonomy, 2020 to 2024
    • Market Size Value (USD Billion) & Volume (Metric Tons) Forecast By Market Taxonomy, 2025 to 2035
      • By Country
        • Brazil
        • Argentina
        • Rest of LATAM
      • By Nature
      • By End-Use Application
      • By Distribution Channel
    • Market Attractiveness Analysis
      • By Country
      • By Nature
      • By End-Use Application
      • By Distribution Channel
    • Key Takeaways
  12. Western Europe Market Analysis 2020 to 2024 and Forecast 2025 to 2035, By Country
    • Historical Market Size Value (USD Billion) & Volume (Metric Tons) Trend Analysis By Market Taxonomy, 2020 to 2024
    • Market Size Value (USD Billion) & Volume (Metric Tons) Forecast By Market Taxonomy, 2025 to 2035
      • By Country
        • Germany
        • Italy
        • France
        • UK
        • Spain
        • BENELUX
        • Nordic
        • Rest of W.Europe
      • By Nature
      • By End-Use Application
      • By Distribution Channel
    • Market Attractiveness Analysis
      • By Country
      • By Nature
      • By End-Use Application
      • By Distribution Channel
    • Key Takeaways
  13. Eastern Europe Market Analysis 2020 to 2024 and Forecast 2025 to 2035, By Country
    • Historical Market Size Value (USD Billion) & Volume (Metric Tons) Trend Analysis By Market Taxonomy, 2020 to 2024
    • Market Size Value (USD Billion) & Volume (Metric Tons) Forecast By Market Taxonomy, 2025 to 2035
      • By Country
        • Russia
        • Hungary
        • Poland
        • Balkan & Baltics
        • Rest of E. Europe
      • By Nature
      • By End-Use Application
      • By Distribution Channel
    • Market Attractiveness Analysis
      • By Country
      • By Nature
      • By End-Use Application
      • By Distribution Channel
    • Key Takeaways
  14. East Asia Market Analysis 2020 to 2024 and Forecast 2025 to 2035, By Country
    • Historical Market Size Value (USD Billion) & Volume (Metric Tons) Trend Analysis By Market Taxonomy, 2020 to 2024
    • Market Size Value (USD Billion) & Volume (Metric Tons) Forecast By Market Taxonomy, 2025 to 2035
      • By Country
        • China
        • Japan
        • South Korea
      • By Nature
      • By End-Use Application
      • By Distribution Channel
    • Market Attractiveness Analysis
      • By Country
      • By Nature
      • By End-Use Application
      • By Distribution Channel
    • Key Takeaways
  15. South Asia & Pacific Market Analysis 2020 to 2024 and Forecast 2025 to 2035, By Country
    • Historical Market Size Value (USD Billion) & Volume (Metric Tons) Trend Analysis By Market Taxonomy, 2020 to 2024
    • Market Size Value (USD Billion) & Volume (Metric Tons) Forecast By Market Taxonomy, 2025 to 2035
      • By Country
        • India
        • Australia & New Zealand
        • ASEAN
        • Rest of SAP
      • By Nature
      • By End-Use Application
      • By Distribution Channel
    • Market Attractiveness Analysis
      • By Country
      • By Nature
      • By End-Use Application
      • By Distribution Channel
    • Key Takeaways
  16. Middle East and Africa Market Analysis 2020 to 2024 and Forecast 2025 to 2035, By Country
    • Historical Market Size Value (USD Billion) & Volume (Metric Tons) Trend Analysis By Market Taxonomy, 2020 to 2024
    • Market Size Value (USD Billion) & Volume (Metric Tons) Forecast By Market Taxonomy, 2025 to 2035
      • By Country
        • GCC Countries
        • Northern Africa
        • South Africa
        • Turkiye
        • Rest of MEA
      • By Nature
      • By End-Use Application
      • By Distribution Channel
    • Market Attractiveness Analysis
      • By Country
      • By Nature
      • By End-Use Application
      • By Distribution Channel
    • Key Takeaways
  17. Key Countries Market Analysis
    • USA
      • Pricing Analysis
      • Market Share Analysis, 2024
        • By Nature
        • By End-Use Application
        • By Distribution Channel
    • Canada
      • Pricing Analysis
      • Market Share Analysis, 2024
        • By Nature
        • By End-Use Application
        • By Distribution Channel
    • Brazil
      • Pricing Analysis
      • Market Share Analysis, 2024
        • By Nature
        • By End-Use Application
        • By Distribution Channel
    • Mexico
      • Pricing Analysis
      • Market Share Analysis, 2024
        • By Nature
        • By End-Use Application
        • By Distribution Channel
    • Argentina
      • Pricing Analysis
      • Market Share Analysis, 2024
        • By Nature
        • By End-Use Application
        • By Distribution Channel
  18. Market Structure Analysis
    • Competition Dashboard
    • Competition Benchmarking
    • Market Share Analysis of Top Players
      • By Regional
      • By Nature
      • By End-Use Application
      • By Distribution Channel
  19. Competition Analysis
    • Competition Deep Dive
      • Arctic Power Berries
        • Overview
        • Product Portfolio
        • Profitability by Market Segments (Product/Age /Sales Channel/Region)
        • Sales Footprint
        • Strategy Overview
          • Marketing Strategy
          • Product Strategy
          • Channel Strategy
      • LOOV Food
        • Overview
        • Product Portfolio
        • Profitability by Market Segments (Product/Age /Sales Channel/Region)
        • Sales Footprint
        • Strategy Overview
          • Marketing Strategy
          • Product Strategy
          • Channel Strategy
      • LYO FOOD Sp. z o.o
        • Overview
        • Product Portfolio
        • Profitability by Market Segments (Product/Age /Sales Channel/Region)
        • Sales Footprint
        • Strategy Overview
          • Marketing Strategy
          • Product Strategy
          • Channel Strategy
      • FutureCeuticals
        • Overview
        • Product Portfolio
        • Profitability by Market Segments (Product/Age /Sales Channel/Region)
        • Sales Footprint
        • Strategy Overview
          • Marketing Strategy
          • Product Strategy
          • Channel Strategy
      • CurrantC LLC
        • Overview
        • Product Portfolio
        • Profitability by Market Segments (Product/Age /Sales Channel/Region)
        • Sales Footprint
        • Strategy Overview
          • Marketing Strategy
          • Product Strategy
          • Channel Strategy
      • Z Natural Foods, LLC
        • Overview
        • Product Portfolio
        • Profitability by Market Segments (Product/Age /Sales Channel/Region)
        • Sales Footprint
        • Strategy Overview
          • Marketing Strategy
          • Product Strategy
          • Channel Strategy
      • Active Micro Technologies
        • Overview
        • Product Portfolio
        • Profitability by Market Segments (Product/Age /Sales Channel/Region)
        • Sales Footprint
        • Strategy Overview
          • Marketing Strategy
          • Product Strategy
          • Channel Strategy
      • LLC (AMT)
        • Overview
        • Product Portfolio
        • Profitability by Market Segments (Product/Age /Sales Channel/Region)
        • Sales Footprint
        • Strategy Overview
          • Marketing Strategy
          • Product Strategy
          • Channel Strategy
      • Waitaki Bio
        • Overview
        • Product Portfolio
        • Profitability by Market Segments (Product/Age /Sales Channel/Region)
        • Sales Footprint
        • Strategy Overview
          • Marketing Strategy
          • Product Strategy
          • Channel Strategy
      • ConnOils LLC
        • Overview
        • Product Portfolio
        • Profitability by Market Segments (Product/Age /Sales Channel/Region)
        • Sales Footprint
        • Strategy Overview
          • Marketing Strategy
          • Product Strategy
          • Channel Strategy
      • Northwest Wild Foods
        • Overview
        • Product Portfolio
        • Profitability by Market Segments (Product/Age /Sales Channel/Region)
        • Sales Footprint
        • Strategy Overview
          • Marketing Strategy
          • Product Strategy
          • Channel Strategy
      • Whitestone Mountain Orchard
        • Overview
        • Product Portfolio
        • Profitability by Market Segments (Product/Age /Sales Channel/Region)
        • Sales Footprint
        • Strategy Overview
          • Marketing Strategy
          • Product Strategy
          • Channel Strategy
      • NutriCargo
        • Overview
        • Product Portfolio
        • Profitability by Market Segments (Product/Age /Sales Channel/Region)
        • Sales Footprint
        • Strategy Overview
          • Marketing Strategy
          • Product Strategy
          • Channel Strategy
      • Artemis Nutraceutical
        • Overview
        • Product Portfolio
        • Profitability by Market Segments (Product/Age /Sales Channel/Region)
        • Sales Footprint
        • Strategy Overview
          • Marketing Strategy
          • Product Strategy
          • Channel Strategy
  20. Assumptions & Acronyms Used
  21. Research Methodology

List of Tables

  • Table 1: Global Market Value (USD Billion) Forecast by Region, 2020-2035
  • Table 2: Global Market Volume (Metric Tons) Forecast by Region, 2020-2035
  • Table 3: Global Market Value (USD Billion) Forecast by Nature, 2020-2035
  • Table 4: Global Market Volume (Metric Tons) Forecast by Nature, 2020-2035
  • Table 5: Global Market Value (USD Billion) Forecast by End-Use Application, 2020-2035
  • Table 6: Global Market Volume (Metric Tons) Forecast by End-Use Application, 2020-2035
  • Table 7: Global Market Value (USD Billion) Forecast by Distribution Channel, 2020-2035
  • Table 8: Global Market Volume (Metric Tons) Forecast by Distribution Channel, 2020-2035
  • Table 9: North America Market Value (USD Billion) Forecast by Country, 2020-2035
  • Table 10: North America Market Volume (Metric Tons) Forecast by Country, 2020-2035
  • Table 11: North America Market Value (USD Billion) Forecast by Nature, 2020-2035
  • Table 12: North America Market Volume (Metric Tons) Forecast by Nature, 2020-2035
  • Table 13: North America Market Value (USD Billion) Forecast by End-Use Application, 2020-2035
  • Table 14: North America Market Volume (Metric Tons) Forecast by End-Use Application, 2020-2035
  • Table 15: North America Market Value (USD Billion) Forecast by Distribution Channel, 2020-2035
  • Table 16: North America Market Volume (Metric Tons) Forecast by Distribution Channel, 2020-2035
  • Table 17: Latin America Market Value (USD Billion) Forecast by Country, 2020-2035
  • Table 18: Latin America Market Volume (Metric Tons) Forecast by Country, 2020-2035
  • Table 19: Latin America Market Value (USD Billion) Forecast by Nature, 2020-2035
  • Table 20: Latin America Market Volume (Metric Tons) Forecast by Nature, 2020-2035
  • Table 21: Latin America Market Value (USD Billion) Forecast by End-Use Application, 2020-2035
  • Table 22: Latin America Market Volume (Metric Tons) Forecast by End-Use Application, 2020-2035
  • Table 23: Latin America Market Value (USD Billion) Forecast by Distribution Channel, 2020-2035
  • Table 24: Latin America Market Volume (Metric Tons) Forecast by Distribution Channel, 2020-2035
  • Table 25: Western Europe Market Value (USD Billion) Forecast by Country, 2020-2035
  • Table 26: Western Europe Market Volume (Metric Tons) Forecast by Country, 2020-2035
  • Table 27: Western Europe Market Value (USD Billion) Forecast by Nature, 2020-2035
  • Table 28: Western Europe Market Volume (Metric Tons) Forecast by Nature, 2020-2035
  • Table 29: Western Europe Market Value (USD Billion) Forecast by End-Use Application, 2020-2035
  • Table 30: Western Europe Market Volume (Metric Tons) Forecast by End-Use Application, 2020-2035
  • Table 31: Western Europe Market Value (USD Billion) Forecast by Distribution Channel, 2020-2035
  • Table 32: Western Europe Market Volume (Metric Tons) Forecast by Distribution Channel, 2020-2035
  • Table 33: Eastern Europe Market Value (USD Billion) Forecast by Country, 2020-2035
  • Table 34: Eastern Europe Market Volume (Metric Tons) Forecast by Country, 2020-2035
  • Table 35: Eastern Europe Market Value (USD Billion) Forecast by Nature, 2020-2035
  • Table 36: Eastern Europe Market Volume (Metric Tons) Forecast by Nature, 2020-2035
  • Table 37: Eastern Europe Market Value (USD Billion) Forecast by End-Use Application, 2020-2035
  • Table 38: Eastern Europe Market Volume (Metric Tons) Forecast by End-Use Application, 2020-2035
  • Table 39: Eastern Europe Market Value (USD Billion) Forecast by Distribution Channel, 2020-2035
  • Table 40: Eastern Europe Market Volume (Metric Tons) Forecast by Distribution Channel, 2020-2035
  • Table 41: East Asia Market Value (USD Billion) Forecast by Country, 2020-2035
  • Table 42: East Asia Market Volume (Metric Tons) Forecast by Country, 2020-2035
  • Table 43: East Asia Market Value (USD Billion) Forecast by Nature, 2020-2035
  • Table 44: East Asia Market Volume (Metric Tons) Forecast by Nature, 2020-2035
  • Table 45: East Asia Market Value (USD Billion) Forecast by End-Use Application, 2020-2035
  • Table 46: East Asia Market Volume (Metric Tons) Forecast by End-Use Application, 2020-2035
  • Table 47: East Asia Market Value (USD Billion) Forecast by Distribution Channel, 2020-2035
  • Table 48: East Asia Market Volume (Metric Tons) Forecast by Distribution Channel, 2020-2035
  • Table 49: South Asia & Pacific Market Value (USD Billion) Forecast by Country, 2020-2035
  • Table 50: South Asia & Pacific Market Volume (Metric Tons) Forecast by Country, 2020-2035
  • Table 51: South Asia & Pacific Market Value (USD Billion) Forecast by Nature, 2020-2035
  • Table 52: South Asia & Pacific Market Volume (Metric Tons) Forecast by Nature, 2020-2035
  • Table 53: South Asia & Pacific Market Value (USD Billion) Forecast by End-Use Application, 2020-2035
  • Table 54: South Asia & Pacific Market Volume (Metric Tons) Forecast by End-Use Application, 2020-2035
  • Table 55: South Asia & Pacific Market Value (USD Billion) Forecast by Distribution Channel, 2020-2035
  • Table 56: South Asia & Pacific Market Volume (Metric Tons) Forecast by Distribution Channel, 2020-2035
  • Table 57: Middle East and Africa Market Value (USD Billion) Forecast by Country, 2020-2035
  • Table 58: Middle East and Africa Market Volume (Metric Tons) Forecast by Country, 2020-2035
  • Table 59: Middle East and Africa Market Value (USD Billion) Forecast by Nature, 2020-2035
  • Table 60: Middle East and Africa Market Volume (Metric Tons) Forecast by Nature, 2020-2035
  • Table 61: Middle East and Africa Market Value (USD Billion) Forecast by End-Use Application, 2020-2035
  • Table 62: Middle East and Africa Market Volume (Metric Tons) Forecast by End-Use Application, 2020-2035
  • Table 63: Middle East and Africa Market Value (USD Billion) Forecast by Distribution Channel, 2020-2035
  • Table 64: Middle East and Africa Market Volume (Metric Tons) Forecast by Distribution Channel, 2020-2035

List of Figures

  • Figure 1: Global Market Volume (Metric Tons) Forecast 2020-2035
  • Figure 2: Global Market Pricing Analysis
  • Figure 3: Global Market Value (USD Billion) Forecast 2020-2035
  • Figure 4: Global Market Value Share and BPS Analysis by Nature, 2025 and 2035
  • Figure 5: Global Market Y-o-Y Growth Comparison by Nature, 2025-2035
  • Figure 6: Global Market Attractiveness Analysis by Nature
  • Figure 7: Global Market Value Share and BPS Analysis by End-Use Application, 2025 and 2035
  • Figure 8: Global Market Y-o-Y Growth Comparison by End-Use Application, 2025-2035
  • Figure 9: Global Market Attractiveness Analysis by End-Use Application
  • Figure 10: Global Market Value Share and BPS Analysis by Distribution Channel, 2025 and 2035
  • Figure 11: Global Market Y-o-Y Growth Comparison by Distribution Channel, 2025-2035
  • Figure 12: Global Market Attractiveness Analysis by Distribution Channel
  • Figure 13: Global Market Value (USD Billion) Share and BPS Analysis by Region, 2025 and 2035
  • Figure 14: Global Market Y-o-Y Growth Comparison by Region, 2025-2035
  • Figure 15: Global Market Attractiveness Analysis by Region
  • Figure 16: North America Market Incremental $ Opportunity, 2025-2035
  • Figure 17: Latin America Market Incremental $ Opportunity, 2025-2035
  • Figure 18: Western Europe Market Incremental $ Opportunity, 2025-2035
  • Figure 19: Eastern Europe Market Incremental $ Opportunity, 2025-2035
  • Figure 20: East Asia Market Incremental $ Opportunity, 2025-2035
  • Figure 21: South Asia & Pacific Market Incremental $ Opportunity, 2025-2035
  • Figure 22: Middle East and Africa Market Incremental $ Opportunity, 2025-2035
  • Figure 23: North America Market Value Share and BPS Analysis by Country, 2025 and 2035
  • Figure 24: North America Market Value Share and BPS Analysis by Nature, 2025 and 2035
  • Figure 25: North America Market Y-o-Y Growth Comparison by Nature, 2025-2035
  • Figure 26: North America Market Attractiveness Analysis by Nature
  • Figure 27: North America Market Value Share and BPS Analysis by End-Use Application, 2025 and 2035
  • Figure 28: North America Market Y-o-Y Growth Comparison by End-Use Application, 2025-2035
  • Figure 29: North America Market Attractiveness Analysis by End-Use Application
  • Figure 30: North America Market Value Share and BPS Analysis by Distribution Channel, 2025 and 2035
  • Figure 31: North America Market Y-o-Y Growth Comparison by Distribution Channel, 2025-2035
  • Figure 32: North America Market Attractiveness Analysis by Distribution Channel
  • Figure 33: Latin America Market Value Share and BPS Analysis by Country, 2025 and 2035
  • Figure 34: Latin America Market Value Share and BPS Analysis by Nature, 2025 and 2035
  • Figure 35: Latin America Market Y-o-Y Growth Comparison by Nature, 2025-2035
  • Figure 36: Latin America Market Attractiveness Analysis by Nature
  • Figure 37: Latin America Market Value Share and BPS Analysis by End-Use Application, 2025 and 2035
  • Figure 38: Latin America Market Y-o-Y Growth Comparison by End-Use Application, 2025-2035
  • Figure 39: Latin America Market Attractiveness Analysis by End-Use Application
  • Figure 40: Latin America Market Value Share and BPS Analysis by Distribution Channel, 2025 and 2035
  • Figure 41: Latin America Market Y-o-Y Growth Comparison by Distribution Channel, 2025-2035
  • Figure 42: Latin America Market Attractiveness Analysis by Distribution Channel
  • Figure 43: Western Europe Market Value Share and BPS Analysis by Country, 2025 and 2035
  • Figure 44: Western Europe Market Value Share and BPS Analysis by Nature, 2025 and 2035
  • Figure 45: Western Europe Market Y-o-Y Growth Comparison by Nature, 2025-2035
  • Figure 46: Western Europe Market Attractiveness Analysis by Nature
  • Figure 47: Western Europe Market Value Share and BPS Analysis by End-Use Application, 2025 and 2035
  • Figure 48: Western Europe Market Y-o-Y Growth Comparison by End-Use Application, 2025-2035
  • Figure 49: Western Europe Market Attractiveness Analysis by End-Use Application
  • Figure 50: Western Europe Market Value Share and BPS Analysis by Distribution Channel, 2025 and 2035
  • Figure 51: Western Europe Market Y-o-Y Growth Comparison by Distribution Channel, 2025-2035
  • Figure 52: Western Europe Market Attractiveness Analysis by Distribution Channel
  • Figure 53: Eastern Europe Market Value Share and BPS Analysis by Country, 2025 and 2035
  • Figure 54: Eastern Europe Market Value Share and BPS Analysis by Nature, 2025 and 2035
  • Figure 55: Eastern Europe Market Y-o-Y Growth Comparison by Nature, 2025-2035
  • Figure 56: Eastern Europe Market Attractiveness Analysis by Nature
  • Figure 57: Eastern Europe Market Value Share and BPS Analysis by End-Use Application, 2025 and 2035
  • Figure 58: Eastern Europe Market Y-o-Y Growth Comparison by End-Use Application, 2025-2035
  • Figure 59: Eastern Europe Market Attractiveness Analysis by End-Use Application
  • Figure 60: Eastern Europe Market Value Share and BPS Analysis by Distribution Channel, 2025 and 2035
  • Figure 61: Eastern Europe Market Y-o-Y Growth Comparison by Distribution Channel, 2025-2035
  • Figure 62: Eastern Europe Market Attractiveness Analysis by Distribution Channel
  • Figure 63: East Asia Market Value Share and BPS Analysis by Country, 2025 and 2035
  • Figure 64: East Asia Market Value Share and BPS Analysis by Nature, 2025 and 2035
  • Figure 65: East Asia Market Y-o-Y Growth Comparison by Nature, 2025-2035
  • Figure 66: East Asia Market Attractiveness Analysis by Nature
  • Figure 67: East Asia Market Value Share and BPS Analysis by End-Use Application, 2025 and 2035
  • Figure 68: East Asia Market Y-o-Y Growth Comparison by End-Use Application, 2025-2035
  • Figure 69: East Asia Market Attractiveness Analysis by End-Use Application
  • Figure 70: East Asia Market Value Share and BPS Analysis by Distribution Channel, 2025 and 2035
  • Figure 71: East Asia Market Y-o-Y Growth Comparison by Distribution Channel, 2025-2035
  • Figure 72: East Asia Market Attractiveness Analysis by Distribution Channel
  • Figure 73: South Asia & Pacific Market Value Share and BPS Analysis by Country, 2025 and 2035
  • Figure 74: South Asia & Pacific Market Value Share and BPS Analysis by Nature, 2025 and 2035
  • Figure 75: South Asia & Pacific Market Y-o-Y Growth Comparison by Nature, 2025-2035
  • Figure 76: South Asia & Pacific Market Attractiveness Analysis by Nature
  • Figure 77: South Asia & Pacific Market Value Share and BPS Analysis by End-Use Application, 2025 and 2035
  • Figure 78: South Asia & Pacific Market Y-o-Y Growth Comparison by End-Use Application, 2025-2035
  • Figure 79: South Asia & Pacific Market Attractiveness Analysis by End-Use Application
  • Figure 80: South Asia & Pacific Market Value Share and BPS Analysis by Distribution Channel, 2025 and 2035
  • Figure 81: South Asia & Pacific Market Y-o-Y Growth Comparison by Distribution Channel, 2025-2035
  • Figure 82: South Asia & Pacific Market Attractiveness Analysis by Distribution Channel
  • Figure 83: Middle East and Africa Market Value Share and BPS Analysis by Country, 2025 and 2035
  • Figure 84: Middle East and Africa Market Value Share and BPS Analysis by Nature, 2025 and 2035
  • Figure 85: Middle East and Africa Market Y-o-Y Growth Comparison by Nature, 2025-2035
  • Figure 86: Middle East and Africa Market Attractiveness Analysis by Nature
  • Figure 87: Middle East and Africa Market Value Share and BPS Analysis by End-Use Application, 2025 and 2035
  • Figure 88: Middle East and Africa Market Y-o-Y Growth Comparison by End-Use Application, 2025-2035
  • Figure 89: Middle East and Africa Market Attractiveness Analysis by End-Use Application
  • Figure 90: Middle East and Africa Market Value Share and BPS Analysis by Distribution Channel, 2025 and 2035
  • Figure 91: Middle East and Africa Market Y-o-Y Growth Comparison by Distribution Channel, 2025-2035
  • Figure 92: Middle East and Africa Market Attractiveness Analysis by Distribution Channel
  • Figure 93: Global Market - Tier Structure Analysis
  • Figure 94: Global Market - Company Share Analysis

Frequently Asked Questions

How big is the blackcurrant powder market in 2025?

The global blackcurrant powder market is estimated to be valued at USD 1.2 billion in 2025.

What will be the size of blackcurrant powder market in 2035?

The market size for the blackcurrant powder market is projected to reach USD 2.2 billion by 2035.

How much will be the blackcurrant powder market growth between 2025 and 2035?

The blackcurrant powder market is expected to grow at a 6.2% CAGR between 2025 and 2035.

Which distribution channel is projected to lead in the blackcurrant powder market in 2025?

The direct sales channel is projected to lead in the blackcurrant powder market with 55% market share in 2025.

Which nature segment is expected to contribute significant share in the blackcurrant powder market in 2025?

The conventional segment is expected to command 66% share in the blackcurrant powder market in 2025.

Explore Similar Insights

Future Market Insights

Blackcurrant Powder Market