Barlow’s Syndrome Market
Market Insights on Barlow’s Syndrome covering sales outlook, demand forecast & up-to-date key trends
Barlow’s Syndrome Market by Type, Treatment, Diagnosis, End Users & Region | Forecast 2023 to 2033
Barlow’s Syndrome Market Snapshot (2023 to 2033)
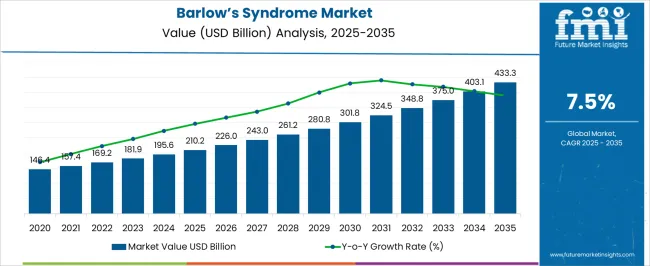
The global Barlow’s syndrome market is expected to garner a market value of US$ 181.93 Billion in 2023 and is expected to accumulate a market value of US$ 617.57 Billion by registering a CAGR of 13% in the forecast period 2023 to 2033. The growth of the Barlow’s syndrome market can be attributed to the increasing prevalence of chronic diseases and the growing geriatric population across the globe. The market for Barlow's syndrome registered a CAGR of 9.7% in the historical period 2017 to 2022
The increasing awareness about the existence and possible diagnostics of rare diseases such as Barlow’s Syndrome, and others is a prime factor augmenting the growth of this market. Furthermore, rising healthcare expenditures and demand for new treatments for rare diseases drive market expansion. The rapid development of the healthcare sector, coupled with improving medical expenditure, and the growing demand for diagnostic services, are likely to help promote the growth of this market.
Report Attribute |
Details |
Expected Market Value (2023) |
US$ 181.93 Billion |
Anticipated Forecast Value (2033) |
US$ 617.57 Billion |
Projected Growth Rate (2023 to 2033) |
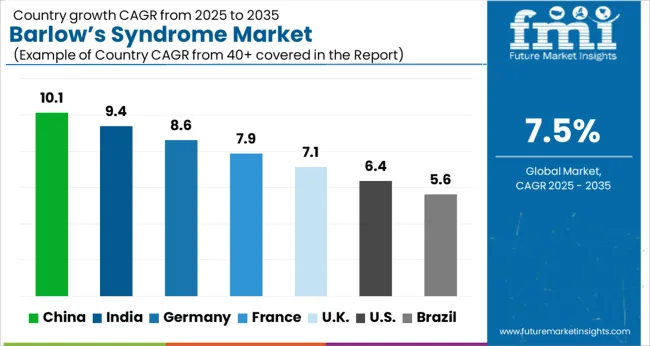
7.5% CAGR |
Let us know your requirement to get
100% FREE customization
2017 to 2022 Barlow’s Syndrome Market Demand Analysis vs. Forecast 2023 to 2033
According to market research and competitive intelligence provider Future Market Insights- the market for Barlow’s syndrome reflected a value of 9.7% during the historical period, 2017 to 2022.
Nearly 5% to 10% of people in the world suffer from Barlow’s syndrome. This, in turn, has created a huge opportunity for the market. Although the COVID-19 pandemic affected the medication and therapeutic treatment for the market owing to the supply chain disruption across the globe, in the upcoming years, research and development initiatives are expected to positively influence the demand for Barlow’s syndrome market.
Thus, the market for Barlow’s syndrome is expected to register a CAGR of 13% in the forecast period 2023 to 2033.
Which are Some Prominent Drivers of Barlow’s Syndrome Market?
Numerous health problems are key drivers of the Barlow's syndrome market
Barlow’s syndrome is an abnormality of the mitral valve of the heart. It is a condition in which the leaflets of the mitral valve swell and shifts towards the left atrium of the heart as the valve closes during ventricular contraction. This abnormality prevents the valve from closing suitably, which causes it to leak.
Barlow’s Syndrome can be caused by various reasons, some of which are calcium buildup, congenital heart defects, radiation treatment, and tumors. Additionally, traumatic injury, disease, or infection can lead to Barlow’s Syndrome.
Geriatric population contributing to Barlow's syndrome market growth
The Barlow’s Syndrome market is estimated to lead a healthy growth. The Barlow’s Syndrome market is majorly driven by the increasing geriatric population, rising global population, and rising cardiovascular disorders. According to a report published by the US
Population Reference Bureau, nearly 46 Billion people aged 65 years or more in 2014, and the report estimates that this number would double to reach nearly 98 Billion people by the end of 2060. Similarly, the 65-and-older age group would reach up to nearly 24% by 2030 from 15% as of 2015.
Find your sweet spots for generating winning opportunities in this market.
Talk to AnalystWhat are the Challenges Faced by the Barlow’s Syndrome Market?
Lack of awareness regarding Barlow's syndrome hampering the market growth
Although Barlow’s syndrome is increasing across the globe, the time taken for approval for medications from healthcare authorities is derailing the progress of the market. Moreover, the identification of Barlow’s syndrome in later stages along with a lack of awareness of the effects of Barlow’s syndrome is hampering the growth of the market.
Region-Wise Insights
Rising Number of Cardiovascular Disorders in North America Creating Lucrative Opportunities for Barlow’s Syndrome Market?
Government healthcare initiatives and growing research and development activities supporting market growth in North America
North America holds the maximum share of the Barlow’s Syndrome market in the Americas region. On a regional basis, the Americas region is segmented into North America and South America. North America is segmented into the US and Canada. The increasing geriatric population, rising number of cardiovascular disorders, and growing population have increased the scope of the Barlow’s Syndrome market in the North American market.
In addition, the availability of advanced treatment facilities, increasing cardiovascular diseases, and skilled medical professionals are propelling the growth of the Barlow’s Syndrome market in the North American region. Additionally, increasing government healthcare initiatives and growing research and development activities supported by the government to provide better healthcare treatments are likely to boost market growth. Thus, North America is expected to possess a 45% market share for Barlow’s syndrome market in 2023.
Increasing Prevalence of Chronic Diseases Bolstering the Number of People Suffering from Barlow’s Syndrome Market?
Development of healthcare infrastructure and skilled healthcare providers strengthening treatment for Barlow's syndrome
The Asia Pacific is expected to be the fastest-growing Barlow’s Syndrome market owing to the increasing incidence of chronic diseases, and fetal disorders. India is the fastest growing region owing to the increasing population and increasing geriatric population. Rising awareness, the growing standard of living, and the availability of new treatment methods are likely to drive market growth in this region.
Owing to the development of healthcare infrastructure and skilled healthcare providers, China, Japan, and India are expected to account for the largest market share. Thus, Asia Pacific is expected to share 37% market share for Barlow’s syndrome market in 2023.

A unified Market Research Subscription Platform, built for today's disparate research needs.
Category-Wise Insights
Accuracy of Results Increasing Dependability on Echocardiogram for Barlow’s Syndrome?
Precise results and ease of performing tests make echocardiogram a popular test option
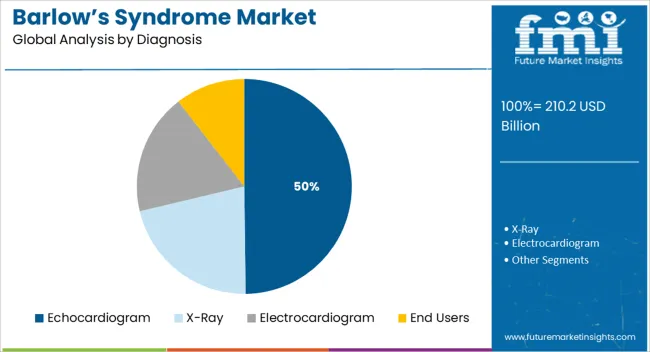
On the basis of diagnosis Barlow’s syndrome market is segmented into echocardiogram, electrocardiogram (ECG) chest x-ray, cardiac MRI, Holter monitor, pulse oximetry, exercise stress test, electrophysiology study, and cardiac catheterization.
Echocardiogram has gained immense popularity owing to the accurate results it offers. The test uses sound waves to produce detailed images of the heart. Thus, it is a safer option to determine the presence of Barlow’s syndrome in children. Furthermore, doctors too have recommended and favored the use of einstein’s anomaly owing to the ease of performing the test and the precise results it offers.
Thus, an echocardiogram is expected to possess a 33% market share for Barlow’s syndrome market in 2023.
Availability of Various Treatments Making Hospitals the Go-to Option for Treatment for Barlow’s Syndrome Market?
Favorable reimbursement policies make hospitals a viable option for treatment
On the basis of end users, the Barlow’s syndrome market is segmented into hospitals & surgical centers, and specialty clinics.
The hospital segment is expected to hold the largest market share for Barlow’s syndrome. This is owing to the availability of various treatments and diagnostics in hospitals. In addition, the presence of healthcare experts and cardiologists is playing a key role in the wide usage of hospitals for the treatment of Barlow’s syndrome.
In addition, initiatives by government authorities to support the treatment of Barlow’s syndrome, especially in hospitals are favoring the growth of the same. Moreover, reimbursement schemes and their benefits are making hospitals a go-to option for the treatment of Barlow’s syndrome. Thus, hospitals are expected to hold a 50% market share of Barlow’s syndrome market in 2023.
Market Competition
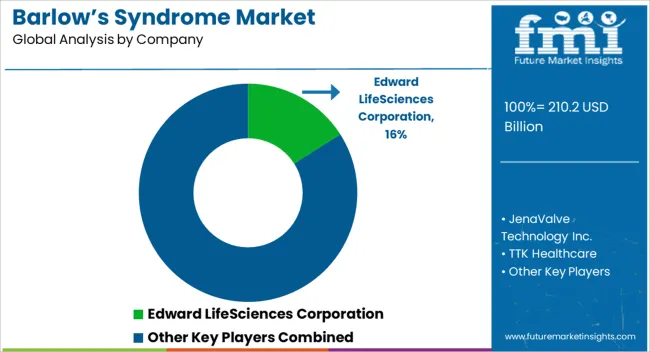
Key players in the Barlow's syndrome market are JenaValve Technology Inc, TTK Healthcare, Lepu Medical Technology Co. Ltd, Abbott Medtronic, Sorin Group, Micro Interventional Devices Inc, Boston Scientific Corporation, CryoLife Inc, Edward Lifesciences Corporation, Medtronic
- JenaValve Technology Inc, a key player in the Barlow’s syndrome market is focusing on investing in research and development for innovating medications for Barlow’s syndrome market.
- Boston Scientific Corporation, another key player in the Barlow’s syndrome market is focusing on integrating technology to accelerate manufacturing medication for treating Barlow’s syndrome.
Report Scope
Report Attribute |
Details |
Market Value in 2023 |
US$ 181.93 Billion |
Market Value in 2033 |
US$ 617.57 Billion |
Growth Rate |
CAGR of 13% from 2023 to 2033 |
Base Year for Estimation |
2022 |
Historical Data |
2017 to 2022 |
Forecast Period |
2023 to 2033 |
Quantitative Units |
Revenue in USD Billion and CAGR from 2023 to 2033 |
Report Coverage |
Revenue Forecast, Volume Forecast, Company Ranking, Competitive Landscape, Growth Factors, Trends, and Pricing Analysis |
Segments Covered |
|
Regions Covered |
|
Key Countries Profiled |
|
Key Companies Profiled |
|
Customization |
Available Upon Request |
Key Segments Profiled in the Barlow’s Syndrome Market Survey
Type:
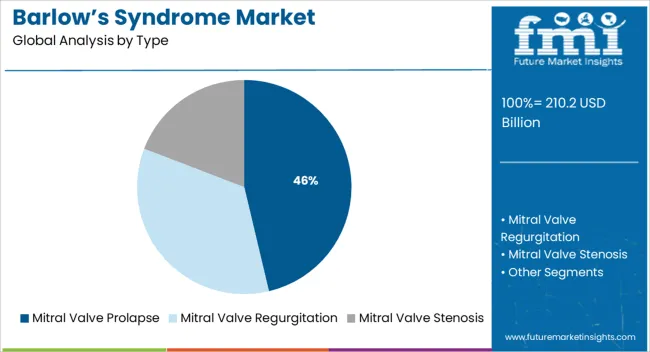
- Mitral Valve Regurgitation
- Mitral Valve Stenosis
- Mitral Valve Prolapse
Treatment:
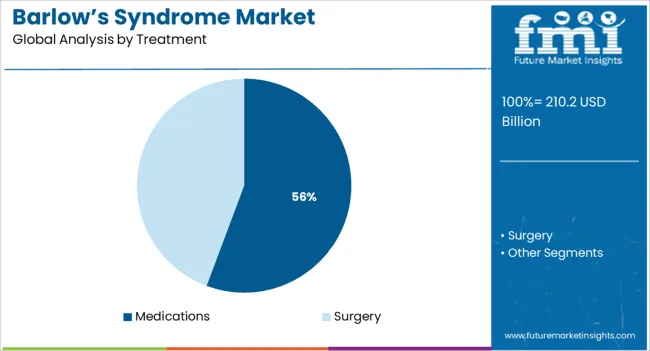
- Medications
- Beta-Blockers
- Calcium Blockers
- Surgery
Diagnosis:
- X-Ray
- Echocardiogram
- Electrocardiogram
End Users:
- Specialty Clinics
- Research Institutes
- Hospitals & Surgical Centers
Region:
- North America
- Latin America
- Europe
- South Asia
- East Asia
- Oceania
- Middle East & Africa (MEA)
Frequently Asked Questions
At what rate did the Barlow’s syndrome market flourish from 2018 to 2022?
From 2017 to 2022, the Barlow’s syndrome market grew at a CAGR of 9.7%
What will be the growth rate of the global Barlow’s syndrome market during the forecast period?
The global Barlow’s syndrome market is expected to grow with a 13% CAGR from 2023 to 2033.
What will be the projected market size of the Barlow’s syndrome market by 2033?
As of 2033, the Barlow’s syndrome market is expected to reach US$ 617.57 Billion
Which end user segment is expected to dominate the global Barlow’s syndrome market during 2033?
The hospital’s segment is expected to hold 50% of the market share in 2023 for Barlow’s syndrome market.
Which type of diagnosis is expected to dominate the global Barlow’s syndrome market during 2033?
Echocardiogram is expected to possess a 33% market share for Barlow’s syndrome market in 2023.
How is the North America Barlow’s syndrome market projected to grow in 2033?
North America is expected to possess a 40% market share for Barlow’s syndrome market in 2023.
How is the Asia Pacific Barlow’s syndrome market projected to grow in 2033?
Asia Pacific Barlow’s syndrome market size is expected to possess a 35% market share in 2023.
Table of Content
1. Executive Summary | Barlow’s Syndrome Market 1.1. Global Market Outlook 1.2. Demand-side Trends 1.3. Supply-side Trends 1.4. Technology Roadmap Analysis 1.5. Analysis and Recommendations 2. Market Overview 2.1. Market Coverage / Taxonomy 2.2. Market Definition / Scope / Limitations 3. Market Background 3.1. Market Dynamics 3.1.1. Drivers 3.1.2. Restraints 3.1.3. Opportunity 3.1.4. Trends 3.2. Scenario Forecast 3.2.1. Demand in Optimistic Scenario 3.2.2. Demand in Likely Scenario 3.2.3. Demand in Conservative Scenario 3.3. Opportunity Map Analysis 3.4. Investment Feasibility Matrix 3.5. PESTLE and Porter’s Analysis 3.6. Regulatory Landscape 3.6.1. By Key Regions 3.6.2. By Key Countries 3.7. Regional Parent Market Outlook 4. Global Market Analysis 2018 to 2022 and Forecast, 2023 to 2033 4.1. Historical Market Size Value (US$ Million) Analysis, 2018 to 2022 4.2. Current and Future Market Size Value (US$ Million) Projections, 2023 to 2033 4.2.1. Y-o-Y Growth Trend Analysis 4.2.2. Absolute $ Opportunity Analysis 5. Global Market Analysis 2018 to 2022 and Forecast 2023 to 2033, By Type 5.1. Introduction / Key Findings 5.2. Historical Market Size Value (US$ Million) Analysis By Type, 2018 to 2022 5.3. Current and Future Market Size Value (US$ Million) Analysis and Forecast By Type, 2023 to 2033 5.3.1. Mitral Valve Regurgitation 5.3.2. Mitral Valve Stenosis 5.3.3. Mitral Valve Prolapse 5.4. Y-o-Y Growth Trend Analysis By Type, 2018 to 2022 5.5. Absolute $ Opportunity Analysis By Type, 2023 to 2033 6. Global Market Analysis 2018 to 2022 and Forecast 2023 to 2033, By Treatment 6.1. Introduction / Key Findings 6.2. Historical Market Size Value (US$ Million) Analysis By Treatment, 2018 to 2022 6.3. Current and Future Market Size Value (US$ Million) Analysis and Forecast By Treatment, 2023 to 2033 6.3.1. Medications 6.3.1.1. Beta-Blockers 6.3.1.2. Calcium Blockers 6.3.2. Surgery 6.4. Y-o-Y Growth Trend Analysis By Treatment, 2018 to 2022 6.5. Absolute $ Opportunity Analysis By Treatment, 2023 to 2033 7. Global Market Analysis 2018 to 2022 and Forecast 2023 to 2033, By Diagnosis 7.1. Introduction / Key Findings 7.2. Historical Market Size Value (US$ Million) Analysis By Diagnosis , 2018 to 2022 7.3. Current and Future Market Size Value (US$ Million) Analysis and Forecast By Diagnosis , 2023 to 2033 7.3.1. X-Ray 7.3.2. Echocardiogram 7.3.3. Electrocardiogram 7.4. Y-o-Y Growth Trend Analysis By Diagnosis , 2018 to 2022 7.5. Absolute $ Opportunity Analysis By Diagnosis , 2023 to 2033 8. Global Market Analysis 2018 to 2022 and Forecast 2023 to 2033, By End Users 8.1. Introduction / Key Findings 8.2. Historical Market Size Value (US$ Million) Analysis By End Users, 2018 to 2022 8.3. Current and Future Market Size Value (US$ Million) Analysis and Forecast By End Users, 2023 to 2033 8.3.1. Specialty Clinics 8.3.2. Research Institutes 8.3.3. Hospitals & Surgical Centers 8.4. Y-o-Y Growth Trend Analysis By End Users, 2018 to 2022 8.5. Absolute $ Opportunity Analysis By End Users, 2023 to 2033 9. Global Market Analysis 2018 to 2022 and Forecast 2023 to 2033, By Region 9.1. Introduction 9.2. Historical Market Size Value (US$ Million) Analysis By Region, 2018 to 2022 9.3. Current Market Size Value (US$ Million) Analysis and Forecast By Region, 2023 to 2033 9.3.1. North America 9.3.2. Latin America 9.3.3. Europe 9.3.4. South Asia 9.3.5. East Asia 9.3.6. Oceania 9.3.7. MEA 9.4. Market Attractiveness Analysis By Region 10. North America Market Analysis 2018 to 2022 and Forecast 2023 to 2033, By Country 10.1. Historical Market Size Value (US$ Million) Trend Analysis By Market Taxonomy, 2018 to 2022 10.2. Market Size Value (US$ Million) Forecast By Market Taxonomy, 2023 to 2033 10.2.1. By Country 10.2.1.1. The US 10.2.1.2. Canada 10.2.2. By Type 10.2.3. By Treatment 10.2.4. By Diagnosis 10.2.5. By End Users 10.3. Market Attractiveness Analysis 10.3.1. By Country 10.3.2. By Type 10.3.3. By Treatment 10.3.4. By Diagnosis 10.3.5. By End Users 10.4. Key Takeaways 11. Latin America Market Analysis 2018 to 2022 and Forecast 2023 to 2033, By Country 11.1. Historical Market Size Value (US$ Million) Trend Analysis By Market Taxonomy, 2018 to 2022 11.2. Market Size Value (US$ Million) Forecast By Market Taxonomy, 2023 to 2033 11.2.1. By Country 11.2.1.1. Brazil 11.2.1.2. Mexico 11.2.1.3. Rest of Latin America 11.2.2. By Type 11.2.3. By Treatment 11.2.4. By Diagnosis 11.2.5. By End Users 11.3. Market Attractiveness Analysis 11.3.1. By Country 11.3.2. By Type 11.3.3. By Treatment 11.3.4. By Diagnosis 11.3.5. By End Users 11.4. Key Takeaways 12. Europe Market Analysis 2018 to 2022 and Forecast 2023 to 2033, By Country 12.1. Historical Market Size Value (US$ Million) Trend Analysis By Market Taxonomy, 2018 to 2022 12.2. Market Size Value (US$ Million) Forecast By Market Taxonomy, 2023 to 2033 12.2.1. By Country 12.2.1.1. Germany 12.2.1.2. The UK 12.2.1.3. France 12.2.1.4. Spain 12.2.1.5. Italy 12.2.1.6. Rest of Europe 12.2.2. By Type 12.2.3. By Treatment 12.2.4. By Diagnosis 12.2.5. By End Users 12.3. Market Attractiveness Analysis 12.3.1. By Country 12.3.2. By Type 12.3.3. By Treatment 12.3.4. By Diagnosis 12.3.5. By End Users 12.4. Key Takeaways 13. South Asia Market Analysis 2018 to 2022 and Forecast 2023 to 2033, By Country 13.1. Historical Market Size Value (US$ Million) Trend Analysis By Market Taxonomy, 2018 to 2022 13.2. Market Size Value (US$ Million) Forecast By Market Taxonomy, 2023 to 2033 13.2.1. By Country 13.2.1.1. India 13.2.1.2. Malaysia 13.2.1.3. Singapore 13.2.1.4. Thailand 13.2.1.5. Rest of South Asia 13.2.2. By Type 13.2.3. By Treatment 13.2.4. By Diagnosis 13.2.5. By End Users 13.3. Market Attractiveness Analysis 13.3.1. By Country 13.3.2. By Type 13.3.3. By Treatment 13.3.4. By Diagnosis 13.3.5. By End Users 13.4. Key Takeaways 14. East Asia Market Analysis 2018 to 2022 and Forecast 2023 to 2033, By Country 14.1. Historical Market Size Value (US$ Million) Trend Analysis By Market Taxonomy, 2018 to 2022 14.2. Market Size Value (US$ Million) Forecast By Market Taxonomy, 2023 to 2033 14.2.1. By Country 14.2.1.1. China 14.2.1.2. Japan 14.2.1.3. South Korea 14.2.2. By Type 14.2.3. By Treatment 14.2.4. By Diagnosis 14.2.5. By End Users 14.3. Market Attractiveness Analysis 14.3.1. By Country 14.3.2. By Type 14.3.3. By Treatment 14.3.4. By Diagnosis 14.3.5. By End Users 14.4. Key Takeaways 15. Oceania Market Analysis 2018 to 2022 and Forecast 2023 to 2033, By Country 15.1. Historical Market Size Value (US$ Million) Trend Analysis By Market Taxonomy, 2018 to 2022 15.2. Market Size Value (US$ Million) Forecast By Market Taxonomy, 2023 to 2033 15.2.1. By Country 15.2.1.1. Australia 15.2.1.2. New Zealand 15.2.2. By Type 15.2.3. By Treatment 15.2.4. By Diagnosis 15.2.5. By End Users 15.3. Market Attractiveness Analysis 15.3.1. By Country 15.3.2. By Type 15.3.3. By Treatment 15.3.4. By Diagnosis 15.3.5. By End Users 15.4. Key Takeaways 16. MEA Market Analysis 2018 to 2022 and Forecast 2023 to 2033, By Country 16.1. Historical Market Size Value (US$ Million) Trend Analysis By Market Taxonomy, 2018 to 2022 16.2. Market Size Value (US$ Million) Forecast By Market Taxonomy, 2023 to 2033 16.2.1. By Country 16.2.1.1. GCC Countries 16.2.1.2. South Africa 16.2.1.3. Israel 16.2.1.4. Rest of MEA 16.2.2. By Type 16.2.3. By Treatment 16.2.4. By Diagnosis 16.2.5. By End Users 16.3. Market Attractiveness Analysis 16.3.1. By Country 16.3.2. By Type 16.3.3. By Treatment 16.3.4. By Diagnosis 16.3.5. By End Users 16.4. Key Takeaways 17. Key Countries Market Analysis 17.1. U.S. 17.1.1. Pricing Analysis 17.1.2. Market Share Analysis, 2022 17.1.2.1. By Type 17.1.2.2. By Treatment 17.1.2.3. By Diagnosis 17.1.2.4. By End Users 17.2. Canada 17.2.1. Pricing Analysis 17.2.2. Market Share Analysis, 2022 17.2.2.1. By Type 17.2.2.2. By Treatment 17.2.2.3. By Diagnosis 17.2.2.4. By End Users 17.3. Brazil 17.3.1. Pricing Analysis 17.3.2. Market Share Analysis, 2022 17.3.2.1. By Type 17.3.2.2. By Treatment 17.3.2.3. By Diagnosis 17.3.2.4. By End Users 17.4. Mexico 17.4.1. Pricing Analysis 17.4.2. Market Share Analysis, 2022 17.4.2.1. By Type 17.4.2.2. By Treatment 17.4.2.3. By Diagnosis 17.4.2.4. By End Users 17.5. Germany 17.5.1. Pricing Analysis 17.5.2. Market Share Analysis, 2022 17.5.2.1. By Type 17.5.2.2. By Treatment 17.5.2.3. By Diagnosis 17.5.2.4. By End Users 17.6. U.K. 17.6.1. Pricing Analysis 17.6.2. Market Share Analysis, 2022 17.6.2.1. By Type 17.6.2.2. By Treatment 17.6.2.3. By Diagnosis 17.6.2.4. By End Users 17.7. France 17.7.1. Pricing Analysis 17.7.2. Market Share Analysis, 2022 17.7.2.1. By Type 17.7.2.2. By Treatment 17.7.2.3. By Diagnosis 17.7.2.4. By End Users 17.8. Spain 17.8.1. Pricing Analysis 17.8.2. Market Share Analysis, 2022 17.8.2.1. By Type 17.8.2.2. By Treatment 17.8.2.3. By Diagnosis 17.8.2.4. By End Users 17.9. Italy 17.9.1. Pricing Analysis 17.9.2. Market Share Analysis, 2022 17.9.2.1. By Type 17.9.2.2. By Treatment 17.9.2.3. By Diagnosis 17.9.2.4. By End Users 17.10. India 17.10.1. Pricing Analysis 17.10.2. Market Share Analysis, 2022 17.10.2.1. By Type 17.10.2.2. By Treatment 17.10.2.3. By Diagnosis 17.10.2.4. By End Users 17.11. Malaysia 17.11.1. Pricing Analysis 17.11.2. Market Share Analysis, 2022 17.11.2.1. By Type 17.11.2.2. By Treatment 17.11.2.3. By Diagnosis 17.11.2.4. By End Users 17.12. Singapore 17.12.1. Pricing Analysis 17.12.2. Market Share Analysis, 2022 17.12.2.1. By Type 17.12.2.2. By Treatment 17.12.2.3. By Diagnosis 17.12.2.4. By End Users 17.13. Thailand 17.13.1. Pricing Analysis 17.13.2. Market Share Analysis, 2022 17.13.2.1. By Type 17.13.2.2. By Treatment 17.13.2.3. By Diagnosis 17.13.2.4. By End Users 17.14. China 17.14.1. Pricing Analysis 17.14.2. Market Share Analysis, 2022 17.14.2.1. By Type 17.14.2.2. By Treatment 17.14.2.3. By Diagnosis 17.14.2.4. By End Users 17.15. Japan 17.15.1. Pricing Analysis 17.15.2. Market Share Analysis, 2022 17.15.2.1. By Type 17.15.2.2. By Treatment 17.15.2.3. By Diagnosis 17.15.2.4. By End Users 17.16. South Korea 17.16.1. Pricing Analysis 17.16.2. Market Share Analysis, 2022 17.16.2.1. By Type 17.16.2.2. By Treatment 17.16.2.3. By Diagnosis 17.16.2.4. By End Users 17.17. Australia 17.17.1. Pricing Analysis 17.17.2. Market Share Analysis, 2022 17.17.2.1. By Type 17.17.2.2. By Treatment 17.17.2.3. By Diagnosis 17.17.2.4. By End Users 17.18. New Zealand 17.18.1. Pricing Analysis 17.18.2. Market Share Analysis, 2022 17.18.2.1. By Type 17.18.2.2. By Treatment 17.18.2.3. By Diagnosis 17.18.2.4. By End Users 17.19. GCC Countries 17.19.1. Pricing Analysis 17.19.2. Market Share Analysis, 2022 17.19.2.1. By Type 17.19.2.2. By Treatment 17.19.2.3. By Diagnosis 17.19.2.4. By End Users 17.20. South Africa 17.20.1. Pricing Analysis 17.20.2. Market Share Analysis, 2022 17.20.2.1. By Type 17.20.2.2. By Treatment 17.20.2.3. By Diagnosis 17.20.2.4. By End Users 17.21. Israel 17.21.1. Pricing Analysis 17.21.2. Market Share Analysis, 2022 17.21.2.1. By Type 17.21.2.2. By Treatment 17.21.2.3. By Diagnosis 17.21.2.4. By End Users 18. Market Structure Analysis 18.1. Competition Dashboard 18.2. Competition Benchmarking 18.3. Market Share Analysis of Top Players 18.3.1. By Regional 18.3.2. By Type 18.3.3. By Treatment 18.3.4. By Diagnosis 18.3.5. By End Users 19. Competition Analysis 19.1. Competition Deep Dive 19.1.1. JenaValve Technology Inc. 19.1.1.1. Overview 19.1.1.2. Product Portfolio 19.1.1.3. Profitability by Market Segments 19.1.1.4. Sales Footprint 19.1.1.5. Strategy Overview 19.1.1.5.1. Marketing Strategy 19.1.2. TTK Healthcare 19.1.2.1. Overview 19.1.2.2. Product Portfolio 19.1.2.3. Profitability by Market Segments 19.1.2.4. Sales Footprint 19.1.2.5. Strategy Overview 19.1.2.5.1. Marketing Strategy 19.1.3. Lepu Medical Technology Co. Ltd. 19.1.3.1. Overview 19.1.3.2. Product Portfolio 19.1.3.3. Profitability by Market Segments 19.1.3.4. Sales Footprint 19.1.3.5. Strategy Overview 19.1.3.5.1. Marketing Strategy 19.1.4. Abbott Medtronic 19.1.4.1. Overview 19.1.4.2. Product Portfolio 19.1.4.3. Profitability by Market Segments 19.1.4.4. Sales Footprint 19.1.4.5. Strategy Overview 19.1.4.5.1. Marketing Strategy 19.1.5. Sorin Group 19.1.5.1. Overview 19.1.5.2. Product Portfolio 19.1.5.3. Profitability by Market Segments 19.1.5.4. Sales Footprint 19.1.5.5. Strategy Overview 19.1.5.5.1. Marketing Strategy 19.1.6. Micro Interventional Devices Inc. 19.1.6.1. Overview 19.1.6.2. Product Portfolio 19.1.6.3. Profitability by Market Segments 19.1.6.4. Sales Footprint 19.1.6.5. Strategy Overview 19.1.6.5.1. Marketing Strategy 19.1.7. Boston Scientific Corporation 19.1.7.1. Overview 19.1.7.2. Product Portfolio 19.1.7.3. Profitability by Market Segments 19.1.7.4. Sales Footprint 19.1.7.5. Strategy Overview 19.1.7.5.1. Marketing Strategy 19.1.8. CryoLife Inc. 19.1.8.1. Overview 19.1.8.2. Product Portfolio 19.1.8.3. Profitability by Market Segments 19.1.8.4. Sales Footprint 19.1.8.5. Strategy Overview 19.1.8.5.1. Marketing Strategy 19.1.9. Edward LifeSciences Corporation 19.1.9.1. Overview 19.1.9.2. Product Portfolio 19.1.9.3. Profitability by Market Segments 19.1.9.4. Sales Footprint 19.1.9.5. Strategy Overview 19.1.9.5.1. Marketing Strategy 19.1.10. Medtronic 19.1.10.1. Overview 19.1.10.2. Product Portfolio 19.1.10.3. Profitability by Market Segments 19.1.10.4. Sales Footprint 19.1.10.5. Strategy Overview 19.1.10.5.1. Marketing Strategy 20. Assumptions & Acronyms Used 21. Research Methodology
Let us know your requirement to get
100% FREE customization
List of Tables
Table 1: Global Market Value (US$ Million) Forecast by Region, 2018 to 2033 Table 2: Global Market Value (US$ Million) Forecast by Type, 2018 to 2033 Table 3: Global Market Value (US$ Million) Forecast by Treatment, 2018 to 2033 Table 4: Global Market Value (US$ Million) Forecast by Diagnosis, 2018 to 2033 Table 5: Global Market Value (US$ Million) Forecast by End Users, 2018 to 2033 Table 6: North America Market Value (US$ Million) Forecast by Country, 2018 to 2033 Table 7: North America Market Value (US$ Million) Forecast by Type, 2018 to 2033 Table 8: North America Market Value (US$ Million) Forecast by Treatment, 2018 to 2033 Table 9: North America Market Value (US$ Million) Forecast by Diagnosis, 2018 to 2033 Table 10: North America Market Value (US$ Million) Forecast by End Users, 2018 to 2033 Table 11: Latin America Market Value (US$ Million) Forecast by Country, 2018 to 2033 Table 12: Latin America Market Value (US$ Million) Forecast by Type, 2018 to 2033 Table 13: Latin America Market Value (US$ Million) Forecast by Treatment, 2018 to 2033 Table 14: Latin America Market Value (US$ Million) Forecast by Diagnosis, 2018 to 2033 Table 15: Latin America Market Value (US$ Million) Forecast by End Users, 2018 to 2033 Table 16: Europe Market Value (US$ Million) Forecast by Country, 2018 to 2033 Table 17: Europe Market Value (US$ Million) Forecast by Type, 2018 to 2033 Table 18: Europe Market Value (US$ Million) Forecast by Treatment, 2018 to 2033 Table 19: Europe Market Value (US$ Million) Forecast by Diagnosis, 2018 to 2033 Table 20: Europe Market Value (US$ Million) Forecast by End Users, 2018 to 2033 Table 21: South Asia Market Value (US$ Million) Forecast by Country, 2018 to 2033 Table 22: South Asia Market Value (US$ Million) Forecast by Type, 2018 to 2033 Table 23: South Asia Market Value (US$ Million) Forecast by Treatment, 2018 to 2033 Table 24: South Asia Market Value (US$ Million) Forecast by Diagnosis, 2018 to 2033 Table 25: South Asia Market Value (US$ Million) Forecast by End Users, 2018 to 2033 Table 26: East Asia Market Value (US$ Million) Forecast by Country, 2018 to 2033 Table 27: East Asia Market Value (US$ Million) Forecast by Type, 2018 to 2033 Table 28: East Asia Market Value (US$ Million) Forecast by Treatment, 2018 to 2033 Table 29: East Asia Market Value (US$ Million) Forecast by Diagnosis, 2018 to 2033 Table 30: East Asia Market Value (US$ Million) Forecast by End Users, 2018 to 2033 Table 31: Oceania Market Value (US$ Million) Forecast by Country, 2018 to 2033 Table 32: Oceania Market Value (US$ Million) Forecast by Type, 2018 to 2033 Table 33: Oceania Market Value (US$ Million) Forecast by Treatment, 2018 to 2033 Table 34: Oceania Market Value (US$ Million) Forecast by Diagnosis, 2018 to 2033 Table 35: Oceania Market Value (US$ Million) Forecast by End Users, 2018 to 2033 Table 36: MEA Market Value (US$ Million) Forecast by Country, 2018 to 2033 Table 37: MEA Market Value (US$ Million) Forecast by Type, 2018 to 2033 Table 38: MEA Market Value (US$ Million) Forecast by Treatment, 2018 to 2033 Table 39: MEA Market Value (US$ Million) Forecast by Diagnosis, 2018 to 2033 Table 40: MEA Market Value (US$ Million) Forecast by End Users, 2018 to 2033
Find your sweet spots for generating winning opportunities in this market.
Talk to AnalystList of Charts
Figure 1: Global Market Value (US$ Million) by Type, 2023 to 2033 Figure 2: Global Market Value (US$ Million) by Treatment, 2023 to 2033 Figure 3: Global Market Value (US$ Million) by Diagnosis, 2023 to 2033 Figure 4: Global Market Value (US$ Million) by End Users, 2023 to 2033 Figure 5: Global Market Value (US$ Million) by Region, 2023 to 2033 Figure 6: Global Market Value (US$ Million) Analysis by Region, 2018 to 2033 Figure 7: Global Market Value Share (%) and BPS Analysis by Region, 2023 to 2033 Figure 8: Global Market Y-o-Y Growth (%) Projections by Region, 2023 to 2033 Figure 9: Global Market Value (US$ Million) Analysis by Type, 2018 to 2033 Figure 10: Global Market Value Share (%) and BPS Analysis by Type, 2023 to 2033 Figure 11: Global Market Y-o-Y Growth (%) Projections by Type, 2023 to 2033 Figure 12: Global Market Value (US$ Million) Analysis by Treatment, 2018 to 2033 Figure 13: Global Market Value Share (%) and BPS Analysis by Treatment, 2023 to 2033 Figure 14: Global Market Y-o-Y Growth (%) Projections by Treatment, 2023 to 2033 Figure 15: Global Market Value (US$ Million) Analysis by Diagnosis, 2018 to 2033 Figure 16: Global Market Value Share (%) and BPS Analysis by Diagnosis, 2023 to 2033 Figure 17: Global Market Y-o-Y Growth (%) Projections by Diagnosis, 2023 to 2033 Figure 18: Global Market Value (US$ Million) Analysis by End Users, 2018 to 2033 Figure 19: Global Market Value Share (%) and BPS Analysis by End Users, 2023 to 2033 Figure 20: Global Market Y-o-Y Growth (%) Projections by End Users, 2023 to 2033 Figure 21: Global Market Attractiveness by Type, 2023 to 2033 Figure 22: Global Market Attractiveness by Treatment, 2023 to 2033 Figure 23: Global Market Attractiveness by Diagnosis, 2023 to 2033 Figure 24: Global Market Attractiveness by End Users, 2023 to 2033 Figure 25: Global Market Attractiveness by Region, 2023 to 2033 Figure 26: North America Market Value (US$ Million) by Type, 2023 to 2033 Figure 27: North America Market Value (US$ Million) by Treatment, 2023 to 2033 Figure 28: North America Market Value (US$ Million) by Diagnosis, 2023 to 2033 Figure 29: North America Market Value (US$ Million) by End Users, 2023 to 2033 Figure 30: North America Market Value (US$ Million) by Country, 2023 to 2033 Figure 31: North America Market Value (US$ Million) Analysis by Country, 2018 to 2033 Figure 32: North America Market Value Share (%) and BPS Analysis by Country, 2023 to 2033 Figure 33: North America Market Y-o-Y Growth (%) Projections by Country, 2023 to 2033 Figure 34: North America Market Value (US$ Million) Analysis by Type, 2018 to 2033 Figure 35: North America Market Value Share (%) and BPS Analysis by Type, 2023 to 2033 Figure 36: North America Market Y-o-Y Growth (%) Projections by Type, 2023 to 2033 Figure 37: North America Market Value (US$ Million) Analysis by Treatment, 2018 to 2033 Figure 38: North America Market Value Share (%) and BPS Analysis by Treatment, 2023 to 2033 Figure 39: North America Market Y-o-Y Growth (%) Projections by Treatment, 2023 to 2033 Figure 40: North America Market Value (US$ Million) Analysis by Diagnosis, 2018 to 2033 Figure 41: North America Market Value Share (%) and BPS Analysis by Diagnosis, 2023 to 2033 Figure 42: North America Market Y-o-Y Growth (%) Projections by Diagnosis, 2023 to 2033 Figure 43: North America Market Value (US$ Million) Analysis by End Users, 2018 to 2033 Figure 44: North America Market Value Share (%) and BPS Analysis by End Users, 2023 to 2033 Figure 45: North America Market Y-o-Y Growth (%) Projections by End Users, 2023 to 2033 Figure 46: North America Market Attractiveness by Type, 2023 to 2033 Figure 47: North America Market Attractiveness by Treatment, 2023 to 2033 Figure 48: North America Market Attractiveness by Diagnosis, 2023 to 2033 Figure 49: North America Market Attractiveness by End Users, 2023 to 2033 Figure 50: North America Market Attractiveness by Country, 2023 to 2033 Figure 51: Latin America Market Value (US$ Million) by Type, 2023 to 2033 Figure 52: Latin America Market Value (US$ Million) by Treatment, 2023 to 2033 Figure 53: Latin America Market Value (US$ Million) by Diagnosis, 2023 to 2033 Figure 54: Latin America Market Value (US$ Million) by End Users, 2023 to 2033 Figure 55: Latin America Market Value (US$ Million) by Country, 2023 to 2033 Figure 56: Latin America Market Value (US$ Million) Analysis by Country, 2018 to 2033 Figure 57: Latin America Market Value Share (%) and BPS Analysis by Country, 2023 to 2033 Figure 58: Latin America Market Y-o-Y Growth (%) Projections by Country, 2023 to 2033 Figure 59: Latin America Market Value (US$ Million) Analysis by Type, 2018 to 2033 Figure 60: Latin America Market Value Share (%) and BPS Analysis by Type, 2023 to 2033 Figure 61: Latin America Market Y-o-Y Growth (%) Projections by Type, 2023 to 2033 Figure 62: Latin America Market Value (US$ Million) Analysis by Treatment, 2018 to 2033 Figure 63: Latin America Market Value Share (%) and BPS Analysis by Treatment, 2023 to 2033 Figure 64: Latin America Market Y-o-Y Growth (%) Projections by Treatment, 2023 to 2033 Figure 65: Latin America Market Value (US$ Million) Analysis by Diagnosis, 2018 to 2033 Figure 66: Latin America Market Value Share (%) and BPS Analysis by Diagnosis, 2023 to 2033 Figure 67: Latin America Market Y-o-Y Growth (%) Projections by Diagnosis, 2023 to 2033 Figure 68: Latin America Market Value (US$ Million) Analysis by End Users, 2018 to 2033 Figure 69: Latin America Market Value Share (%) and BPS Analysis by End Users, 2023 to 2033 Figure 70: Latin America Market Y-o-Y Growth (%) Projections by End Users, 2023 to 2033 Figure 71: Latin America Market Attractiveness by Type, 2023 to 2033 Figure 72: Latin America Market Attractiveness by Treatment, 2023 to 2033 Figure 73: Latin America Market Attractiveness by Diagnosis, 2023 to 2033 Figure 74: Latin America Market Attractiveness by End Users, 2023 to 2033 Figure 75: Latin America Market Attractiveness by Country, 2023 to 2033 Figure 76: Europe Market Value (US$ Million) by Type, 2023 to 2033 Figure 77: Europe Market Value (US$ Million) by Treatment, 2023 to 2033 Figure 78: Europe Market Value (US$ Million) by Diagnosis, 2023 to 2033 Figure 79: Europe Market Value (US$ Million) by End Users, 2023 to 2033 Figure 80: Europe Market Value (US$ Million) by Country, 2023 to 2033 Figure 81: Europe Market Value (US$ Million) Analysis by Country, 2018 to 2033 Figure 82: Europe Market Value Share (%) and BPS Analysis by Country, 2023 to 2033 Figure 83: Europe Market Y-o-Y Growth (%) Projections by Country, 2023 to 2033 Figure 84: Europe Market Value (US$ Million) Analysis by Type, 2018 to 2033 Figure 85: Europe Market Value Share (%) and BPS Analysis by Type, 2023 to 2033 Figure 86: Europe Market Y-o-Y Growth (%) Projections by Type, 2023 to 2033 Figure 87: Europe Market Value (US$ Million) Analysis by Treatment, 2018 to 2033 Figure 88: Europe Market Value Share (%) and BPS Analysis by Treatment, 2023 to 2033 Figure 89: Europe Market Y-o-Y Growth (%) Projections by Treatment, 2023 to 2033 Figure 90: Europe Market Value (US$ Million) Analysis by Diagnosis, 2018 to 2033 Figure 91: Europe Market Value Share (%) and BPS Analysis by Diagnosis, 2023 to 2033 Figure 92: Europe Market Y-o-Y Growth (%) Projections by Diagnosis, 2023 to 2033 Figure 93: Europe Market Value (US$ Million) Analysis by End Users, 2018 to 2033 Figure 94: Europe Market Value Share (%) and BPS Analysis by End Users, 2023 to 2033 Figure 95: Europe Market Y-o-Y Growth (%) Projections by End Users, 2023 to 2033 Figure 96: Europe Market Attractiveness by Type, 2023 to 2033 Figure 97: Europe Market Attractiveness by Treatment, 2023 to 2033 Figure 98: Europe Market Attractiveness by Diagnosis, 2023 to 2033 Figure 99: Europe Market Attractiveness by End Users, 2023 to 2033 Figure 100: Europe Market Attractiveness by Country, 2023 to 2033 Figure 101: South Asia Market Value (US$ Million) by Type, 2023 to 2033 Figure 102: South Asia Market Value (US$ Million) by Treatment, 2023 to 2033 Figure 103: South Asia Market Value (US$ Million) by Diagnosis, 2023 to 2033 Figure 104: South Asia Market Value (US$ Million) by End Users, 2023 to 2033 Figure 105: South Asia Market Value (US$ Million) by Country, 2023 to 2033 Figure 106: South Asia Market Value (US$ Million) Analysis by Country, 2018 to 2033 Figure 107: South Asia Market Value Share (%) and BPS Analysis by Country, 2023 to 2033 Figure 108: South Asia Market Y-o-Y Growth (%) Projections by Country, 2023 to 2033 Figure 109: South Asia Market Value (US$ Million) Analysis by Type, 2018 to 2033 Figure 110: South Asia Market Value Share (%) and BPS Analysis by Type, 2023 to 2033 Figure 111: South Asia Market Y-o-Y Growth (%) Projections by Type, 2023 to 2033 Figure 112: South Asia Market Value (US$ Million) Analysis by Treatment, 2018 to 2033 Figure 113: South Asia Market Value Share (%) and BPS Analysis by Treatment, 2023 to 2033 Figure 114: South Asia Market Y-o-Y Growth (%) Projections by Treatment, 2023 to 2033 Figure 115: South Asia Market Value (US$ Million) Analysis by Diagnosis, 2018 to 2033 Figure 116: South Asia Market Value Share (%) and BPS Analysis by Diagnosis, 2023 to 2033 Figure 117: South Asia Market Y-o-Y Growth (%) Projections by Diagnosis, 2023 to 2033 Figure 118: South Asia Market Value (US$ Million) Analysis by End Users, 2018 to 2033 Figure 119: South Asia Market Value Share (%) and BPS Analysis by End Users, 2023 to 2033 Figure 120: South Asia Market Y-o-Y Growth (%) Projections by End Users, 2023 to 2033 Figure 121: South Asia Market Attractiveness by Type, 2023 to 2033 Figure 122: South Asia Market Attractiveness by Treatment, 2023 to 2033 Figure 123: South Asia Market Attractiveness by Diagnosis, 2023 to 2033 Figure 124: South Asia Market Attractiveness by End Users, 2023 to 2033 Figure 125: South Asia Market Attractiveness by Country, 2023 to 2033 Figure 126: East Asia Market Value (US$ Million) by Type, 2023 to 2033 Figure 127: East Asia Market Value (US$ Million) by Treatment, 2023 to 2033 Figure 128: East Asia Market Value (US$ Million) by Diagnosis, 2023 to 2033 Figure 129: East Asia Market Value (US$ Million) by End Users, 2023 to 2033 Figure 130: East Asia Market Value (US$ Million) by Country, 2023 to 2033 Figure 131: East Asia Market Value (US$ Million) Analysis by Country, 2018 to 2033 Figure 132: East Asia Market Value Share (%) and BPS Analysis by Country, 2023 to 2033 Figure 133: East Asia Market Y-o-Y Growth (%) Projections by Country, 2023 to 2033 Figure 134: East Asia Market Value (US$ Million) Analysis by Type, 2018 to 2033 Figure 135: East Asia Market Value Share (%) and BPS Analysis by Type, 2023 to 2033 Figure 136: East Asia Market Y-o-Y Growth (%) Projections by Type, 2023 to 2033 Figure 137: East Asia Market Value (US$ Million) Analysis by Treatment, 2018 to 2033 Figure 138: East Asia Market Value Share (%) and BPS Analysis by Treatment, 2023 to 2033 Figure 139: East Asia Market Y-o-Y Growth (%) Projections by Treatment, 2023 to 2033 Figure 140: East Asia Market Value (US$ Million) Analysis by Diagnosis, 2018 to 2033 Figure 141: East Asia Market Value Share (%) and BPS Analysis by Diagnosis, 2023 to 2033 Figure 142: East Asia Market Y-o-Y Growth (%) Projections by Diagnosis, 2023 to 2033 Figure 143: East Asia Market Value (US$ Million) Analysis by End Users, 2018 to 2033 Figure 144: East Asia Market Value Share (%) and BPS Analysis by End Users, 2023 to 2033 Figure 145: East Asia Market Y-o-Y Growth (%) Projections by End Users, 2023 to 2033 Figure 146: East Asia Market Attractiveness by Type, 2023 to 2033 Figure 147: East Asia Market Attractiveness by Treatment, 2023 to 2033 Figure 148: East Asia Market Attractiveness by Diagnosis, 2023 to 2033 Figure 149: East Asia Market Attractiveness by End Users, 2023 to 2033 Figure 150: East Asia Market Attractiveness by Country, 2023 to 2033 Figure 151: Oceania Market Value (US$ Million) by Type, 2023 to 2033 Figure 152: Oceania Market Value (US$ Million) by Treatment, 2023 to 2033 Figure 153: Oceania Market Value (US$ Million) by Diagnosis, 2023 to 2033 Figure 154: Oceania Market Value (US$ Million) by End Users, 2023 to 2033 Figure 155: Oceania Market Value (US$ Million) by Country, 2023 to 2033 Figure 156: Oceania Market Value (US$ Million) Analysis by Country, 2018 to 2033 Figure 157: Oceania Market Value Share (%) and BPS Analysis by Country, 2023 to 2033 Figure 158: Oceania Market Y-o-Y Growth (%) Projections by Country, 2023 to 2033 Figure 159: Oceania Market Value (US$ Million) Analysis by Type, 2018 to 2033 Figure 160: Oceania Market Value Share (%) and BPS Analysis by Type, 2023 to 2033 Figure 161: Oceania Market Y-o-Y Growth (%) Projections by Type, 2023 to 2033 Figure 162: Oceania Market Value (US$ Million) Analysis by Treatment, 2018 to 2033 Figure 163: Oceania Market Value Share (%) and BPS Analysis by Treatment, 2023 to 2033 Figure 164: Oceania Market Y-o-Y Growth (%) Projections by Treatment, 2023 to 2033 Figure 165: Oceania Market Value (US$ Million) Analysis by Diagnosis, 2018 to 2033 Figure 166: Oceania Market Value Share (%) and BPS Analysis by Diagnosis, 2023 to 2033 Figure 167: Oceania Market Y-o-Y Growth (%) Projections by Diagnosis, 2023 to 2033 Figure 168: Oceania Market Value (US$ Million) Analysis by End Users, 2018 to 2033 Figure 169: Oceania Market Value Share (%) and BPS Analysis by End Users, 2023 to 2033 Figure 170: Oceania Market Y-o-Y Growth (%) Projections by End Users, 2023 to 2033 Figure 171: Oceania Market Attractiveness by Type, 2023 to 2033 Figure 172: Oceania Market Attractiveness by Treatment, 2023 to 2033 Figure 173: Oceania Market Attractiveness by Diagnosis, 2023 to 2033 Figure 174: Oceania Market Attractiveness by End Users, 2023 to 2033 Figure 175: Oceania Market Attractiveness by Country, 2023 to 2033 Figure 176: MEA Market Value (US$ Million) by Type, 2023 to 2033 Figure 177: MEA Market Value (US$ Million) by Treatment, 2023 to 2033 Figure 178: MEA Market Value (US$ Million) by Diagnosis, 2023 to 2033 Figure 179: MEA Market Value (US$ Million) by End Users, 2023 to 2033 Figure 180: MEA Market Value (US$ Million) by Country, 2023 to 2033 Figure 181: MEA Market Value (US$ Million) Analysis by Country, 2018 to 2033 Figure 182: MEA Market Value Share (%) and BPS Analysis by Country, 2023 to 2033 Figure 183: MEA Market Y-o-Y Growth (%) Projections by Country, 2023 to 2033 Figure 184: MEA Market Value (US$ Million) Analysis by Type, 2018 to 2033 Figure 185: MEA Market Value Share (%) and BPS Analysis by Type, 2023 to 2033 Figure 186: MEA Market Y-o-Y Growth (%) Projections by Type, 2023 to 2033 Figure 187: MEA Market Value (US$ Million) Analysis by Treatment, 2018 to 2033 Figure 188: MEA Market Value Share (%) and BPS Analysis by Treatment, 2023 to 2033 Figure 189: MEA Market Y-o-Y Growth (%) Projections by Treatment, 2023 to 2033 Figure 190: MEA Market Value (US$ Million) Analysis by Diagnosis, 2018 to 2033 Figure 191: MEA Market Value Share (%) and BPS Analysis by Diagnosis, 2023 to 2033 Figure 192: MEA Market Y-o-Y Growth (%) Projections by Diagnosis, 2023 to 2033 Figure 193: MEA Market Value (US$ Million) Analysis by End Users, 2018 to 2033 Figure 194: MEA Market Value Share (%) and BPS Analysis by End Users, 2023 to 2033 Figure 195: MEA Market Y-o-Y Growth (%) Projections by End Users, 2023 to 2033 Figure 196: MEA Market Attractiveness by Type, 2023 to 2033 Figure 197: MEA Market Attractiveness by Treatment, 2023 to 2033 Figure 198: MEA Market Attractiveness by Diagnosis, 2023 to 2033 Figure 199: MEA Market Attractiveness by End Users, 2023 to 2033 Figure 200: MEA Market Attractiveness by Country, 2023 to 2033
Need specific information?
Request CustomizationExplore Healthcare Insights
View Reports