Takotsubo syndrome therapeutics market around the world will be likely to grow immensely following elevated awareness over stress-induced cardiomyopathy, advanced diagnostic tests, and the evolution of treatment practices. Broken heart syndrome or takotsubo syndrome is much similar to acute coronary syndrome but as a consequence of physical or emotional distress.
The therapeutics industry includes therapeutics such as beta-blockers, ACE inhibitors, anticoagulants, and new precision-targeted therapeutics that are under investigation to be utilized in the treatment of disease symptom management as well as recurrence prevention of disease. Takotsubo syndrome global therapeutics market will be approximately USD 3,268 million in 2025. It’s worth will be approximately USD 6,132 million by 2035 at a compound annual growth rate of 6.5%.
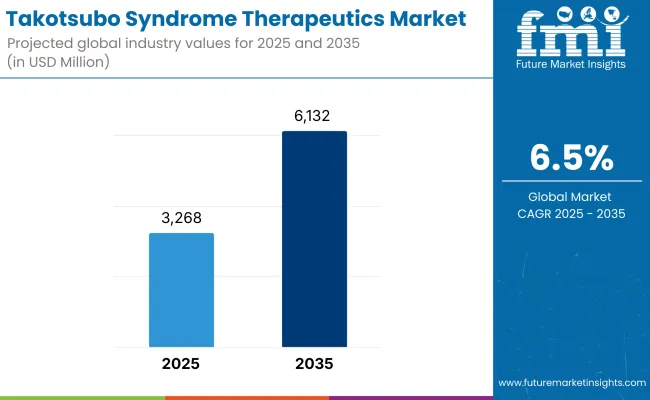
| Metric | Value |
|---|---|
| Market Size in 2025 | USD 3,268 million |
| Projected Market Size in 2035 | USD 6,132 million |
| CAGR (2025 to 2035) | 6.5% |
Market is being fuelled by continued research in pathophysiology of takotsubo syndrome to facilitate target therapy development. Further, a high level of availability of cardiovascular imaging devices including cardiac MRI and echocardiography facilitates the early and reliable diagnosis. Since healthcare providers as well as patients have become highly aware, takotsubo syndrome therapeutics market will continue to evolve by 2035.
North America provides a huge market for drugs in takotsubo syndrome due to established health infrastructure, robust cardiovascular research trend, and rising stress-induced cardiovascular disease. United States is a key driver of the market growth with ongoing clinical research trials for the identification of new drug therapy and rising physician interest in stress-induced cardiomyopathy.
Europe is also a market leader, where cases of high prevalence of takotsubo syndrome with high government support towards treating cardiovascular disease exist. Germany, France, and the United Kingdom are regional leaders in the accessibility of treatment and patient awareness drives. Apart from this, European research studies conducted to highlight cardiovascular disorders caused by stress also add up to the growth of the market.
Asia-Pacific is the most dynamically evolving therapeutics market for takotsubo syndrome as a result of increasing healthcare expenditure, urbanization-led stress rates, and cardiovascular disease prevalence. The region has also seen increased interest from countries like Japan, China, and South Korea in exploring takotsubo syndrome as a result of urban lifestyle with high-stress and aging population condition in the above countries. Increasing diagnosis centers and availability of new drugs also accelerate the building of the region's market.
Limited Awareness, Diagnostic Complexity, and Lack of Targeted Therapies
Treatment market of Takotsubo syndrome is also plagued by others such as unavailability of physicians and awareness among the patients for the disease, thereby affecting early diagnosis. The disease is being diagnosed as heart attack under the normal situation due to mimicry and hence treatment is thus always a lag. Second, up to now there is no drug for Takotsubo syndrome approved, treatment is still based on repurposed cardio medicines which will be incapable of completely eradicating the disease.
Progress in Cardiovascular Research, AI Diagnosis, and Personalized Medicine
In spite of such limitations, takotsubo syndrome Therapeutics market is of extremely high potential. Adequate cardiovascular research has highlighted more about the pathophysiology of the disease and is unfolding the doors towards new medicine discovery.
AI diagnosis is enhancing early diagnostic rates by the identification of takotsubo syndrome as an independent disease and no other cardiovascular diseases more accurately. Increased application of targeted medicine and genomic studies allows targeted treatment regimens according to the risk profile of the patient, which allows for long-term planning.
From 2020 to 2024, increased awareness of takotsubo syndrome as a specific cardiac illness and better clinical research, and thus more precise diagnostic techniques. The treatment still remained mostly symptomatic with beta-blockers and ACE inhibitors, though they were used most frequently as pharmacologic therapy. Advanced cardiac imaging also was not well available in most regions and thus remained an element of under diagnosis.
Between 2025 and 2035, care and patient-oriented treatment of Takotsubo syndrome will be more prevalent. Early diagnosis efficacy will be supported by AI-based diagnostic models, and neuro-cardiac interaction findings will be used as a basis for the development of emphasis-laid pharmacological treatment.
Stress management therapies, lifestyle modification, and wearable health monitors will also decrease recurrence rates to a great extent. With the emergence of precision medicine, therapeutics market for Takotsubo syndrome will be able to witness new therapeutic agents surfacing, depending on individual patient profiles to ensure enhanced efficacy.
Market Shifts: A Comparative Analysis 2020 to 2024 vs. 2025 to 2035
| Market Shift | 2020 to 2024 Trends |
|---|---|
| Regulatory Landscape | Adherence to cardiology treatment guidelines and generic drug safety standards. |
| Consumer Trends | Growing awareness of stress-induced cardiomyopathy, fueling demand for symptomatic treatment. |
| Industry Adoption | Use of beta-blockers, ACE inhibitors, and supportive care practices. |
| Supply Chain and Sourcing | Reliance on generic cardiovascular medications and off-label use. |
| Market Competition | Dominance by major pharmaceutical firms with cardiovascular drug expertise. |
| Market Growth Drivers | Growing incidence of stress-related heart disease, aging population, and enhanced diagnostic methods. |
| Sustainability and Environmental Impact | Early uptake of environmentally friendly packaging for cardiovascular medications and minimization of pharmaceutical waste. |
| Integration of Smart Technologies | Adoption of telemedicine for follow-up and distant monitoring of heart patients. |
| Advancements in Equipment Design | Utilization of portable echocardiography and routine ECG monitoring. |
| Market Shift | 2025 to 2035 Projections |
|---|---|
| Regulatory Landscape | Implementation of stricter approval pathways for novel heart failure therapies and Takotsubo-specific drugs. |
| Consumer Trends | Growing preference for personalized medicine, biomarker- driven treatment plans, and AI-assisted diagnostics. |
| Industry Adoption | Expansion of regenerative therapies, neuro-cardiac interventions, and digital therapeutic applications. |
| Supply Chain and Sourcing | Shift towards targeted biologics, peptide-based therapies, and AI-optimized drug discovery. |
| Market Competition | Entry of biotech firms pioneering RNA-based and gene-editing treatments for stress-induced cardiomyopathy. |
| Market Growth Drivers | Driven by advancements in neuro-cardiac treatment, AI-powered risk prediction models, and precision medicine adoption. |
| Sustainability and Environmental Impact | Transition to biodegradable drug delivery systems, carbon-neutral clinical trials, and AI-based supply chain optimization. |
| Integration of Smart Technologies | Growth in wearable biosensors, AI-driven heart health apps, and blockchain-enabled patient data management. |
| Advancements in Equipment Design | Development of AI-integrated cardiac MRI technology, microfluidic blood testing, and non-invasive stress biomarkers. |
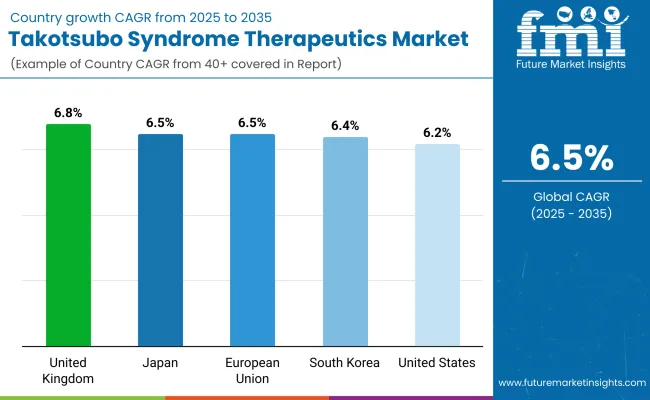
The USA therapeutics market for Takotsubo Syndrome has grown with a rising clinical awareness of stress-induced cardiomyopathy. Major cardiology institutions are implementing AI-driven ECG interpretation and heart-rate variability tracking to improve early diagnosis.
The pharma industry is placing its bets on neuro-cardiac treatments, focusing on autonomic dysfunction associated with Takotsubo Syndrome. As growing mental health consciousness and cardiovascular interdependence spur new therapies such as stress-response modulators, the pharma industry remains optimistic.
| Country | CAGR (2025 to 2035) |
|---|---|
| USA | 6.2% |
The UK is reporting an increase in Takotsubo Syndrome, which has led the NHS and private healthcare providers to initiate specialized cardiac rehabilitation schemes. Government funding of research into stress cardiomyopathy is pushing innovation in AI-enabled risk analysis software. The need for individualized treatment is on the rise, which is manifesting as investment in patient-based cardioprotective medication treatments.
| Country | CAGR (2025 to 2035) |
|---|---|
| UK | 6.8% |
The European Union is adopting stringent cardiovascular health policies, speeding up approvals for novel therapies against stress-induced cardiomyopathy. Germany, France, and Italy are leaders in AI-assisted cardiac diagnosis, with interest in developing Takotsubo-specific treatment guidelines. Focus from regulators on precision medicine and digital health technologies is driving pharmaceutical innovation.
| Region | CAGR (2025 to 2035) |
|---|---|
| EU | 6.5% |
Japan's hectic work ethic and aging population are major contributors to the incidence of Takotsubo Syndrome. Japanese scientists are creating neuro-cardiac treatment methods that harmonize conventional cardiology with sophisticated neurotherapy. Wearable ECG devices using AI are going mainstream for real-time heart monitoring, allowing near-diagnosis and pre-emptive intervention.
| Country | CAGR (2025 to 2035) |
|---|---|
| Japan | 6.5% |
South Korea is incorporating intelligent healthcare technologies to meet increasing rates of stress-related cardiac disease. South Korean hospitals use AI-driven predictive analytics for heart disease, improving Takotsubo Syndrome risk forecasting. Investments in stem cell therapy and regenerative medicine are developing novel treatment models for stress-induced cardiomyopathy.
| Country | CAGR (2025 to 2035) |
|---|---|
| South Korea | 6.4% |
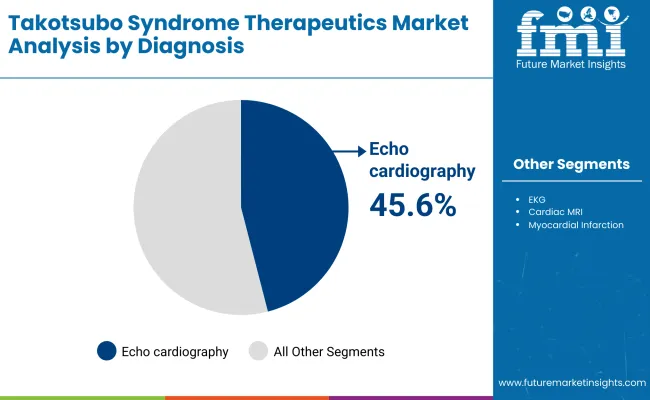
| By Diagnosis | Market Share (20 2 5) |
|---|---|
| Echocardiography | 45.6% |
Echocardiography shall be the dominant diagnostic instrument in Takotsubo syndrome with 45.6% of the overall market demand by 2025. Given that echocardiography is the sole method capable of displaying images of left ventricular dysfunction, including the diagnostic apical ballooning, in real-time without the necessity for an invasive process, its application shall be unavoidable for early and non-invasive diagnosis.
The spread of newer echocardiographic techniques, like speckle-tracking imaging, has further heightened the level of detection of myocardial subtle changes to new levels of clinical efficacy. Although EKG remains a first-line screening tool, its failure to differentiate Takotsubo syndrome from acute coronary syndromes reduces its specificity as a diagnostic tool.
Cardiac MRI, on the other hand, is becoming more noted for its ability to detect myocardial edema and fibrosis but is hindered by its higher cost and lower availability. The increasing use of portable and AI-based echocardiography machines in emergency and critical care centers has further solidified echocardiography as the preferred method.
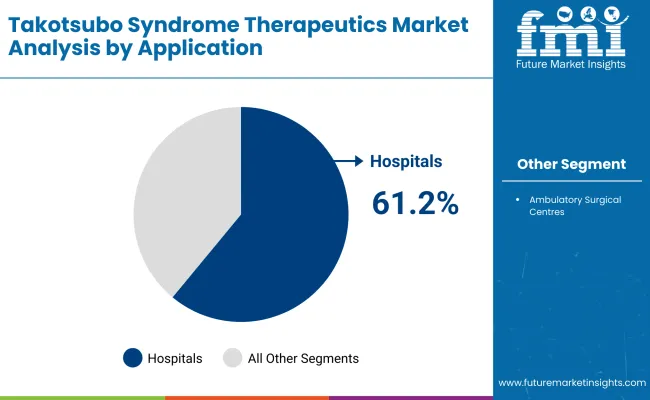
| By Application | Market Share (20 2 5) |
|---|---|
| Hospitals | 61.2% |
The global Takotsubo syndrome therapeutics market will be led by hospitals with a market share of 61.2% during the period between 2025. Growing numbers of cases related to stress cardiomyopathy among postmenopausal women are fueling demand for in-patient hospital therapies.
State-of-the-art cardiac care facilities under constant observation coupled with accessibility of latest treatment strategies such as beta-blockers and anticoagulation therapies enhance the use of hospital settings as a first-line choice in takotsubo syndrome treatments.
While ambulatory surgical centers provide follow-up and diagnostic service, the limited capacity for acute cardiac emergency management keeps their market share in check. Even more hospital-based investment in AI-capable diagnostic technology, such as automated echocardiogram interpretation and machine learning for early risk detection, will further cement hospitals as the primary treatment facility for Takotsubo syndrome.
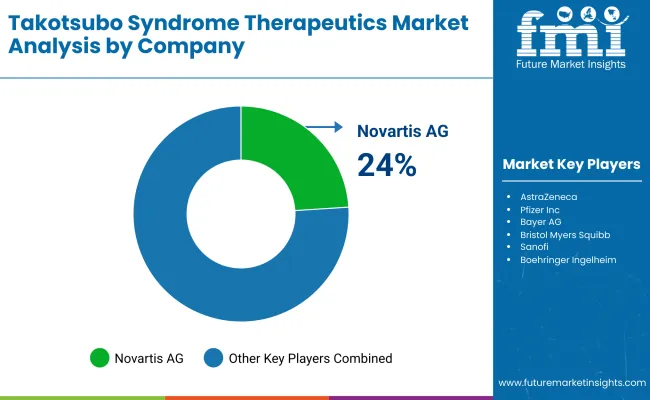
Growing awareness of Takotsubo Syndrome (TTS), or stress cardiomyopathy, has spurred the demand for targeted therapeutics. Greater understanding of the cardiovascular effects of stress, excess catecholamines, and microvascular damage has enabled novel treatments. Drug companies highlight beta-blockers, ACE inhibitors, and emerging neuro-cardiac modulators to optimize patient outcomes and prevent recurrence.
Market Share Analysis by Company
| Company Name | Estimated Market Share (%) |
|---|---|
| Novartis AG | 24-28% |
| AstraZeneca | 18-22% |
| Pfizer Inc. | 14-18% |
| Bayer AG | 9-13% |
| Bristol Myers Squibb | 5-9% |
| Other Companies (combined) | 14-18% |
| Company Name | Key Offerings/Activities |
|---|---|
| Novartis AG | In 2024, launched phase III expanded clinical trials of a neuro-cardiac modulator for treating excessive sympathetic activity in TTS patients. In 2025, launched an AI-based patient monitoring program to assess recurrence risk factors. |
| AstraZeneca | In 2024, introduced a beta-blocker with enhanced cardioprotective activity specifically in stress-induced cardiomyopathy. In 2025, collaborated with global cardiology organizations to create new guidelines for TTS therapies. |
| Pfizer Inc. | In 2024, initiated trials for an angiotensin receptor-neprilysin inhibitor (ARNI) to improve cardiac function in TTS patients. In 2025, developed a wearable device to track real-time cardiac stress markers and optimize medication dosing. |
| Bayer AG | In 2024, received FDA approval of a new vasodilator to increase microvascular perfusion in patients with TTS. In 2025, launched a patient support program for greater treatment adherence and long-term success. |
| Bristol Myers Squibb | In 2024, researched serotonin pathway modulators to manage the neuro-cardiac relationship in TTS. In 2025, began working with AI firms to predict risky patients based on behavioral and physiological data. |
Key Company Insights
Novartis AG (24-28%)
Novartis is a leader in pioneering neuro-cardiac therapies with excessive sympathetic overactivation treatment of TTS patients. Its artificial intelligence patient surveillance system optimizes risk assessment and customized treatment planning.
AstraZeneca (18-22%)
AstraZeneca's approach is toward cardioprotective beta-blockers and guideline development to normalize treatment of TTS. Its partnership with cardiology societies delineates the stress-induced cardiomyopathy management future.
Pfizer Inc. (14-18%)
Pfizer leads the convergence of ARNI therapy and wearable health devices to maximize treatment efficacy in TTS patients. Its real-time monitoring solutions for cardiology create new standards for customized care.
Bayer AG (9-13%)
Bayer's vasodilator approval is a leap forward in TTS therapy, treating microvascular dysfunction. Its patient support programs ensure compliance and enhance long-term health outcomes.
Bristol Myers Squibb (5-9%)
Bristol Myers Squibb explores modulation of the serotonin pathway and artificial intelligence risk prediction models, propelling precision medicine in TTS. Its focus on behavioral and physiological predictors encourages early intervention.
Other Key Players (14-18% Combined)
The overall market size for the takotsubo syndrome therapeutics market was USD 3,268 million in 2025.
The takotsubo syndrome therapeutics market is expected to reach USD 6,132 million by 2035.
The increasing prevalence of cardiovascular diseases, advancements in diagnostic techniques, and growing awareness among healthcare professionals are fueling the demand for takotsubo syndrome therapeutics during the forecast period.
The top 5 countries driving the development of the takotsubo syndrome therapeutics market are the United States, Germany, the United Kingdom, China, and Japan.
On the basis of therapy, the dual antiplatelet therapy (DAPT) segment is projected to hold a significant share over the forecast period.
Table 1: Global Market Value (US$ Million) Forecast by Region, 2018 to 2033
Table 2: Global Market Value (US$ Million) Forecast by Diagnosis, 2018 to 2033
Table 3: Global Market Value (US$ Million) Forecast by Application, 2018 to 2033
Table 4: North America Market Value (US$ Million) Forecast by Country, 2018 to 2033
Table 5: North America Market Value (US$ Million) Forecast by Diagnosis, 2018 to 2033
Table 6: North America Market Value (US$ Million) Forecast by Application, 2018 to 2033
Table 7: Latin America Market Value (US$ Million) Forecast by Country, 2018 to 2033
Table 8: Latin America Market Value (US$ Million) Forecast by Diagnosis, 2018 to 2033
Table 9: Latin America Market Value (US$ Million) Forecast by Application, 2018 to 2033
Table 10: Europe Market Value (US$ Million) Forecast by Country, 2018 to 2033
Table 11: Europe Market Value (US$ Million) Forecast by Diagnosis, 2018 to 2033
Table 12: Europe Market Value (US$ Million) Forecast by Application, 2018 to 2033
Table 13: Asia Pacific Market Value (US$ Million) Forecast by Country, 2018 to 2033
Table 14: Asia Pacific Market Value (US$ Million) Forecast by Diagnosis, 2018 to 2033
Table 15: Asia Pacific Market Value (US$ Million) Forecast by Application, 2018 to 2033
Table 16: MEA Market Value (US$ Million) Forecast by Country, 2018 to 2033
Table 17: MEA Market Value (US$ Million) Forecast by Diagnosis, 2018 to 2033
Table 18: MEA Market Value (US$ Million) Forecast by Application, 2018 to 2033
Figure 1: Global Market Value (US$ Million) by Diagnosis, 2023 to 2033
Figure 2: Global Market Value (US$ Million) by Application, 2023 to 2033
Figure 3: Global Market Value (US$ Million) by Region, 2023 to 2033
Figure 4: Global Market Value (US$ Million) Analysis by Region, 2018 to 2033
Figure 5: Global Market Value Share (%) and BPS Analysis by Region, 2023 to 2033
Figure 6: Global Market Y-o-Y Growth (%) Projections by Region, 2023 to 2033
Figure 7: Global Market Value (US$ Million) Analysis by Diagnosis, 2018 to 2033
Figure 8: Global Market Value Share (%) and BPS Analysis by Diagnosis, 2023 to 2033
Figure 9: Global Market Y-o-Y Growth (%) Projections by Diagnosis, 2023 to 2033
Figure 10: Global Market Value (US$ Million) Analysis by Application, 2018 to 2033
Figure 11: Global Market Value Share (%) and BPS Analysis by Application, 2023 to 2033
Figure 12: Global Market Y-o-Y Growth (%) Projections by Application, 2023 to 2033
Figure 13: Global Market Attractiveness by Diagnosis, 2023 to 2033
Figure 14: Global Market Attractiveness by Application, 2023 to 2033
Figure 15: Global Market Attractiveness by Region, 2023 to 2033
Figure 16: North America Market Value (US$ Million) by Diagnosis, 2023 to 2033
Figure 17: North America Market Value (US$ Million) by Application, 2023 to 2033
Figure 18: North America Market Value (US$ Million) by Country, 2023 to 2033
Figure 19: North America Market Value (US$ Million) Analysis by Country, 2018 to 2033
Figure 20: North America Market Value Share (%) and BPS Analysis by Country, 2023 to 2033
Figure 21: North America Market Y-o-Y Growth (%) Projections by Country, 2023 to 2033
Figure 22: North America Market Value (US$ Million) Analysis by Diagnosis, 2018 to 2033
Figure 23: North America Market Value Share (%) and BPS Analysis by Diagnosis, 2023 to 2033
Figure 24: North America Market Y-o-Y Growth (%) Projections by Diagnosis, 2023 to 2033
Figure 25: North America Market Value (US$ Million) Analysis by Application, 2018 to 2033
Figure 26: North America Market Value Share (%) and BPS Analysis by Application, 2023 to 2033
Figure 27: North America Market Y-o-Y Growth (%) Projections by Application, 2023 to 2033
Figure 28: North America Market Attractiveness by Diagnosis, 2023 to 2033
Figure 29: North America Market Attractiveness by Application, 2023 to 2033
Figure 30: North America Market Attractiveness by Country, 2023 to 2033
Figure 31: Latin America Market Value (US$ Million) by Diagnosis, 2023 to 2033
Figure 32: Latin America Market Value (US$ Million) by Application, 2023 to 2033
Figure 33: Latin America Market Value (US$ Million) by Country, 2023 to 2033
Figure 34: Latin America Market Value (US$ Million) Analysis by Country, 2018 to 2033
Figure 35: Latin America Market Value Share (%) and BPS Analysis by Country, 2023 to 2033
Figure 36: Latin America Market Y-o-Y Growth (%) Projections by Country, 2023 to 2033
Figure 37: Latin America Market Value (US$ Million) Analysis by Diagnosis, 2018 to 2033
Figure 38: Latin America Market Value Share (%) and BPS Analysis by Diagnosis, 2023 to 2033
Figure 39: Latin America Market Y-o-Y Growth (%) Projections by Diagnosis, 2023 to 2033
Figure 40: Latin America Market Value (US$ Million) Analysis by Application, 2018 to 2033
Figure 41: Latin America Market Value Share (%) and BPS Analysis by Application, 2023 to 2033
Figure 42: Latin America Market Y-o-Y Growth (%) Projections by Application, 2023 to 2033
Figure 43: Latin America Market Attractiveness by Diagnosis, 2023 to 2033
Figure 44: Latin America Market Attractiveness by Application, 2023 to 2033
Figure 45: Latin America Market Attractiveness by Country, 2023 to 2033
Figure 46: Europe Market Value (US$ Million) by Diagnosis, 2023 to 2033
Figure 47: Europe Market Value (US$ Million) by Application, 2023 to 2033
Figure 48: Europe Market Value (US$ Million) by Country, 2023 to 2033
Figure 49: Europe Market Value (US$ Million) Analysis by Country, 2018 to 2033
Figure 50: Europe Market Value Share (%) and BPS Analysis by Country, 2023 to 2033
Figure 51: Europe Market Y-o-Y Growth (%) Projections by Country, 2023 to 2033
Figure 52: Europe Market Value (US$ Million) Analysis by Diagnosis, 2018 to 2033
Figure 53: Europe Market Value Share (%) and BPS Analysis by Diagnosis, 2023 to 2033
Figure 54: Europe Market Y-o-Y Growth (%) Projections by Diagnosis, 2023 to 2033
Figure 55: Europe Market Value (US$ Million) Analysis by Application, 2018 to 2033
Figure 56: Europe Market Value Share (%) and BPS Analysis by Application, 2023 to 2033
Figure 57: Europe Market Y-o-Y Growth (%) Projections by Application, 2023 to 2033
Figure 58: Europe Market Attractiveness by Diagnosis, 2023 to 2033
Figure 59: Europe Market Attractiveness by Application, 2023 to 2033
Figure 60: Europe Market Attractiveness by Country, 2023 to 2033
Figure 61: Asia Pacific Market Value (US$ Million) by Diagnosis, 2023 to 2033
Figure 62: Asia Pacific Market Value (US$ Million) by Application, 2023 to 2033
Figure 63: Asia Pacific Market Value (US$ Million) by Country, 2023 to 2033
Figure 64: Asia Pacific Market Value (US$ Million) Analysis by Country, 2018 to 2033
Figure 65: Asia Pacific Market Value Share (%) and BPS Analysis by Country, 2023 to 2033
Figure 66: Asia Pacific Market Y-o-Y Growth (%) Projections by Country, 2023 to 2033
Figure 67: Asia Pacific Market Value (US$ Million) Analysis by Diagnosis, 2018 to 2033
Figure 68: Asia Pacific Market Value Share (%) and BPS Analysis by Diagnosis, 2023 to 2033
Figure 69: Asia Pacific Market Y-o-Y Growth (%) Projections by Diagnosis, 2023 to 2033
Figure 70: Asia Pacific Market Value (US$ Million) Analysis by Application, 2018 to 2033
Figure 71: Asia Pacific Market Value Share (%) and BPS Analysis by Application, 2023 to 2033
Figure 72: Asia Pacific Market Y-o-Y Growth (%) Projections by Application, 2023 to 2033
Figure 73: Asia Pacific Market Attractiveness by Diagnosis, 2023 to 2033
Figure 74: Asia Pacific Market Attractiveness by Application, 2023 to 2033
Figure 75: Asia Pacific Market Attractiveness by Country, 2023 to 2033
Figure 76: MEA Market Value (US$ Million) by Diagnosis, 2023 to 2033
Figure 77: MEA Market Value (US$ Million) by Application, 2023 to 2033
Figure 78: MEA Market Value (US$ Million) by Country, 2023 to 2033
Figure 79: MEA Market Value (US$ Million) Analysis by Country, 2018 to 2033
Figure 80: MEA Market Value Share (%) and BPS Analysis by Country, 2023 to 2033
Figure 81: MEA Market Y-o-Y Growth (%) Projections by Country, 2023 to 2033
Figure 82: MEA Market Value (US$ Million) Analysis by Diagnosis, 2018 to 2033
Figure 83: MEA Market Value Share (%) and BPS Analysis by Diagnosis, 2023 to 2033
Figure 84: MEA Market Y-o-Y Growth (%) Projections by Diagnosis, 2023 to 2033
Figure 85: MEA Market Value (US$ Million) Analysis by Application, 2018 to 2033
Figure 86: MEA Market Value Share (%) and BPS Analysis by Application, 2023 to 2033
Figure 87: MEA Market Y-o-Y Growth (%) Projections by Application, 2023 to 2033
Figure 88: MEA Market Attractiveness by Diagnosis, 2023 to 2033
Figure 89: MEA Market Attractiveness by Application, 2023 to 2033
Figure 90: MEA Market Attractiveness by Country, 2023 to 2033


Our Research Products

The "Full Research Suite" delivers actionable market intel, deep dives on markets or technologies, so clients act faster, cut risk, and unlock growth.

The Leaderboard benchmarks and ranks top vendors, classifying them as Established Leaders, Leading Challengers, or Disruptors & Challengers.

Locates where complements amplify value and substitutes erode it, forecasting net impact by horizon

We deliver granular, decision-grade intel: market sizing, 5-year forecasts, pricing, adoption, usage, revenue, and operational KPIs—plus competitor tracking, regulation, and value chains—across 60 countries broadly.

Spot the shifts before they hit your P&L. We track inflection points, adoption curves, pricing moves, and ecosystem plays to show where demand is heading, why it is changing, and what to do next across high-growth markets and disruptive tech

Real-time reads of user behavior. We track shifting priorities, perceptions of today’s and next-gen services, and provider experience, then pace how fast tech moves from trial to adoption, blending buyer, consumer, and channel inputs with social signals (#WhySwitch, #UX).

Partner with our analyst team to build a custom report designed around your business priorities. From analysing market trends to assessing competitors or crafting bespoke datasets, we tailor insights to your needs.
Supplier Intelligence
Discovery & Profiling
Capacity & Footprint
Performance & Risk
Compliance & Governance
Commercial Readiness
Who Supplies Whom
Scorecards & Shortlists
Playbooks & Docs
Category Intelligence
Definition & Scope
Demand & Use Cases
Cost Drivers
Market Structure
Supply Chain Map
Trade & Policy
Operating Norms
Deliverables
Buyer Intelligence
Account Basics
Spend & Scope
Procurement Model
Vendor Requirements
Terms & Policies
Entry Strategy
Pain Points & Triggers
Outputs
Pricing Analysis
Benchmarks
Trends
Should-Cost
Indexation
Landed Cost
Commercial Terms
Deliverables
Brand Analysis
Positioning & Value Prop
Share & Presence
Customer Evidence
Go-to-Market
Digital & Reputation
Compliance & Trust
KPIs & Gaps
Outputs
Full Research Suite comprises of:
Market outlook & trends analysis
Interviews & case studies
Strategic recommendations
Vendor profiles & capabilities analysis
5-year forecasts
8 regions and 60+ country-level data splits
Market segment data splits
12 months of continuous data updates
DELIVERED AS:
PDF EXCEL ONLINE
WHIM Syndrome Management Market Insights and Analysis for 2025 to 2035
Marfan Syndrome Management Market Size and Share Forecast Outlook 2025 to 2035
Kounis Syndrome Market Size and Share Forecast Outlook 2025 to 2035
Laband Syndrome Therapeutics Market Growth - Trends & Future Innovations 2025 to 2035
Dry Eye Syndrome Treatment Market Size and Share Forecast Outlook 2025 to 2035
Donohue Syndrome Treatment Market Growth - 2025 to 2035.
Triple X Syndrome Management Market Size and Share Forecast Outlook 2025 to 2035
Barlow’s Syndrome Market Size and Share Forecast Outlook 2025 to 2035
Edward’s Syndrome Treatment Market – Growth & Future Prospects 2025 to 2035
Sjogren's Syndrome Market Size and Share Forecast Outlook 2025 to 2035
Carcinoid Syndrome Management Market
Carcinoid Syndrome Diarrhea Treatment Market
Short sleep syndrome Treatment Market Growth & Demand 2025 to 2035
Klinefelter Syndrome Therapeutics Market - Growth & Demand 2025 to 2035
Central Pain Syndrome Management Market – Size, Share & Growth 2025 to 2035
Acrocallosal Syndrome Therapeutics Market - Trends & Future Growth 2025 to 2035
Adrenogenital Syndrome Treatment Market Size and Share Forecast Outlook 2025 to 2035
Aarskog-Scott Syndrome Treatment Market - Growth & Innovations 2025 to 2035
Andersen-Tawil Syndrome Treatment Market Trends - Growth & Future Prospects 2025 to 2035
Myelodysplastic Syndrome Treatment Market Size and Share Forecast Outlook 2025 to 2035

Thank you!
You will receive an email from our Business Development Manager. Please be sure to check your SPAM/JUNK folder too.
Chat With
MaRIA