The Myelodysplastic Syndrome Treatment Market is estimated to be valued at USD 3.6 billion in 2025 and is projected to reach USD 6.3 billion by 2035, registering a compound annual growth rate (CAGR) of 5.9% over the forecast period.
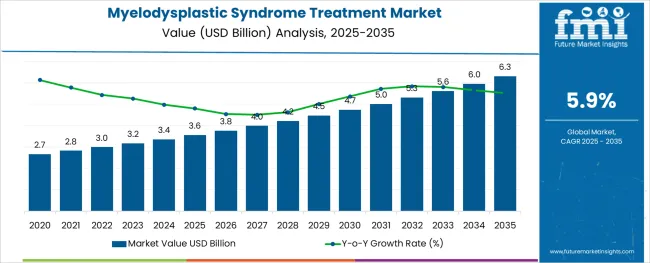
The myelodysplastic syndrome treatment market is growing steadily, driven by the increasing prevalence of hematological disorders and aging populations globally. Clinical insights highlight the complexity of managing subtypes such as Refractory Anemia with Excess Blasts-2 (RAEB-2), which is characterized by aggressive disease progression and requires intensive therapeutic intervention.
Advances in chemotherapy regimens and supportive care have improved treatment outcomes and patient quality of life. Healthcare providers are focusing on early diagnosis and personalized treatment plans, particularly for patients above 50 years who represent the majority of cases.
Furthermore, increasing healthcare investments and awareness about blood cancers have expanded treatment accessibility. The market’s growth is expected to be propelled by ongoing research in novel therapies and combination treatments. Segment growth is anticipated to be led by the RAEB-2 subtype, chemotherapy as the predominant treatment modality, and patients aged above 50 years as the primary patient group.
The market is segmented by Type, Treatment, and Patient Group and region. By Type, the market is divided into Refractory anemia with excess blasts-2 (RAEB-2), Refractory cytopenia with unilineage dysplasia (RCUD), Refractory anemia with ringed sideroblasts (RARS), Refractory cytopenia with multilineage dysplasia (RCMD), Refractory anemia with excess blasts-1 (RAEB-1), Myelodysplastic syndrome, unclassified (MDS-U), and Myelodysplastic syndrome associated with isolated del(5q). In terms of Treatment, the market is classified into Chemotherapy, Immunotherapy, Stem cell transplantation / bone marrow transplantation, and Growth Factors. Based on Patient Group, the market is segmented into Above 50 years and Below 50 years. Regionally, the market is classified into North America, Latin America, Western Europe, Eastern Europe, Balkan & Baltic Countries, Russia & Belarus, Central Asia, East Asia, South Asia & Pacific, and the Middle East & Africa.
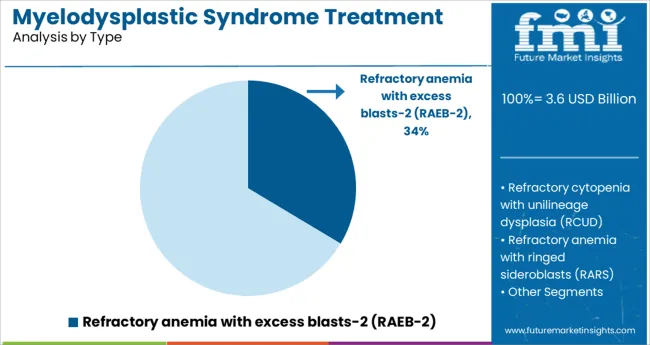
The RAEB-2 segment is projected to account for 33.6% of the myelodysplastic syndrome treatment market revenue in 2025, making it the leading subtype segment. This is driven by the aggressive nature of RAEB-2, which often requires more complex and urgent management compared to other subtypes. Its higher risk of progression to acute myeloid leukemia has prioritized it in clinical treatment strategies.
Physicians have focused on tailored approaches to manage cytopenias and delay disease advancement. The segment benefits from targeted treatment protocols and increased clinical monitoring.
As awareness of this subtype grows, along with improved diagnostic capabilities, RAEB-2 treatment demand is expected to remain strong.
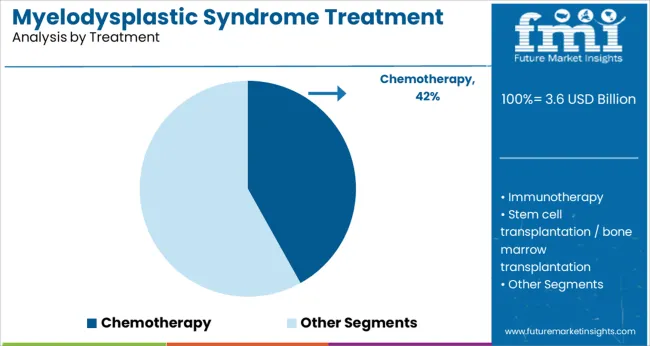
Chemotherapy is forecasted to hold 41.9% of the market share in 2025, maintaining its dominance as the preferred treatment option. It remains a cornerstone therapy due to its ability to target abnormal bone marrow cells and manage disease progression. Treatment regimens have evolved to balance efficacy with tolerability, especially in older patients.
Chemotherapy’s role is critical in reducing blast counts and improving blood cell production, thereby alleviating symptoms and enhancing patient outcomes.
Its integration with supportive therapies and emerging agents has reinforced its clinical utility. The ongoing refinement of chemotherapy protocols supports sustained demand within the market.
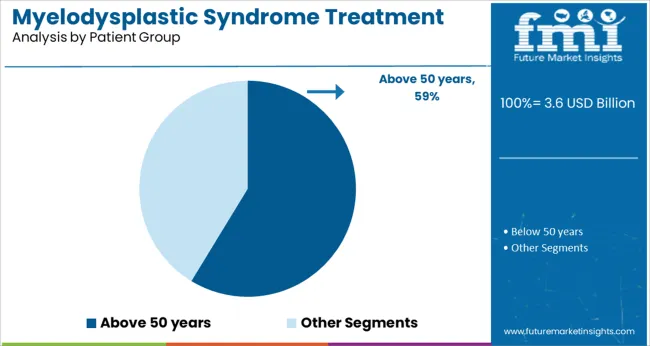
Patients aged above 50 years are projected to represent 58.7% of the myelodysplastic syndrome treatment market in 2025, forming the largest patient group segment. The incidence of myelodysplastic syndromes increases significantly with age, reflecting the cumulative risk factors and bone marrow changes associated with aging.
This demographic often presents with comorbidities that complicate treatment choices, emphasizing the need for tailored therapeutic approaches. Healthcare providers are focusing on balancing treatment effectiveness with quality of life considerations in older patients.
The segment’s size is further driven by the expanding elderly population worldwide and increased diagnostic vigilance. As age remains a primary risk factor for myelodysplastic syndromes, this patient group segment is expected to sustain market leadership.
The myelodysplastic syndrome treatment market size is expected to expand to a significant extent in the coming few years due to increasing mutation in treatments, which cause myelodysplastic syndrome.
Moreover, growing number of patient pool of age 50 and above, and rising government support for cancer treatment augurs well for the myelodysplastic syndrome treatment market future trends.
However, unawareness about such treatments is one of the major factors mitigating the demand for myelodysplastic syndrome treatment.
The complexity and clonal heterogeneity of MDS also pose a challenge to the myelodysplastic syndrome treatment growth as it is frequently unknown, which mutations are early initiating events and are later events that only affect a subclone.
Despite these concerns, researchers are currently testing a number of strategies to try to enhance existing MDS therapeutics, in turn, create numerous myelodysplastic syndrome treatment market opportunities.
One of such myelodysplastic syndrome treatment market trends is the combination therapies that have either additive or synergistic effects in vitro.
Higher response rates than those seen with either drug alone may be possible when azacitidine is combined with lenalidomide or vorinostat (a deacetylase inhibitor currently FDA approved for treating cutaneous T-cell lymphoma).
The myelodysplastic syndrome treatment market outlook is to be swayed by a cooperative group trial in the United States and Canada that are currently investigating whether these combinations will improve patient outcomes in comparison to azacitidine monotherapy.
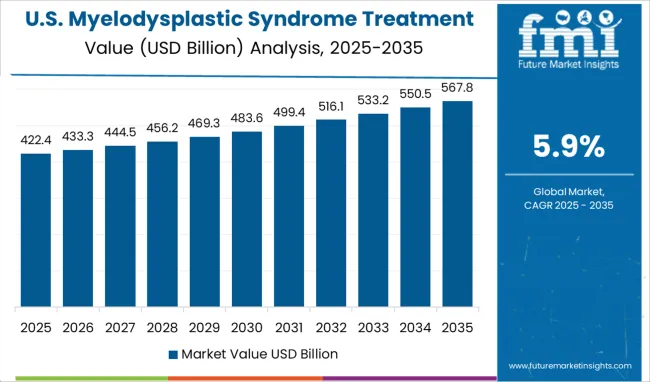
Due to the rising healthcare costs, and rising end-user demand for myelodysplastic syndrome treatment, North America is anticipated to control a myelodysplastic syndrome treatment market share of 34.6% in 2025.
And as the growth is further fostered by the focus of major players and non-profit organisations present on launching new initiatives and public awareness campaigns to inform people about gout disease and support medical professionals.
A growing awareness of MDS among Americans is expected to cause the USA to expand the myelodysplastic syndrome treatment market size over the forecast period.
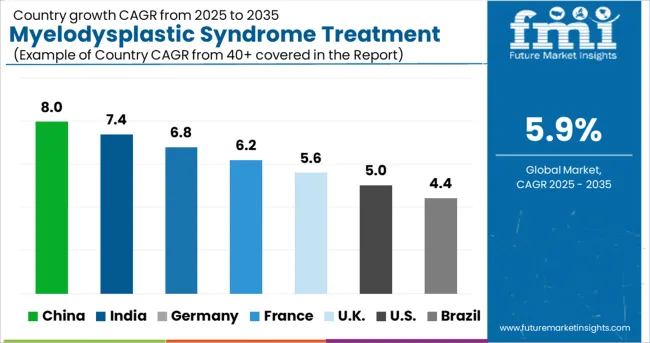
Europe is predicted to experience significant growth and hold a market share of 31.1% in 2025 due to an increase in governmental initiatives for disease diagnosis and treatment.
As an illustration, the European LeukemiaNet WP8 promoted a programme with the goal of creating and regularly updating evidence- and consensus-based guidelines to provide clinical practise recommendations for standardised diagnostic and prognostic procedures and for an appropriate choice of therapeutic interventions in adult patients with primary MDS.
A significant factor that is anticipated to propel the myelodysplastic syndrome treatment market share of Europe is the increasing efforts made by pharmaceutical companies to introduce highly effective therapies for MDS.
The oral medication tamibarotene from Syros Pharmaceuticals has been given orphan drug designation (ODD) by the USA Food and Drug Administration (FDA) to treat myelodysplastic syndrome (MDS).
A selective retinoic acid receptor alpha (RAR) agonist is tamibarotene.
In the Phase III SELECT-MDS-1 clinical trial, oral therapy is currently being evaluated in addition to azacitidine to treat RARA-positive patients with recently discovered higher-risk MDS (HR-MDS).
The effectiveness and safety of the combination therapy are being evaluated in this ongoing trial.
The pivotal trial's results are expected by the company in the fourth quarter of 2020 or the first quarter of 2025.
In 2025, Syros also intends to submit a potential new drug application.
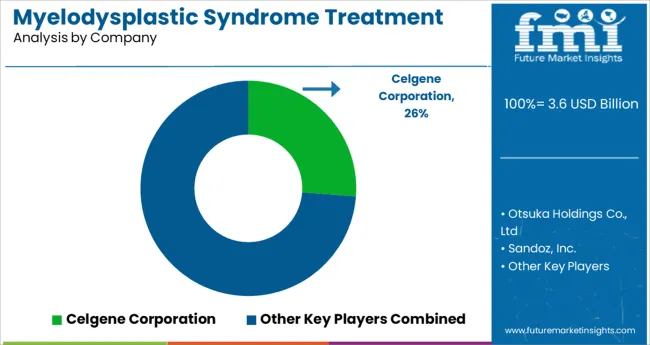
The myelodysplastic syndrome treatment market is consolidated with a presence of few strong players from around the globe.
Some of the players identified in global myelodysplastic syndrome treatment market include Celgene Corporation, Otsuka Holdings Co., Ltd., Sandoz, Inc., Dr. Reddy's Laboratories, Inc., Accord Healthcare Ltd., Mylan N.V., Pfizer, Inc. etc.
Emerging trends in myelodysplastic syndrome treatment market are brought about as a result of the major players' adoption of several growth strategies, including product launches, acquisitions, and collaborations.
Some of the recent developments in the myelodysplastic syndrome treatment market are as follows:
| Report Attribute | Details |
|---|---|
| Growth Rate
|
CAGR of 5.9% from 2025 to 2035 |
| Base Year for Estimation
|
2024 |
| Historical Data
|
2014 to 2024 |
| Forecast Period
|
2025 to 2035 |
| Quantitative Units
|
Revenue in million and CAGR from 2025 to 2035 |
| Report Coverage
|
Revenue Forecast, Volume Forecast, Company Ranking, Competitive Landscape, Growth Factors, Trends and Pricing Analysis |
| Segments Covered
|
Type, Treatment, Patient Group, Region |
| Regions Covered
|
North America; Latin America; Western Europe; Eastern Europe; Asia Pacific excluding Japan; Japan; The Middle East and Africa |
| Key Countries Profiled
|
USA, Canada, Brazil, Argentina, Germany, UK, France, Spain, Italy, Nordics, BENELUX, Australia & New Zealand, China, India, ASEAN, GCC, South Africa |
| Key Companies Profiled
|
Celgene Corporation; Otsuka Holdings Co., Ltd.; Sandoz, Inc.; Dr. Reddy's Laboratories, Inc.; Accord Healthcare Ltd.; Mylan N.V.; Pfizer, Inc. |
| Customization
|
Available Upon Request |
The global myelodysplastic syndrome treatment market is estimated to be valued at USD 3.6 billion in 2025.
It is projected to reach USD 6.3 billion by 2035.
The market is expected to grow at a 5.9% CAGR between 2025 and 2035.
The key product types are refractory anemia with excess blasts-2 (raeb-2), refractory cytopenia with unilineage dysplasia (rcud), refractory anemia with ringed sideroblasts (rars), refractory cytopenia with multilineage dysplasia (rcmd), refractory anemia with excess blasts-1 (raeb-1), myelodysplastic syndrome, unclassified (mds-u) and myelodysplastic syndrome associated with isolated del(5q).
chemotherapy segment is expected to dominate with a 41.9% industry share in 2025.


Full Research Suite comprises of:
Market outlook & trends analysis
Interviews & case studies
Strategic recommendations
Vendor profiles & capabilities analysis
5-year forecasts
8 regions and 60+ country-level data splits
Market segment data splits
12 months of continuous data updates
DELIVERED AS:
PDF EXCEL ONLINE
WHIM Syndrome Management Market Insights and Analysis for 2025 to 2035
Marfan Syndrome Management Market Size and Share Forecast Outlook 2025 to 2035
Kounis Syndrome Market Size and Share Forecast Outlook 2025 to 2035
Laband Syndrome Therapeutics Market Growth - Trends & Future Innovations 2025 to 2035
Dry Eye Syndrome Treatment Market Size and Share Forecast Outlook 2025 to 2035
Donohue Syndrome Treatment Market Growth - 2025 to 2035.
Triple X Syndrome Management Market Size and Share Forecast Outlook 2025 to 2035
Barlow’s Syndrome Market Size and Share Forecast Outlook 2025 to 2035
Edward’s Syndrome Treatment Market – Growth & Future Prospects 2025 to 2035
Sjogren's Syndrome Market Size and Share Forecast Outlook 2025 to 2035
Global Takotsubo Syndrome Therapeutics Market Analysis - Size, Share & Forecast 2025 to 2035
Carcinoid Syndrome Management Market
Carcinoid Syndrome Diarrhea Treatment Market
Klinefelter Syndrome Therapeutics Market - Growth & Demand 2025 to 2035
Short sleep syndrome Treatment Market Growth & Demand 2025 to 2035
Central Pain Syndrome Management Market – Size, Share & Growth 2025 to 2035
Acrocallosal Syndrome Therapeutics Market - Trends & Future Growth 2025 to 2035
Adrenogenital Syndrome Treatment Market Size and Share Forecast Outlook 2025 to 2035
Aarskog-Scott Syndrome Treatment Market - Growth & Innovations 2025 to 2035
Andersen-Tawil Syndrome Treatment Market Trends - Growth & Future Prospects 2025 to 2035

Thank you!
You will receive an email from our Business Development Manager. Please be sure to check your SPAM/JUNK folder too.
Chat With
MaRIA