Kounis Syndrome Market
Market Insights on Kounis Syndrome covering sales outlook, demand forecast & up-to-date key trends
Kounis Syndrome Market by Treatment Procedures, Distribution Channel & Region | Forecast 2023 to 2033
Kounis Syndrome Market Outlook (2023 to 2033)
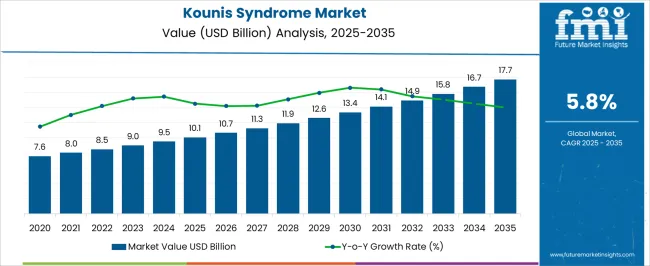
The global kounis syndrome market is expected to garner a market value of US$ 9098.96 Million in 2023 and is expected to accumulate a market value of US$ 15,990 Million by registering a CAGR of 5.8% in the forecast period 2023 to 2033. Growth of the kounis syndrome market can be attributed to the rise in prevalence of chronic diseases, such as coronary artery disease, ischemic heart disease, and vascular diseases, the growing geriatric population, the wide range of products offered by the market players leading the kounis syndrome market to grow in future. The market for kounis syndrome registered a CAGR of 4.1% in the historical period 2017 to 2022
Kounis syndrome is the recurrence of acute coronary syndrome which are associated with mast cell activation. It also refers to a group of diseases in which blood flow to the heart decreases. Conditions related to kounis syndrome include ST-elevation myocardial infarction (STEMI), non-ST elevation myocardial infarction (NSTEMI), and unstable angina. It is a type of coronary heart disease (CHD), which is responsible for one-third of total deaths in people older than 35. Some forms of CHD can be asymptomatic, but ACS is always symptomatic.
Kounis syndrome is a manifestation of coronary heart disease and usually a result of plaque disruption in coronary arteries (atherosclerosis). Cocaine abuse can also lead to vasospasm. A family history of early myocardial infarction (55 years of age) is also a high-risk factor. Antihypertensive drugs are anticipated to show lucrative growth over the forecast period owing to increasing incidences of high blood pressure, myocardial infarction, and stroke.
Report Attribute |
Details |
Expected Market Value (2023) |
US$ 9098.96 Million |
Anticipated Forecast Value (2033) |
US$ 15,990 Million |
Projected Growth Rate (2023 to 2033) |
5.8% CAGR |
Don't pay for what you don't need
Customize your report by selecting specific countries or regions and save 30%!
2017 to 2022 Kounis Syndrome Market Demand Analysis vs. Forecast 2023 to 2033
According to market research and competitive intelligence provider Future Market Insights- the market for Kounis syndrome reflected a value of 4.1% during the historical period, 2017 to 2022.
The number of elderly people reporting respective cardiovascular diseases is high. Owing to this, it is anticipated that the ever-increasing geriatric population, which is expected to rise in future years worldwide mainly in the Middle East and Africa & Asia-Pacific region, creates an opportunity for market growth in the forecast period. In addition, the integration of technological advancements for manufacturing medication to treat kounis syndrome is expected to boost the growth of the market.
Thus, the market for Kounis syndrome is expected to register a CAGR of 5.8% in the forecast period 2023 to 2033.
Which are Some Prominent Drivers of Kounis Syndrome Market?
Research and development of medication and treatment supporting market growth
The rise in the prevalence of chronic diseases, such as coronary artery disease, ischemic heart disease, and vascular diseases the key reason for the growth of the kounis syndrome market. As the companies are constantly engaged in research and developmental activities, the knowledge about the prevalence of chronic heart and vascular diseases would help in finding novel solutions, and developing the cardiology and vascular devices would aid in more collaborations and partnerships with market players in the US, Europe, and Asia Pacific region.
This signifies that the increase in research and development investment for the discovery and development of treatments for kounis syndrome boosts the market growth.
Wide range of products offered by market players boosting Kounis syndrome market growth
Strategic product launches and collaborations done by major companies in interventional cardiology and peripheral vascular devices have opened up an opportunity to expand their business in various regions.
This strategy is allowing the companies to strengthen their footprints in the market. Therefore, it is predicted that strategic initiative is the golden opportunity for the market players to accelerate their revenue growth in the market.
The surge in technological advancements for cardiovascular disease creates lucrative opportunities for Kounis syndrome market
As technology advances rapidly, it improves how one manages cardiovascular diseases. In addition, recent healthcare monitoring applications and gadgets have enhanced the connection between patients and healthcare providers to update treatment plans and improve health outcomes. Thus, this is expected to create a significant opportunity for the global kounis market in the forecast period.
Also, governments in emerging markets (China, Brazil, Russia, India, and South Africa) reform public healthcare and grant more accessible access to medicine. These two factors working in unison mean greater freedom for market developments and increased innovation in clinical research in emerging markets.
Find your sweet spots for generating winning opportunities in this market.
Talk to AnalystWhat are the Challenges Faced by the Kounis Syndrome Market?
Expensive nature of treatment and cardiology devices hampering the overall market growth
The rise in the cost of therapeutic surgery and the lack of accessibility to disease management services and support in low-economic countries are the restraints and challenges for the growth of kounis syndrome market.
The increased intricacy and cost of the cardiology devices and robust investments would increase the costs. The increased cost would result in delayed treatment of the patients in hospitals and clinics and clearance of this product is very rigorous and time-consuming many of the products find it difficult to get approved due to not complying with the regulations which may hamper the market growth.
Region-Wise Insights
Growing Prevalence of Heart Diseases Creating Lucrative Opportunities for Product Development in Kounis Syndrome Market?
Research and development activities finding novel solutions for the treatment of kounis syndrome
The major factor driving the growth of the kounis syndrome market rises in the prevalence of chronic diseases along with the growing geriatric population, and the wide range of products offered by market players leading the kounis syndrome market to grow in the future.
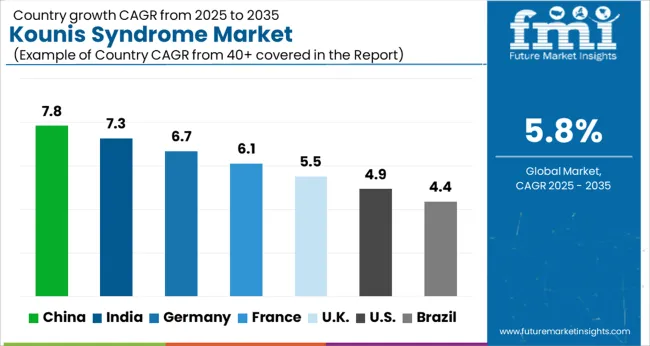
As the companies are constantly engaged in research and developmental activities, the knowledge about the prevalence of chronic heart and vascular diseases would help in finding novel solutions, and developing the cardiology and vascular devices would aid in more collaborations and partnerships with market players in the US, Europe, and Asia Pacific region. This signifies that the increase in research and development investment for the discovery and development of treatments of kounis syndrome boosts the market growth. Thus, North America is expected to possess a 40% market share of kounis syndrome market in 2023.
Sedentary Lifestyle Increasing Prevalence of Kounis Syndrome Market in Asia Pacific?
Lifestyle changes increasing the risk of kounis syndrome in Asia Pacific
ESCAP suggests that Asia Pacific is aging faster than any other region in the world. This, in turn, increases the number of people suffering from ailments in the Asia Pacific region. Fast-paced and sedentary lifestyles in the Asia Pacific region in countries like India, China, and Japan are increasing the prevalence of kounis syndrome
Furthermore, an increase in smoking, hypertension, diabetes, hyperlipidemia, physical inactivity, family obesity, and poor nutritional practices are other key factors leading to the growth of kounis syndrome in the Asia Pacific region. Thus, Asia Pacific is expected to possess a 36% market share of kounis syndrome market in 2023.
Get the data you need at a Fraction of the cost
Personalize your report by choosing insights you need
and save 40%!
Category-Wise Insights
Availability of Various Treatments Making Hospitals and Clinics Convenient for Treatment for Kounis Syndrome Market?
Favorable reimbursement policies make hospitals a viable option for treatment
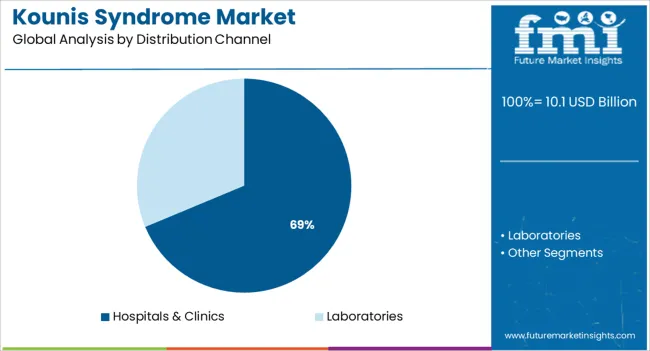
On the basis of distribution channel, the kounsin syndrome market is segmented into Laboratories Hospitals & Clinics
The hospital segment is expected to hold the largest market share for kounis syndrome. This is owing to the availability of various treatments and diagnostics in hospitals. In addition, the presence of healthcare experts and cardiologists is playing a key role in the wide usage of hospitals for the treatment of kounis syndrome.
In addition, initiatives by government authorities to support the treatment of kounis syndrome, especially in hospitals are favoring the growth of the same. Moreover, reimbursement schemes and their benefits are making hospitals a go-to option for the treatment of kounis syndrome. Thus, hospitals and clinics are expected to hold a 55% market share of kounis syndrome market in 2023.
Start-Ups for Kounis Syndrome Market
Key start-up players in the kounis syndrome market are CardioDX, Verily, CVRX, BlueRock Therapeutics, CARMAT, and Cleerly
- Verily, a key start-up player in the kounis syndrome market is focusing on enabling more continuous health data collection for timely decision-making and effective interventions. This, in turn, will help the start-up to treat-related diseases at an early stage.
- CardioDx, another start-up player in the kounis syndrome market is focusing on developing clinically validated genomic tests to aid in assessing and tailoring care of individuals with cardiovascular disease, including coronary artery disease (CAD), cardiac arrhythmias, and heart failure.
Market Competition
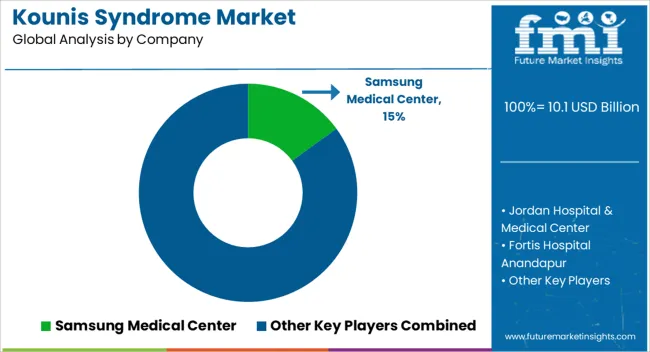
Key players in the kounis syndrome market are Jordan Hospital & Medical Center, Fortis Hospital Anandapur, Samsung Medical Center, Hospital Mae de Deus, Premier Medica, National Taiwan University Hospital, Muro General Hospital, Herzinstitut Berlin, Kyung Hee University Hospital, HELIOS Dr. Horst Schmidt Hospital Wiesbaden
- Premier Medica, a key player in the kounis syndrome market is focusing on developing medication for treating the ailment by using advanced technology to identify the same at an early stage.
- Jordan Hospital & Medical Center is focusing on using advanced technology for identifying heart-related ailments. Moreover, the hospital specializes in cardiothoracic surgeries.
Report Scope
Report Attribute |
Details |
Market Value in 2023 |
US$ 9098.96 Million |
Market Value in 2033 |
US$ 15,990 Million |
Growth Rate |
CAGR of 5.8% from 2023 to 2033 |
Base Year for Estimation |
2022 |
Historical Data |
2017 to 2022 |
Forecast Period |
2023 to 2033 |
Quantitative Units |
Revenue in USD Million and CAGR from 2023 to 2033 |
Report Coverage |
Revenue Forecast, Volume Forecast, Company Ranking, Competitive Landscape, Growth Factors, Trends, and Pricing Analysis |
Segments Covered |
|
Regions Covered |
|
Key Countries Profiled |
|
Key Companies Profiled |
|
Customization |
Available Upon Request |
Key Segments Profiled in the Kounis Syndrome Market Survey
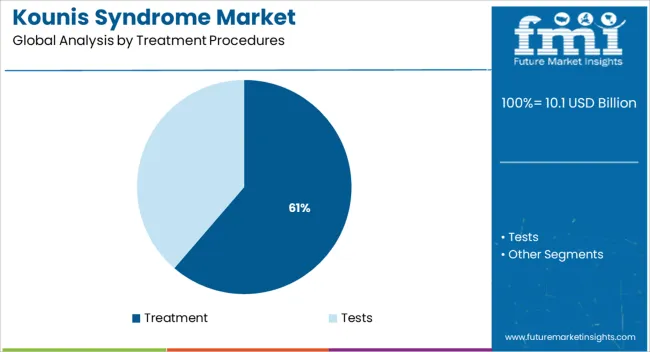
Treatment Procedures:
- Tests
- Blood tests
- Chest X-Ray
- ECG
- EKG
- MRI
- Angiography
- Treatment
- Beta-lactam antibiotics
- Non-steroidal anti-inflammatory drugs
- Rocuronium
- Others
Distribution Channel:
- Laboratories
- Hospitals & Clinics
Region:
- North America
- Latin America
- Europe
- South Asia
- East Asia
- Oceania
- Middle East & Africa (MEA)
Frequently Asked Questions
At what rate did the Kounis syndrome market flourish from 2017 to 2022?
From 2017 to 2022, the Kounis syndrome market grew at a CAGR of 4.1%
What will be the growth rate of the global Kounis syndrome market during the forecast period?
The global Kounis syndrome market is expected to grow with a 5.8% CAGR from 2023 to 2033.
What will be the projected market size of the Kounis syndrome market by 2033?
As of 2033, the Kounis syndrome market is expected to reach US$ 15,990 Million
Which end user segment is expected to dominate the global Kounis syndrome market during 2033?
The hospitals and clinics segment is expected to hold 55% of the market share in 2023 for the Kounis syndrome market.
How is the North America Kounis syndrome market projected to grow in 2033?
North America is expected to possess a 40% market share for the Kounis syndrome market in 2023.
How is the Asia Pacific Kounis syndrome market projected to grow in 2033?
Asia Pacific Kounis syndrome market size is expected to possess a 36% market share in 2023.
Table of Content
1. Executive Summary | Kounis Syndrome Market 1.1. Global Market Outlook 1.2. Demand-side Trends 1.3. Supply-side Trends 1.4. Technology Roadmap Analysis 1.5. Analysis and Recommendations 2. Market Overview 2.1. Market Coverage / Taxonomy 2.2. Market Definition / Scope / Limitations 3. Market Background 3.1. Market Dynamics 3.1.1. Drivers 3.1.2. Restraints 3.1.3. Opportunity 3.1.4. Trends 3.2. Scenario Forecast 3.2.1. Demand in Optimistic Scenario 3.2.2. Demand in Likely Scenario 3.2.3. Demand in Conservative Scenario 3.3. Opportunity Map Analysis 3.4. Investment Feasibility Matrix 3.5. PESTLE and Porter’s Analysis 3.6. Regulatory Landscape 3.6.1. By Key Regions 3.6.2. By Key Countries 3.7. Regional Parent Market Outlook 4. GlobalMarket Analysis 2018 to 2022 and Forecast, 2023 to 2033 4.1. Historical Market Size Value (US$ Million) Analysis, 2018 to 2022 4.2. Current and Future Market Size Value (US$ Million) Projections, 2023 to 2033 4.2.1. Y-o-Y Growth Trend Analysis 4.2.2. Absolute $ Opportunity Analysis 5. Global Market Analysis 2018 to 2022 and Forecast 2023 to 2033, By Treatment Procedure 5.1. Introduction / Key Findings 5.2. Historical Market Size Value (US$ Million) Analysis By Treatment Procedure, 2018 to 2022 5.3. Current and Future Market Size Value (US$ Million) Analysis and Forecast By Treatment Procedure, 2023 to 2033 5.3.1. Tests 5.3.1.1. Blood tests 5.3.1.2. Chest x-ray 5.3.1.3. ECG 5.3.1.4. EKG 5.3.1.5. MRI 5.3.1.6. Angiography 5.3.2. Treatment 5.3.2.1. Beta-lactam antibiotics 5.3.2.2. Non-steroidal anti-inflammatory drugs 5.3.2.3. Rocuronium 5.3.2.4. Others 5.4. Y-o-Y Growth Trend Analysis By Treatment Procedure, 2018 to 2022 5.5. Absolute $ Opportunity Analysis By Treatment Procedure, 2023 to 2033 6. Global Market Analysis 2018 to 2022 and Forecast 2023 to 2033, By Distribution Channel 6.1. Introduction / Key Findings 6.2. Historical Market Size Value (US$ Million) Analysis By Distribution Channel, 2018 to 2022 6.3. Current and Future Market Size Value (US$ Million) Analysis and Forecast By Distribution Channel, 2023 to 2033 6.3.1. Laboratories 6.3.2. Hospitals & Clinics 6.4. Y-o-Y Growth Trend Analysis By Distribution Channel, 2018 to 2022 6.5. Absolute $ Opportunity Analysis By Distribution Channel, 2023 to 2033 7. GlobalMarket Analysis 2018 to 2022 and Forecast 2023 to 2033, By Region 7.1. Introduction 7.2. Historical Market Size Value (US$ Million) Analysis By Region, 2018 to 2022 7.3. Current Market Size Value (US$ Million) Analysis and Forecast By Region, 2023 to 2033 7.3.1. North America 7.3.2. Latin America 7.3.3. Europe 7.3.4. South Asia 7.3.5. East Asia 7.3.6. Oceania 7.3.7. Middle East & Africa (MEA) 7.4. Market Attractiveness Analysis By Region 8. North America Market Analysis 2018 to 2022 and Forecast 2023 to 2033, By Country 8.1. Historical Market Size Value (US$ Million) Trend Analysis By Market Taxonomy, 2018 to 2022 8.2. Market Size Value (US$ Million) Forecast By Market Taxonomy, 2023 to 2033 8.2.1. By Country 8.2.1.1. The US 8.2.1.2. Canada 8.2.2. By Treatment Procedure 8.2.3. By Distribution Channel 8.3. Market Attractiveness Analysis 8.3.1. By Country 8.3.2. By Treatment Procedure 8.3.3. By Distribution Channel 8.4. Key Takeaways 9. Latin America Market Analysis 2018 to 2022 and Forecast 2023 to 2033, By Country 9.1. Historical Market Size Value (US$ Million) Trend Analysis By Market Taxonomy, 2018 to 2022 9.2. Market Size Value (US$ Million) Forecast By Market Taxonomy, 2023 to 2033 9.2.1. By Country 9.2.1.1. Brazil 9.2.1.2. Mexico 9.2.1.3. Rest of Latin America 9.2.2. By Treatment Procedure 9.2.3. By Distribution Channel 9.3. Market Attractiveness Analysis 9.3.1. By Country 9.3.2. By Treatment Procedure 9.3.3. By Distribution Channel 9.4. Key Takeaways 10. Europe Market Analysis 2018 to 2022 and Forecast 2023 to 2033, By Country 10.1. Historical Market Size Value (US$ Million) Trend Analysis By Market Taxonomy, 2018 to 2022 10.2. Market Size Value (US$ Million) Forecast By Market Taxonomy, 2023 to 2033 10.2.1. By Country 10.2.1.1. Germany 10.2.1.2. The UK 10.2.1.3. France 10.2.1.4. Spain 10.2.1.5. Italy 10.2.1.6. Rest of Europe 10.2.2. By Treatment Procedure 10.2.3. By Distribution Channel 10.3. Market Attractiveness Analysis 10.3.1. By Country 10.3.2. By Treatment Procedure 10.3.3. By Distribution Channel 10.4. Key Takeaways 11. South Asia Market Analysis 2018 to 2022 and Forecast 2023 to 2033, By Country 11.1. Historical Market Size Value (US$ Million) Trend Analysis By Market Taxonomy, 2018 to 2022 11.2. Market Size Value (US$ Million) Forecast By Market Taxonomy, 2023 to 2033 11.2.1. By Country 11.2.1.1. India 11.2.1.2. Malaysia 11.2.1.3. Singapore 11.2.1.4. Thailand 11.2.1.5. Rest of South Asia 11.2.2. By Treatment Procedure 11.2.3. By Distribution Channel 11.3. Market Attractiveness Analysis 11.3.1. By Country 11.3.2. By Treatment Procedure 11.3.3. By Distribution Channel 11.4. Key Takeaways 12. East Asia Market Analysis 2018 to 2022 and Forecast 2023 to 2033, By Country 12.1. Historical Market Size Value (US$ Million) Trend Analysis By Market Taxonomy, 2018 to 2022 12.2. Market Size Value (US$ Million) Forecast By Market Taxonomy, 2023 to 2033 12.2.1. By Country 12.2.1.1. China 12.2.1.2. Japan 12.2.1.3. South Korea 12.2.2. By Treatment Procedure 12.2.3. By Distribution Channel 12.3. Market Attractiveness Analysis 12.3.1. By Country 12.3.2. By Treatment Procedure 12.3.3. By Distribution Channel 12.4. Key Takeaways 13. Oceania Market Analysis 2018 to 2022 and Forecast 2023 to 2033, By Country 13.1. Historical Market Size Value (US$ Million) Trend Analysis By Market Taxonomy, 2018 to 2022 13.2. Market Size Value (US$ Million) Forecast By Market Taxonomy, 2023 to 2033 13.2.1. By Country 13.2.1.1. Australia 13.2.1.2. New Zealand 13.2.2. By Treatment Procedure 13.2.3. By Distribution Channel 13.3. Market Attractiveness Analysis 13.3.1. By Country 13.3.2. By Treatment Procedure 13.3.3. By Distribution Channel 13.4. Key Takeaways 14. MEA Market Analysis 2018 to 2022 and Forecast 2023 to 2033, By Country 14.1. Historical Market Size Value (US$ Million) Trend Analysis By Market Taxonomy, 2018 to 2022 14.2. Market Size Value (US$ Million) Forecast By Market Taxonomy, 2023 to 2033 14.2.1. By Country 14.2.1.1. GCC Countries 14.2.1.2. South Africa 14.2.1.3. Israel 14.2.1.4. Rest of MEA 14.2.2. By Treatment Procedure 14.2.3. By Distribution Channel 14.3. Market Attractiveness Analysis 14.3.1. By Country 14.3.2. By Treatment Procedure 14.3.3. By Distribution Channel 14.4. Key Takeaways 15. Key Countries Market Analysis 15.1. The US 15.1.1. Pricing Analysis 15.1.2. Market Share Analysis, 2022 15.1.2.1. By Treatment Procedure 15.1.2.2. By Distribution Channel 15.2. Canada 15.2.1. Pricing Analysis 15.2.2. Market Share Analysis, 2022 15.2.2.1. By Treatment Procedure 15.2.2.2. By Distribution Channel 15.3. Brazil 15.3.1. Pricing Analysis 15.3.2. Market Share Analysis, 2022 15.3.2.1. By Treatment Procedure 15.3.2.2. By Distribution Channel 15.4. Mexico 15.4.1. Pricing Analysis 15.4.2. Market Share Analysis, 2022 15.4.2.1. By Treatment Procedure 15.4.2.2. By Distribution Channel 15.5. Germany 15.5.1. Pricing Analysis 15.5.2. Market Share Analysis, 2022 15.5.2.1. By Treatment Procedure 15.5.2.2. By Distribution Channel 15.6. The UK 15.6.1. Pricing Analysis 15.6.2. Market Share Analysis, 2022 15.6.2.1. By Treatment Procedure 15.6.2.2. By Distribution Channel 15.7. France 15.7.1. Pricing Analysis 15.7.2. Market Share Analysis, 2022 15.7.2.1. By Treatment Procedure 15.7.2.2. By Distribution Channel 15.8. Spain 15.8.1. Pricing Analysis 15.8.2. Market Share Analysis, 2022 15.8.2.1. By Treatment Procedure 15.8.2.2. By Distribution Channel 15.9. Italy 15.9.1. Pricing Analysis 15.9.2. Market Share Analysis, 2022 15.9.2.1. By Treatment Procedure 15.9.2.2. By Distribution Channel 15.10. India 15.10.1. Pricing Analysis 15.10.2. Market Share Analysis, 2022 15.10.2.1. By Treatment Procedure 15.10.2.2. By Distribution Channel 15.11. Malaysia 15.11.1. Pricing Analysis 15.11.2. Market Share Analysis, 2022 15.11.2.1. By Treatment Procedure 15.11.2.2. By Distribution Channel 15.12. Singapore 15.12.1. Pricing Analysis 15.12.2. Market Share Analysis, 2022 15.12.2.1. By Treatment Procedure 15.12.2.2. By Distribution Channel 15.13. Thailand 15.13.1. Pricing Analysis 15.13.2. Market Share Analysis, 2022 15.13.2.1. By Treatment Procedure 15.13.2.2. By Distribution Channel 15.14. China 15.14.1. Pricing Analysis 15.14.2. Market Share Analysis, 2022 15.14.2.1. By Treatment Procedure 15.14.2.2. By Distribution Channel 15.15. Japan 15.15.1. Pricing Analysis 15.15.2. Market Share Analysis, 2022 15.15.2.1. By Treatment Procedure 15.15.2.2. By Distribution Channel 15.16. South Korea 15.16.1. Pricing Analysis 15.16.2. Market Share Analysis, 2022 15.16.2.1. By Treatment Procedure 15.16.2.2. By Distribution Channel 15.17. Australia 15.17.1. Pricing Analysis 15.17.2. Market Share Analysis, 2022 15.17.2.1. By Treatment Procedure 15.17.2.2. By Distribution Channel 15.18. New Zealand 15.18.1. Pricing Analysis 15.18.2. Market Share Analysis, 2022 15.18.2.1. By Treatment Procedure 15.18.2.2. By Distribution Channel 15.19. GCC Countries 15.19.1. Pricing Analysis 15.19.2. Market Share Analysis, 2022 15.19.2.1. By Treatment Procedure 15.19.2.2. By Distribution Channel 15.20. South Africa 15.20.1. Pricing Analysis 15.20.2. Market Share Analysis, 2022 15.20.2.1. By Treatment Procedure 15.20.2.2. By Distribution Channel 15.21. Israel 15.21.1. Pricing Analysis 15.21.2. Market Share Analysis, 2022 15.21.2.1. By Treatment Procedure 15.21.2.2. By Distribution Channel 16. Market Structure Analysis 16.1. Competition Dashboard 16.2. Competition Benchmarking 16.3. Market Share Analysis of Top Players 16.3.1. By Regional 16.3.2. By Treatment Procedure 16.3.3. By Distribution Channel 17. Competition Analysis 17.1. Competition Deep Dive 17.1.1. Jordan Hospital & Medical Center 17.1.1.1. Overview 17.1.1.2. Product Portfolio 17.1.1.3. Profitability by Market Segments 17.1.1.4. Sales Footprint 17.1.1.5. Strategy Overview 17.1.1.5.1. Marketing Strategy 17.1.2. Fortis Hospital Anandapur 17.1.2.1. Overview 17.1.2.2. Product Portfolio 17.1.2.3. Profitability by Market Segments 17.1.2.4. Sales Footprint 17.1.2.5. Strategy Overview 17.1.2.5.1. Marketing Strategy 17.1.3. Samsung Medical Center 17.1.3.1. Overview 17.1.3.2. Product Portfolio 17.1.3.3. Profitability by Market Segments 17.1.3.4. Sales Footprint 17.1.3.5. Strategy Overview 17.1.3.5.1. Marketing Strategy 17.1.4. Hospital Mae de Deus 17.1.4.1. Overview 17.1.4.2. Product Portfolio 17.1.4.3. Profitability by Market Segments 17.1.4.4. Sales Footprint 17.1.4.5. Strategy Overview 17.1.4.5.1. Marketing Strategy 17.1.5. Premier Medica 17.1.5.1. Overview 17.1.5.2. Product Portfolio 17.1.5.3. Profitability by Market Segments 17.1.5.4. Sales Footprint 17.1.5.5. Strategy Overview 17.1.5.5.1. Marketing Strategy 17.1.6. National Taiwan University Hospital 17.1.6.1. Overview 17.1.6.2. Product Portfolio 17.1.6.3. Profitability by Market Segments 17.1.6.4. Sales Footprint 17.1.6.5. Strategy Overview 17.1.6.5.1. Marketing Strategy 17.1.7. Muro General Hospital 17.1.7.1. Overview 17.1.7.2. Product Portfolio 17.1.7.3. Profitability by Market Segments 17.1.7.4. Sales Footprint 17.1.7.5. Strategy Overview 17.1.7.5.1. Marketing Strategy 17.1.8. Herzinstitut Berlin 17.1.8.1. Overview 17.1.8.2. Product Portfolio 17.1.8.3. Profitability by Market Segments 17.1.8.4. Sales Footprint 17.1.8.5. Strategy Overview 17.1.8.5.1. Marketing Strategy 17.1.9. Kyung Hee University Hospital 17.1.9.1. Overview 17.1.9.2. Product Portfolio 17.1.9.3. Profitability by Market Segments 17.1.9.4. Sales Footprint 17.1.9.5. Strategy Overview 17.1.9.5.1. Marketing Strategy 17.1.10. HELIOS Dr. Horst Schmidt Hospital Wiesbaden 17.1.10.1. Overview 17.1.10.2. Product Portfolio 17.1.10.3. Profitability by Market Segments 17.1.10.4. Sales Footprint 17.1.10.5. Strategy Overview 17.1.10.5.1. Marketing Strategy 18. Assumptions & Acronyms Used 19. Research Methodology
Don't pay for what you don't need
Customize your report by selecting specific countries or regions and save 30%!
List of Tables
Table 1: Global Market Value (US$ Million) Forecast by Region, 2018 to 2033 Table 2: Global Market Value (US$ Million) Forecast by Treatment Procedure, 2018 to 2033 Table 3: Global Market Value (US$ Million) Forecast by Distribution Channel, 2018 to 2033 Table 4: North America Market Value (US$ Million) Forecast by Country, 2018 to 2033 Table 5: North America Market Value (US$ Million) Forecast by Treatment Procedure, 2018 to 2033 Table 6: North America Market Value (US$ Million) Forecast by Distribution Channel, 2018 to 2033 Table 7: Latin America Market Value (US$ Million) Forecast by Country, 2018 to 2033 Table 8: Latin America Market Value (US$ Million) Forecast by Treatment Procedure, 2018 to 2033 Table 9: Latin America Market Value (US$ Million) Forecast by Distribution Channel, 2018 to 2033 Table 10: Europe Market Value (US$ Million) Forecast by Country, 2018 to 2033 Table 11: Europe Market Value (US$ Million) Forecast by Treatment Procedure, 2018 to 2033 Table 12: Europe Market Value (US$ Million) Forecast by Distribution Channel, 2018 to 2033 Table 13: South Asia Market Value (US$ Million) Forecast by Country, 2018 to 2033 Table 14: South Asia Market Value (US$ Million) Forecast by Treatment Procedure, 2018 to 2033 Table 15: South Asia Market Value (US$ Million) Forecast by Distribution Channel, 2018 to 2033 Table 16: East Asia Market Value (US$ Million) Forecast by Country, 2018 to 2033 Table 17: East Asia Market Value (US$ Million) Forecast by Treatment Procedure, 2018 to 2033 Table 18: East Asia Market Value (US$ Million) Forecast by Distribution Channel, 2018 to 2033 Table 19: Oceania Market Value (US$ Million) Forecast by Country, 2018 to 2033 Table 20: Oceania Market Value (US$ Million) Forecast by Treatment Procedure, 2018 to 2033 Table 21: Oceania Market Value (US$ Million) Forecast by Distribution Channel, 2018 to 2033 Table 22: MEA Market Value (US$ Million) Forecast by Country, 2018 to 2033 Table 23: MEA Market Value (US$ Million) Forecast by Treatment Procedure, 2018 to 2033 Table 24: MEA Market Value (US$ Million) Forecast by Distribution Channel, 2018 to 2033
Find your sweet spots for generating winning opportunities in this market.
Talk to AnalystList of Charts
Figure 1: Global Market Value (US$ Million) by Treatment Procedure, 2023 to 2033 Figure 2: Global Market Value (US$ Million) by Distribution Channel, 2023 to 2033 Figure 3: Global Market Value (US$ Million) by Region, 2023 to 2033 Figure 4: Global Market Value (US$ Million) Analysis by Region, 2018 to 2033 Figure 5: Global Market Value Share (%) and BPS Analysis by Region, 2023 to 2033 Figure 6: Global Market Y-o-Y Growth (%) Projections by Region, 2023 to 2033 Figure 7: Global Market Value (US$ Million) Analysis by Treatment Procedure, 2018 to 2033 Figure 8: Global Market Value Share (%) and BPS Analysis by Treatment Procedure, 2023 to 2033 Figure 9: Global Market Y-o-Y Growth (%) Projections by Treatment Procedure, 2023 to 2033 Figure 10: Global Market Value (US$ Million) Analysis by Distribution Channel, 2018 to 2033 Figure 11: Global Market Value Share (%) and BPS Analysis by Distribution Channel, 2023 to 2033 Figure 12: Global Market Y-o-Y Growth (%) Projections by Distribution Channel, 2023 to 2033 Figure 13: Global Market Attractiveness by Treatment Procedure, 2023 to 2033 Figure 14: Global Market Attractiveness by Distribution Channel, 2023 to 2033 Figure 15: Global Market Attractiveness by Region, 2023 to 2033 Figure 16: North America Market Value (US$ Million) by Treatment Procedure, 2023 to 2033 Figure 17: North America Market Value (US$ Million) by Distribution Channel, 2023 to 2033 Figure 18: North America Market Value (US$ Million) by Country, 2023 to 2033 Figure 19: North America Market Value (US$ Million) Analysis by Country, 2018 to 2033 Figure 20: North America Market Value Share (%) and BPS Analysis by Country, 2023 to 2033 Figure 21: North America Market Y-o-Y Growth (%) Projections by Country, 2023 to 2033 Figure 22: North America Market Value (US$ Million) Analysis by Treatment Procedure, 2018 to 2033 Figure 23: North America Market Value Share (%) and BPS Analysis by Treatment Procedure, 2023 to 2033 Figure 24: North America Market Y-o-Y Growth (%) Projections by Treatment Procedure, 2023 to 2033 Figure 25: North America Market Value (US$ Million) Analysis by Distribution Channel, 2018 to 2033 Figure 26: North America Market Value Share (%) and BPS Analysis by Distribution Channel, 2023 to 2033 Figure 27: North America Market Y-o-Y Growth (%) Projections by Distribution Channel, 2023 to 2033 Figure 28: North America Market Attractiveness by Treatment Procedure, 2023 to 2033 Figure 29: North America Market Attractiveness by Distribution Channel, 2023 to 2033 Figure 30: North America Market Attractiveness by Country, 2023 to 2033 Figure 31: Latin America Market Value (US$ Million) by Treatment Procedure, 2023 to 2033 Figure 32: Latin America Market Value (US$ Million) by Distribution Channel, 2023 to 2033 Figure 33: Latin America Market Value (US$ Million) by Country, 2023 to 2033 Figure 34: Latin America Market Value (US$ Million) Analysis by Country, 2018 to 2033 Figure 35: Latin America Market Value Share (%) and BPS Analysis by Country, 2023 to 2033 Figure 36: Latin America Market Y-o-Y Growth (%) Projections by Country, 2023 to 2033 Figure 37: Latin America Market Value (US$ Million) Analysis by Treatment Procedure, 2018 to 2033 Figure 38: Latin America Market Value Share (%) and BPS Analysis by Treatment Procedure, 2023 to 2033 Figure 39: Latin America Market Y-o-Y Growth (%) Projections by Treatment Procedure, 2023 to 2033 Figure 40: Latin America Market Value (US$ Million) Analysis by Distribution Channel, 2018 to 2033 Figure 41: Latin America Market Value Share (%) and BPS Analysis by Distribution Channel, 2023 to 2033 Figure 42: Latin America Market Y-o-Y Growth (%) Projections by Distribution Channel, 2023 to 2033 Figure 43: Latin America Market Attractiveness by Treatment Procedure, 2023 to 2033 Figure 44: Latin America Market Attractiveness by Distribution Channel, 2023 to 2033 Figure 45: Latin America Market Attractiveness by Country, 2023 to 2033 Figure 46: Europe Market Value (US$ Million) by Treatment Procedure, 2023 to 2033 Figure 47: Europe Market Value (US$ Million) by Distribution Channel, 2023 to 2033 Figure 48: Europe Market Value (US$ Million) by Country, 2023 to 2033 Figure 49: Europe Market Value (US$ Million) Analysis by Country, 2018 to 2033 Figure 50: Europe Market Value Share (%) and BPS Analysis by Country, 2023 to 2033 Figure 51: Europe Market Y-o-Y Growth (%) Projections by Country, 2023 to 2033 Figure 52: Europe Market Value (US$ Million) Analysis by Treatment Procedure, 2018 to 2033 Figure 53: Europe Market Value Share (%) and BPS Analysis by Treatment Procedure, 2023 to 2033 Figure 54: Europe Market Y-o-Y Growth (%) Projections by Treatment Procedure, 2023 to 2033 Figure 55: Europe Market Value (US$ Million) Analysis by Distribution Channel, 2018 to 2033 Figure 56: Europe Market Value Share (%) and BPS Analysis by Distribution Channel, 2023 to 2033 Figure 57: Europe Market Y-o-Y Growth (%) Projections by Distribution Channel, 2023 to 2033 Figure 58: Europe Market Attractiveness by Treatment Procedure, 2023 to 2033 Figure 59: Europe Market Attractiveness by Distribution Channel, 2023 to 2033 Figure 60: Europe Market Attractiveness by Country, 2023 to 2033 Figure 61: South Asia Market Value (US$ Million) by Treatment Procedure, 2023 to 2033 Figure 62: South Asia Market Value (US$ Million) by Distribution Channel, 2023 to 2033 Figure 63: South Asia Market Value (US$ Million) by Country, 2023 to 2033 Figure 64: South Asia Market Value (US$ Million) Analysis by Country, 2018 to 2033 Figure 65: South Asia Market Value Share (%) and BPS Analysis by Country, 2023 to 2033 Figure 66: South Asia Market Y-o-Y Growth (%) Projections by Country, 2023 to 2033 Figure 67: South Asia Market Value (US$ Million) Analysis by Treatment Procedure, 2018 to 2033 Figure 68: South Asia Market Value Share (%) and BPS Analysis by Treatment Procedure, 2023 to 2033 Figure 69: South Asia Market Y-o-Y Growth (%) Projections by Treatment Procedure, 2023 to 2033 Figure 70: South Asia Market Value (US$ Million) Analysis by Distribution Channel, 2018 to 2033 Figure 71: South Asia Market Value Share (%) and BPS Analysis by Distribution Channel, 2023 to 2033 Figure 72: South Asia Market Y-o-Y Growth (%) Projections by Distribution Channel, 2023 to 2033 Figure 73: South Asia Market Attractiveness by Treatment Procedure, 2023 to 2033 Figure 74: South Asia Market Attractiveness by Distribution Channel, 2023 to 2033 Figure 75: South Asia Market Attractiveness by Country, 2023 to 2033 Figure 76: East Asia Market Value (US$ Million) by Treatment Procedure, 2023 to 2033 Figure 77: East Asia Market Value (US$ Million) by Distribution Channel, 2023 to 2033 Figure 78: East Asia Market Value (US$ Million) by Country, 2023 to 2033 Figure 79: East Asia Market Value (US$ Million) Analysis by Country, 2018 to 2033 Figure 80: East Asia Market Value Share (%) and BPS Analysis by Country, 2023 to 2033 Figure 81: East Asia Market Y-o-Y Growth (%) Projections by Country, 2023 to 2033 Figure 82: East Asia Market Value (US$ Million) Analysis by Treatment Procedure, 2018 to 2033 Figure 83: East Asia Market Value Share (%) and BPS Analysis by Treatment Procedure, 2023 to 2033 Figure 84: East Asia Market Y-o-Y Growth (%) Projections by Treatment Procedure, 2023 to 2033 Figure 85: East Asia Market Value (US$ Million) Analysis by Distribution Channel, 2018 to 2033 Figure 86: East Asia Market Value Share (%) and BPS Analysis by Distribution Channel, 2023 to 2033 Figure 87: East Asia Market Y-o-Y Growth (%) Projections by Distribution Channel, 2023 to 2033 Figure 88: East Asia Market Attractiveness by Treatment Procedure, 2023 to 2033 Figure 89: East Asia Market Attractiveness by Distribution Channel, 2023 to 2033 Figure 90: East Asia Market Attractiveness by Country, 2023 to 2033 Figure 91: Oceania Market Value (US$ Million) by Treatment Procedure, 2023 to 2033 Figure 92: Oceania Market Value (US$ Million) by Distribution Channel, 2023 to 2033 Figure 93: Oceania Market Value (US$ Million) by Country, 2023 to 2033 Figure 94: Oceania Market Value (US$ Million) Analysis by Country, 2018 to 2033 Figure 95: Oceania Market Value Share (%) and BPS Analysis by Country, 2023 to 2033 Figure 96: Oceania Market Y-o-Y Growth (%) Projections by Country, 2023 to 2033 Figure 97: Oceania Market Value (US$ Million) Analysis by Treatment Procedure, 2018 to 2033 Figure 98: Oceania Market Value Share (%) and BPS Analysis by Treatment Procedure, 2023 to 2033 Figure 99: Oceania Market Y-o-Y Growth (%) Projections by Treatment Procedure, 2023 to 2033 Figure 100: Oceania Market Value (US$ Million) Analysis by Distribution Channel, 2018 to 2033 Figure 101: Oceania Market Value Share (%) and BPS Analysis by Distribution Channel, 2023 to 2033 Figure 102: Oceania Market Y-o-Y Growth (%) Projections by Distribution Channel, 2023 to 2033 Figure 103: Oceania Market Attractiveness by Treatment Procedure, 2023 to 2033 Figure 104: Oceania Market Attractiveness by Distribution Channel, 2023 to 2033 Figure 105: Oceania Market Attractiveness by Country, 2023 to 2033 Figure 106: MEA Market Value (US$ Million) by Treatment Procedure, 2023 to 2033 Figure 107: MEA Market Value (US$ Million) by Distribution Channel, 2023 to 2033 Figure 108: MEA Market Value (US$ Million) by Country, 2023 to 2033 Figure 109: MEA Market Value (US$ Million) Analysis by Country, 2018 to 2033 Figure 110: MEA Market Value Share (%) and BPS Analysis by Country, 2023 to 2033 Figure 111: MEA Market Y-o-Y Growth (%) Projections by Country, 2023 to 2033 Figure 112: MEA Market Value (US$ Million) Analysis by Treatment Procedure, 2018 to 2033 Figure 113: MEA Market Value Share (%) and BPS Analysis by Treatment Procedure, 2023 to 2033 Figure 114: MEA Market Y-o-Y Growth (%) Projections by Treatment Procedure, 2023 to 2033 Figure 115: MEA Market Value (US$ Million) Analysis by Distribution Channel, 2018 to 2033 Figure 116: MEA Market Value Share (%) and BPS Analysis by Distribution Channel, 2023 to 2033 Figure 117: MEA Market Y-o-Y Growth (%) Projections by Distribution Channel, 2023 to 2033 Figure 118: MEA Market Attractiveness by Treatment Procedure, 2023 to 2033 Figure 119: MEA Market Attractiveness by Distribution Channel, 2023 to 2033 Figure 120: MEA Market Attractiveness by Country, 2023 to 2033
Recommendations
Explore Healthcare Insights
View Reports