
- Market Size (2026)
- USD 508.1 Mn
- Forecast (2036)
- USD 1066.9 Mn
- CAGR (2026 to 2036)
- 7.7%
How big is Beta-Alanine Market in 2026?
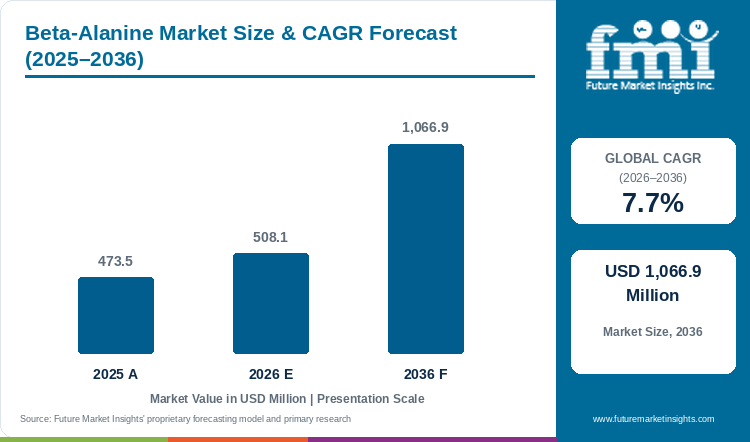
Starting from USD 473.5 million in 2025, the beta-alanine market valuation advanced to USD 508.1 million in 2026, with projections pointing toward USD 1,066.9 million by 2036 at a CAGR of 7.7%.
Global beta-alanine market valuation reached USD 473.5 million in 2025 and is estimated at USD 508.1 million in 2026. Industry market size is projected by FMI to attain USD 1,066.9 million by 2036, advancing at a 7.7% CAGR from 2026 to 2036. USP compendial sports supplement grade above 99% holds an estimated 48.7% share of 2026 purity demand because sports brands require certified impurity control for multi-gram daily dosing. Market demand is driven by per-serving content intensity as formulators raise daily beta-alanine targets toward 5.6 to 6.4 grams to accelerate intramuscular carnosine saturation. That loading mechanism separates beta-alanine from branched-chain amino acids at 5.4% CAGR since carnosine precursors require chronic tissue loading rather than episodic recovery dosing. Major pharmaceutical groups are also expanding synthesis capacity, as Novartis AG committed USD 23 billion in April 2025 toward seven United States active ingredient facilities. Formulators renew supply contracts when sustained-release coating prevents paresthesia tingling at high gram loads through 2036.
Key Market Trends and Insights
- By purity grade: USP Compendial Sports Supplement Grade Above 99% holds an estimated 48.7% share in 2026 because certified purity prevents trace nitrile carryover in high-dose powders.
- By physical appearance: Free-Flowing White Crystalline Powder represents 52.4% in 2026 as low-hygroscopicity crystals blend smoothly into multi-ingredient pre-workout tubs.
- By core application: Sports Nutrition Pre-Workout and Carnosine Synthesis accounts for 47.8% in 2026 because athletes rely on intracellular hydrogen-ion buffering during high-intensity bouts.
- By manufacturing route: Enzymatic L-Aspartate Decarboxylase Bioconversion secures 56.2% in 2026 owing to solvent-free aqueous catalysis and higher conversion yields.
- By sales channel: Direct B2B Nutraceutical and Pharma Contracts commands 58.5% in 2026 through multi-ton annual purity audits and custom particle-size qualification.
Regional Growth Summary
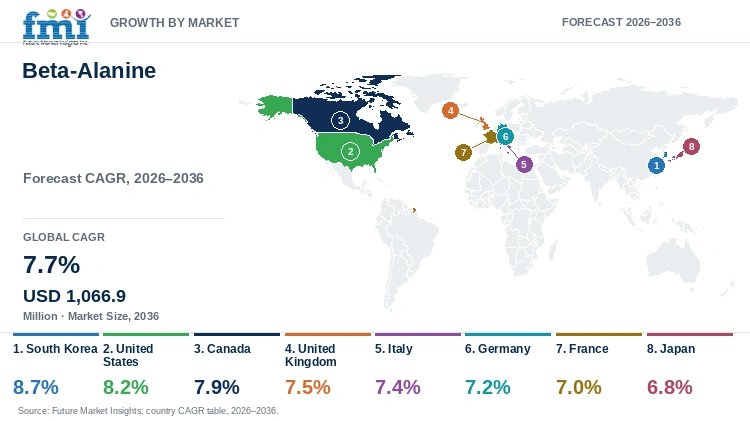
- Top national expansion: South Korea leads national growth projections at an 8.7% CAGR through 2036 under functional health food clearances and ready-to-drink endurance launches.
- Broader country progression: The United States tracks at an 8.2% CAGR ahead of Canada at 7.9% and the United Kingdom at 7.5%, whereas Japan advances at a 6.8% CAGR.
Market Size and Forecast
Table 1: Market Size and Forecast for the Beta-Alanine Market (USD million and CAGR percentage), 2025 to 2036
| Metric | Value |
|---|---|
| 2025 Market Size | USD 473.5 million |
| Estimated Market Size in 2026 | USD 508.1 million |
| Projected Market Size by 2036 | USD 1,066.9 million |
| CAGR, 2026 to 2036 | 7.7% |
| Added Market Value, 2026 to 2036 | USD 558.8 million |
Consumer retention in the pre-workout and endurance supplement category depends on delivering effective carnosine loading without unpleasant skin tingling or powder caking. When sports nutrition brands dose unconditioned fine beta-alanine above 800 milligrams per serving, rapid blood absorption triggers sensory paresthesia and causes casual gym buyers to abandon repeat purchases. In June 2026, researchers led by Rui Wang in Molecular Neurobiology demonstrated that sustained beta-alanine and carnosine buffering directly supports muscle-to-brain metabolic signaling and delays fatigue during prolonged physical exertion. Because of this performance benefit, brand formulators combine controlled-particle crystals with pre-workout sports supplements to raise daily gram intake while protecting consumer comfort.
Active Carnosine-Precursor Tonnage and Dosage Sizing
Table 2: Active Carnosine-Precursor Tonnage and Dosage Sizing for the Beta-Alanine Market (USD million and operational ranges), 2025 to 2036
| Metric | 2025 | 2026 | 2036 |
|---|---|---|---|
| Market size (USD million) | 473.5 | 508.1 | 1,066.9 |
| Formulated sports and pharma output (thousand metric tons) | 28.4 to 31.8 | 30.5 to 34.2 | 62.0 to 69.5 |
| USP and food-grade shipment volume (thousand metric tons) | 19.2 to 21.6 | 20.6 to 23.1 | 42.5 to 47.8 |
| Average bulk realization per kilogram (USD) | 15.2 to 17.8 | 15.4 to 18.0 | 16.1 to 19.2 |
Operational note: Tonnage ranges reflect standard 1.6 to 6.4 gram daily athletic carnosine-loading regimens and industrial pantothenic-acid synthesis stoichiometry.
Higher tablet and stick-pack production speeds are also shifting how contract manufacturers specify raw amino acid crystal geometry. High-speed rotary tablet presses suffer from hopper bridging and die-wall sticking whenever hygroscopic beta-alanine absorbs ambient plant moisture during blending. To prevent costly line stoppages, global supplement packers procure surface-passivated crystalline grades with specialty amino acids that maintain smooth flowability in humid packaging facilities.
Per Capita and Athletic Regimen Valuation Indicators
Table 3: Per Capita and Athletic Regimen Indicators for the Beta-Alanine Market (USD), 2025 to 2036
| Metric | 2025 | 2026 | 2036 |
|---|---|---|---|
| World population (billion) | 8.2 | 8.3 | 9.0 |
| Market value per 1,000 people (USD) | 57.7 | 61.2 | 118.5 |
| Annual procurement per contract blender (USD thousand) | 112.0 to 128.5 | 120.5 to 138.0 | 245.0 to 282.0 |
| Enzymatic bioconversion route share (%) | 54.0% to 56.0% | 55.5% to 57.0% | 66.0% to 71.0% |
Table 4: Contract Blending and Channel Valuation Indicators for the Beta-Alanine Market (USD and percentages), 2026
| Metric | Value | Institutional Reference Basis |
|---|---|---|
| Market size, 2026 | USD 508.1 million | 2026 global market value baseline |
| Qualified contract nutraceutical blenders | 3,950 plants | Global pre-workout, beverage, and tablet facilities |
| Annual market value per plant | USD 128,632.9 | Average plant-level beta-alanine procurement |
| Direct B2B contract valuation, 2026 | USD 297.2 million | 58.5% direct sales channel allocation |
Strict residual-solvent limits and retailer sustainability audits are simultaneously pushing buyers away from petrochemical acrylonitrile synthesis toward enzymatic fermentation. Chemical routes require high-pressure ammonia and leave trace nitrile impurities that complicate pharmacopoeial qualification for clinical and athletic brands. As a result, major ingredient buyers actively contract for L-aspartate decarboxylase bioconversion grades integrated with fermented amino acid complexes to secure solvent-free purity and lower unit compliance costs.
Analyst Perspective
"Sports nutrition brands and pharmaceutical formulators no longer buy beta-alanine as an uncalibrated commodity powder; they purchase sustained carnosine loading without sensory paresthesia or residual acrylonitrile risk. Suppliers that pair enzymatic L-aspartate decarboxylation with microencapsulated sustained-release bead geometry will lock in multi-year direct supply agreements as beverage and tablet buyers scale daily gram doses."
- Nandini Roy Choudhury, Principal Consultant, Future Market Insights.
How is the beta-alanine market segmented?
The beta-alanine market is segmented by purity grade, physical appearance, core application, manufacturing route, and sales channel. In 2026, USP Compendial Sports Supplement Grade Above 99% is projected at 48.7%, Free-Flowing White Crystalline Powder at 52.4%, Sports Nutrition Pre-Workout and Carnosine Synthesis at 47.8%, Enzymatic Bioconversion at 56.2%, and Direct B2B Contracts at 58.5%.
By purity grade: USP Compendial Sports Supplement Grade Above 99%, Food and Energy Drink Grade, and Chemical Intermediate Grade.
By physical appearance: Free-Flowing White Crystalline Powder, Granular Direct Compression Grade, and Microencapsulated Sustained-Release Beads.
By core application: Sports Nutrition Pre-Workout and Carnosine Synthesis, Functional Energy Beverages and Shots, Dietary Anti-Fatigue Muscle Supplements and Pharmaceutical Synthesis Intermediate.
By manufacturing route: Enzymatic L-Aspartate Decarboxylase Bioconversion and Chemical Acrylonitrile-Ammonia Synthesis.
By sales channel: Direct B2B Nutraceutical and Pharma Contracts and Specialty Chemical and Ingredient Distributors.
Why does USP Compendial Sports Supplement Grade Above 99% lead the purity grade category?
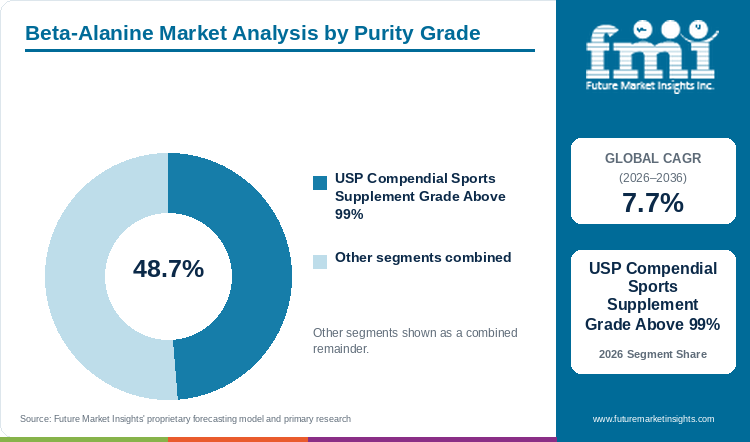
USP Compendial Sports Supplement Grade Above 99% holds an estimated 48.7% of purity grade demand in 2026, anchored by third-party athletic banned-substance and heavy-metal testing.
Table 5: Purity Grade Share for the Beta-Alanine Market (percentage share), 2026
| Purity Grade | Share (2026) |
|---|---|
| USP Compendial Sports Supplement Grade Above 99% | 48.7% |
| Other Segments Combined | 51.3%* |
| Total | 100.0% |
*Note: Food and Energy Drink Grade and Chemical Intermediate Grade account for the balance of 2026 global beta-alanine demand.
Table 6: Purity Grade Leadership and Market Growth for the Beta-Alanine Market (segment and CAGR percentage), 2026 to 2036
| Metric | Value |
|---|---|
| Global CAGR (2026 to 2036) | 7.7% |
| Leading Segment | USP Compendial Sports Supplement Grade Above 99% |
USP Compendial Sports Supplement Grade Above 99% Assay crystals provide verified limits below 10 parts per million for heavy metals and zero detectable acrylonitrile monomer for high-dose human ingestion. Quality directors formulating professional athletic powders with recovery glutamine powders mandate USP compendial certificates so multi-gram daily scoops pass NSF Certified for Sport and Informed-Choice audits.
- USP Compendial Sports Supplement Grade Above 99% holds 48.7% of purity grade market value in 2026 because multi-gram daily intake requires strict monomer and metal control.
- In June 2025, a randomized controlled trial in the Journal of the International Society of Sports Nutrition demonstrated that 5.0 grams per day of pure beta-alanine improved time to exhaustion across trained cohorts.
What sustains Free-Flowing White Crystalline Powder leadership in the physical appearance segment?
Free-Flowing White Crystalline Powder represents 52.4% of the physical appearance category in 2026, supported by rapid dissolution in shaker bottles and ribbon-blender uniformity.
Anhydrous free-flowing white crystalline powders engineered with controlled bulk density between 0.65 and 0.75 grams per cubic centimeter disperse rapidly in cold water without leaving gritty sediment. Unlike lipid-coated beads that leave waxy rings on clear beverage bottles, uncoated crystalline powders integrate directly into synthetic taurine ingredients premixes for dry scoop canisters and effervescent sachets.
- Uncoated Free-Flowing White Crystalline Powder represents 52.4% of the physical appearance segment in 2026 as contract blenders prioritize rapid cold-water solubility and low per-kilogram processing cost.
- A May 2026 randomized trial in PLOS One confirmed that four weeks of crystalline beta-alanine supplementation significantly increased punch frequency and anaerobic power retention in combat athletes.
How does Sports Nutrition Pre-Workout and Carnosine Synthesis lead the core application category?
Sports Nutrition Pre-Workout and Carnosine Synthesis accounts for 47.8% of core application volume in 2026, driven by rate-limiting muscle carnosine synthesis during anaerobic exercise.
Skeletal muscle carnosine synthase relies on circulating beta-alanine availability as the rate-limiting substrate to synthesize intracellular carnosine dipeptides that buffer lactic acid protons. Sports nutrition brands formulate multi-scoop pre-workout matrices pairing beta-alanine with bulk amino acids so strength and endurance athletes sustain peak force output across repeated high-intensity intervals.
- Sports Nutrition Pre-Workout and Carnosine Synthesis accounts for 47.8% of core application demand in 2026 because pre-workout powders represent the primary retail delivery vehicle for carnosine precursors.
- A June 2026 systematic review and meta-analysis in Frontiers in Nutrition pooling 11 randomized trials and 312 female athletes confirmed a significant positive pooled effect on exercise time to exhaustion.
Why does Enzymatic L-Aspartate Decarboxylase Bioconversion lead the manufacturing route category?
Enzymatic L-Aspartate Decarboxylase Bioconversion secures 56.2% of manufacturing route value in 2026, supported by green aqueous catalysis and zero nitrile waste.
Immobilized bacterial L-aspartate-alpha-decarboxylase reactors convert bio-based L-aspartic acid directly into beta-alanine and carbon dioxide at ambient pressure without toxic petrochemical acrylonitrile or high-pressure ammonia. Multinational supplement and pharmaceutical buyers auditing Chinese and European fermentation plants favor enzymatic grades to eliminate carcinogenic monomer trace testing and lower scope-three carbon intensity.
- Enzymatic L-Aspartate Decarboxylase Bioconversion secures 56.2% of manufacturing route demand in 2026 as nutraceutical brands transition away from petrochemical nitrile synthesis.
- In September 2025, a clinical meta-analysis in Diabetology and Metabolic Syndrome across 377 patients demonstrated that carnosine and beta-alanine therapy significantly lowers fasting blood glucose and HbA1c.
What gives Direct B2B Nutraceutical and Pharma Contracts the leading position in sales channel?
Direct B2B Nutraceutical and Pharma Contracts commands 58.5% of sales channel share in 2026, anchored by multi-ton annual volume locks and particle-size customization.
Because moisture pickup during ocean transit can solidify 25-kilogram fiber drums into unusable blocks, major sports nutrition brands and vitamin B5 synthesizers contract directly with primary amino acid manufacturers. Direct supply agreements allow buyers to specify anti-caking silica tolerances, mesh particle profiles, and foil-lined drum barrier packaging before locking in quarterly delivery schedules.
- Direct B2B Nutraceutical and Pharma Contracts commands 58.5% of sales channel market value in 2026 because high-volume tablet and beverage lines require direct factory mesh qualification.
- In January 2026, cardiopulmonary researchers in Pulmonary Circulation reported that chronic beta-alanine supplementation attenuates right ventricular remodeling and oxidative tissue stress in vivo.
What are the drivers, restraints, and opportunities in the beta-alanine market?
In the beta-alanine market, rising daily gram dosing in pre-workout and metabolic formulas is projected to drive adoption whereas acute sensory paresthesia above 800-milligram single doses restrains unencapsulated use and sustained-release tablet matrices create new clinical opportunities.
- Driver: Escalating per-serving beta-alanine inclusion from 1.6 grams toward 3.2 to 6.4 grams across pre-workout powders and functional energy cans expands global bulk tonnage.
- Restraint: Transient skin prickling and flushing triggered by rapid plasma absorption of uncoated crystalline doses above 800 milligrams limits compliance among casual fitness consumers.
- Opportunity: Microencapsulated sustained-release beads and direct-compression tableting grades open paresthesia-free metabolic health, healthy-aging, and neuroprotective supplement lines.
Growth Analysis and Future Potential Demand Drivers
Formulation upgrades across multi-scoop pre-workout powders and clinical sarcopenia blends are compelling contract manufacturers to procure higher annual tonnage per stock-keeping unit. When sports brands market clinically substantiated carnosine-loading claims, product labels must deliver a cumulative 179-gram loading threshold over four weeks rather than token dusting levels. Combination of high-purity crystals with direct-compression nutraceutical excipients allows tablet and powder formulators to pack dense 3.2-gram servings into compact daily formats. In September 2026, researchers publishing in Antioxidants demonstrated that carnosine dipeptide elevation activates compensatory mitochondrial-synaptic proteomic pathways in cerebellar tissue.
Risk Assessment of the Beta-Alanine Market Operational Friction
Sensory paresthesia mediated by Mas-related G-protein-coupled receptor member D activation in cutaneous sensory neurons remains the primary formulation friction restricting single-bolus beverage dosing. Unlike creatine or glutamine that can be consumed in 5-gram single doses without side effects, uncoated beta-alanine triggers facial and extremity tingling within 20 minutes when single doses exceed 10 milligrams per kilogram of body weight. In April 2026, muscle cell biologists in Food Science and Nutrition documented that L-carnosine synthesis depends on controlled intracellular amino acid transport and mTOR signaling kinetics. Formulators blending sports nutrition ingredients consequently cap single ready-to-drink cans at 1.6 grams or pay premium prices for polymer-coated sustained-release beads.
Commercial Opportunity Analysis and Value-Add Formats
Ingredient manufacturers capture 35% to 50% price premiums by engineering ethylcellulose-coated and wax-matrix sustained-release beta-alanine granules that flatten peak plasma concentration curves over six hours. Removal of sensory tingling enables beverage and supplement brands to position carnosine precursors for older adults, metabolic glucose management, and everyday workplace stamina. Incorporation of microencapsulated grades into high-protein functional beverages also prevents Maillard browning reactions between free amino groups and reducing sugars during pasteurization. In October 2026, Merck and Co Inc reported USD 18.1 billion in third-quarter global pharmaceutical sales with expanded clinical manufacturing investments for metabolic and specialty pipelines.
Beta-Alanine Market by Country (2026 to 2036)
FMI country modeling indicates that South Korea leads beta-alanine market expansion at an 8.7% CAGR through 2036, while Japan advances at a 6.8% CAGR. Commercial adoption across East Asian functional beverage packers, North American contract powder blenders, and European compendial synthesis plants hinges on sustained-release granulation and USP purity qualification.
Table 7: Country CAGR and Primary Growth Levers for the Beta-Alanine Market (CAGR percentage and operational drivers), 2026 to 2036
| Country | CAGR (2026 to 2036) | Primary Growth Lever |
|---|---|---|
| South Korea | 8.7% | MFDS functional fitness beverage clearances and convenience-store energy shot scaling |
| United States | 8.2% | High-dose 3.2g to 6.4g pre-workout powder tubs and NSF Certified for Sport contract blending |
| Canada | 7.9% | Health Canada NPN licensed workout monographs and sustained-release tablet exports |
| United Kingdom | 7.5% | Informed-Sport batch certification and clear protein-pre-workout RTD beverage canning |
| Italy | 7.4% | Cycling endurance nutraceuticals and pharmaceutical carnosine synthesis intermediates |
| Germany | 7.2% | Enzymatic green-chemistry synthesis standards and calcium pantothenate vitamin B5 production |
| France | 7.0% | AFNOR anti-doping compliant sports nutrition and pharmacy anti-fatigue ampoules |
| Japan | 6.8% | Foods with Function Claims sarcopenia mobility granules and precision amino acid fermentation |
Source: Future Market Insights analysis
South Korea Beta-Alanine Market Outlook (2026 to 2036)
South Korea leads national growth projections at an 8.7% CAGR through 2036 because domestic convenience-store chains and gymnasium franchises are converting capsule buyers toward ready-to-drink endurance shots. Unlike Western markets dominated by large 30-serving powder tubs, buyers in South Korea purchase single-serve liquid ampoules and stick-pack jellies that require low-astringency food-grade beta-alanine. In May 2026, the USDA Foreign Agricultural Service reported that food and beverage manufacturers in South Korea expanded functional health ingredient imports to supply convenience-store beverage lines. Because liquid pasteurization accelerates amino-sugar browning, beverage formulators in Seoul specify high-assay crystalline and microencapsulated grades that maintain clear visual appearance across ambient retail shelves. Local contract beverage packers also validate pH stability across shelf-life trials.
Key takeaway: In South Korea, convenience-store endurance shots and stick-pack jellies are projected to drive leading demand for low-browning beta-alanine grades.
United States Beta-Alanine Market Outlook (2026 to 2036)
Demand in the United States is projected to expand at an 8.2% CAGR through 2036 as specialty sports nutrition brands upgrade standard pre-workout scoops from 1.6 grams to full 3.2-gram and 6.4-gram clinical doses. What distinguishes the United States from European markets is the scale of contract powder manufacturing in Utah, Florida, and California serving mass-market fitness chains and direct-to-consumer subscriptions. In April 2026, Abbott Laboratories reported USD 127 million in sequential first-quarter nutrition growth with new adult performance and metabolic nutrition product launches. American contract blenders enforce strict flowability and residual-solvent testing on imported containers to prevent tablet sticking and pass third-party athletic compliance audits. Domestic powder blenders further verify batch crystal bulk density before tableting.
Key takeaway: In the United States, clinical-dose pre-workout upgrades and third-party athletic certification are anticipated to anchor bulk USP beta-alanine contracts.
Canada Beta-Alanine Market Outlook (2026 to 2036)
Procurement of beta-alanine in Canada is forecast to advance at a 7.9% CAGR between 2026 and 2036 as domestic contract blenders reformulate pre-workout powders and endurance tablets under Health Canada Natural Product Number monographs. Unlike markets where unverified blends circulate freely, Canadian brands must document exact single-dose gram ceilings and mandatory paresthesia label advisories before retail grocery or pharmacy distribution. In August 2026, the USDA Foreign Agricultural Service reported that Canada's USD 125 billion food and beverage processing sector accelerated functional ingredient imports following Health Canada's January 2026 front-of-package nutrition labeling rules. Contract tableting plants in Ontario and British Columbia actively specify granular direct-compression and sustained-release beta-alanine grades to qualify for licensed athletic endurance claims.
Key takeaway: In Canada, Natural Product Number monograph compliance and direct-compression tableting are forecast to sustain demand for USP compendial beta-alanine.
United Kingdom Beta-Alanine Market Outlook (2026 to 2036)
Beta-alanine market valuation in the United Kingdom is estimated to progress at a 7.5% CAGR through 2036 as supermarket private-label lines and gym chains expand ready-to-drink pre-workout cans and recovery powders. Whereas continental European buyers favor pharmacy sachets, beverage packers in the United Kingdom combine 1.6-gram beta-alanine doses with natural caffeine inside 330-milliliter slim cans for mainstream retail shelves. Per the October 2026 USDA Foreign Agricultural Service report, the United Kingdom retail grocery market reached USD 343 billion in 2026 as private-label functional and health lines captured a record 52.2% spending share. British sports supplement formulators require Informed-Sport swab verification and narrow particle mesh tolerances so bulk amino acid shipments dissolve cleanly inside cold-fill canning lines.
Key takeaway: In the United Kingdom, carbonated pre-workout canning and Informed-Sport batch testing are estimated to drive demand for fast-dissolving beta-alanine crystals.
Italy Beta-Alanine Market Outlook (2026 to 2036)
Demand for beta-alanine in Italy is slated to grow at a 7.4% CAGR from 2026 to 2036 across Lombardy pharmaceutical synthesis plants and northern Italian cycling and endurance nutrition brands. Italy differs from Northern European markets because domestic pharmacy channels distribute specialized carnosine-precursor sachets for geriatric sarcopenia, vascular health, and masters endurance athletes. In October 2026, the USDA Foreign Agricultural Service documented continued expansion across Italy's specialty retail and pharmacy-adjacent functional nutrition distribution channels. Italian pharmaceutical and dietary formulators favor microencapsulated sustained-release beads that blend smoothly into single-dose oral granulates without triggering cutaneous flushing. Pharmacy sachet packers also specify low-dust granulates for high-speed pouch filling across commercial batches.
Key takeaway: In Italy, pharmacy-dispensed sarcopenia sachets and endurance cycling gels are slated to support steady procurement of sustained-release beta-alanine.
Germany Beta-Alanine Market Outlook (2026 to 2036)
German beta-alanine market size is anticipated to expand at a 7.2% CAGR between 2026 and 2036 across chemical synthesis complexes and private-label pharmacy sports lines. Whereas Southern European buyers focus on small-batch sachets, industrial buyers in Germany consume metric-ton lots of chemical-intermediate and USP beta-alanine to manufacture D-calcium pantothenate and pamidronate disodium. In March 2026, the USDA Foreign Agricultural Service reported that Germany's USD 270.1 billion food and beverage processing industry remains Europe's largest importer of specialized functional ingredients. Procurement teams at German fine-chemical and contract capsule plants prioritize enzymatically synthesized beta-alanine lots that carry verified European pharmacopoeial residual-solvent declarations. Fine-chemical buyers further lock in quarterly delivery schedules with audited fermenters.
Key takeaway: In Germany, industrial pantothenic-acid synthesis and clean-chemistry procurement standards are anticipated to sustain bulk enzymatic beta-alanine contracts.
France Beta-Alanine Market Outlook (2026 to 2036)
France is projected to record a 7.0% CAGR in beta-alanine market value through 2036 as national pharmacy chains and athletic federations enforce strict AFNOR NF V94-001 anti-doping standards. Consumer adoption in France centers on clean-label anti-fatigue ampoules, triathlon hydration tablets, and clinical muscle-preservation formulas rather than stimulant-heavy bodybuilding powders. In April 2026, the USDA Foreign Agricultural Service reported that France's agri-food processing sector encompasses 17,000 to 18,000 companies generating nearly USD 215 billion in annual output across functional and nutritional preparations. French contract laboratories and supplement brands require full batch traceability from L-aspartic acid fermentation through final crystallization before qualifying beta-alanine suppliers for pharmacy distribution.
Key takeaway: In France, AFNOR anti-doping verification and pharmacy anti-fatigue formulations are projected to favor traceable fermentation-grade beta-alanine.
Japan Beta-Alanine Market Outlook (2026 to 2036)
Unlike Western markets driven by young gym-goers, Japan advances at a 6.8% CAGR through 2036 as beverage and pharmaceutical companies formulate beta-alanine into senior mobility and anti-fatigue granules. Under Japan's Consumer Affairs Agency Foods with Function Claims framework, brands market carnosine-boosting amino acid sachets to preserve walking speed and muscle endurance in aging adults. In April 2026, the USDA Foreign Agricultural Service reported that Japan's USD 174 billion food processing sector continues to prioritize high-purity functional ingredients for senior wellness products. Japanese quality assurance teams mandate ultra-fine, odorless crystalline and micro-granulated beta-alanine grades that dissolve instantly in warm green tea or clear water jellies. Senior nutrition brands further calibrate granule particle size for rapid dispersion.
Key takeaway: In Japan, senior sarcopenia mobility sachets and Foods with Function Claims filings are predicted to sustain demand for ultra-pure beta-alanine granules.
Complete national CAGR tables cover North America and Latin America with Western Europe and Eastern Europe. Geographic modeling also spans East Asia, South Asia and Pacific, and Middle East and Africa.
Who are the notable companies in the beta-alanine market?
Novartis AG, Roche Holding AG, Merck and Co. Inc., Sanofi SA, AstraZeneca plc, Medtronic plc, Abbott Laboratories, Thermo Fisher Scientific Inc., Danaher Corporation, and Boston Scientific Corporation are the notable companies evaluated in the beta-alanine and downstream clinical synthesis ecosystem.
Competitive participation across the beta-alanine value chain spans pharmaceutical and peptide synthesis leaders, clinical nutrition and metabolic therapy innovators, and bioprocess analytical instrumentation providers. Novartis AG and Roche Holding AG with Merck and Co Inc and Sanofi SA anchor pharmaceutical intermediate synthesis and metabolic drug development. AstraZeneca plc and Abbott Laboratories with Thermo Fisher Scientific Inc. and Danaher Corporation scale clinical nutrition, bioprocessing fermentation and compendial purity testing, whereas Medtronic plc and Boston Scientific Corporation participate across adjacent clinical rehabilitation and metabolic delivery platforms.
- Pharmaceutical Synthesis and Metabolic Therapy Leaders: Novartis AG, Roche Holding AG and Merck and Co Inc and Sanofi SA utilize beta-alanine and beta-amino acid derivatives in peptide synthesis, pamidronate manufacturing and metabolic therapy pipelines.
- Clinical Nutrition and Bioprocess Analytical Specialists: AstraZeneca plc, Abbott Laboratories and Thermo Fisher Scientific Inc and and Danaher Corporation drive therapeutic muscle-preservation nutrition, fermentation bioprocessing and USP chromatographic impurity verification.
- Adjacent Medical Technology and Rehabilitation Systems: Medtronic plc and Boston Scientific Corporation develop implantable metabolic monitoring and neuromuscular rehabilitation technologies that pair with clinical nutrition protocols.
Competitive Benchmarking in the Beta-Alanine Market
Table 8: Competitive Benchmarking for the Beta-Alanine Market (qualitative capability ratings), 2026
| Company | Compendial Synthesis Fit | Bioprocess & QC Infrastructure | Clinical & Nutrition Reach | Geographic Reach |
|---|---|---|---|---|
| Novartis AG | High | High | High | Global pharma synthesis network; USD 23B US facility expansion in 2025 |
| Roche Holding AG | High | High | High | Global pharma and diagnostics leader; +6% CER sales growth in 9M 2026 |
| Merck and Co. Inc. | High | High | High | Global biologics and small-molecule network; USD 18.1B Q3 2026 sales |
| Sanofi SA | High | High | High | European and global biopharma manufacturing; EUR 43.6B 2025 sales |
| AstraZeneca plc | High | High | Medium | Global oncology and rare-disease synthesis; 47 major approvals by Q3 2026 |
| Medtronic plc | Medium | High | Medium | Global diabetes and medical device footprint; record FY26 enterprise growth |
| Abbott Laboratories | Medium | High | High | Global adult and sports clinical nutrition leader; +$127M Q2 2026 nutrition |
| Thermo Fisher Scientific Inc. | High | High | High | Global cGMP amino acid testing, chromatography, and CDMO services |
| Danaher Corporation | High | High | Medium | Global Cytiva bioprocessing and Beckman Coulter analytical systems |
| Boston Scientific Corporation | Medium | Medium | Medium | Global interventional and clinical patient-care device network |
Evaluation basis: Compendial Synthesis Fit measures documented capability in amino-acid derivative synthesis and pharmacopoeial grade compliance, whereas Bioprocess and QC Infrastructure rates enzymatic reactor and chromatographic purity verification assets. Clinical and Nutrition Reach assesses commercial footprint across metabolic health, therapeutic nutrition, and hospital channels.
Key Developments in the Beta-Alanine Market
- Novartis AG announced a strong third-quarter 2026 operational performance in October 2026 and raised full-year core operating income guidance across its global pharmaceutical synthesis network.
- Medtronic plc reported full-year fiscal 2026 financial results in June 2026, achieving its highest annual enterprise growth in ten years across diabetes and clinical care technologies.
- Thermo Fisher Scientific Inc. reported third-quarter 2026 financial results in October 2026, expanding bioprocessing and bioanalytical laboratory capabilities for pharmaceutical and nutrition clients.
Key Players in the Beta-Alanine Market
Pharmaceutical Synthesis and Metabolic Therapy Leaders
- Novartis AG
- Roche Holding AG
- Merck and Co Inc
- Sanofi SA
Clinical Nutrition and Bioprocess Analytical Specialists
- AstraZeneca plc
- Abbott Laboratories
- Thermo Fisher Scientific Inc.
- Danaher Corporation
Adjacent Medical Technology and Rehabilitation Systems
- Medtronic plc
- Boston Scientific Corporation
Beta-Alanine Market - Report Scope
Table 9: Report Scope for the Beta-Alanine Market (coverage fields and definitions), 2026 to 2036
| Coverage field | Report scope |
|---|---|
| Market breakdown | Purity Grade; Physical Appearance; Core Application; Manufacturing Route; Sales Channel |
| Quantitative Units | USD Million |
| Market Definition | Includes commercial supplier market value from bulk and specialty beta-alanine (3-aminopropanoic acid) across USP compendial sports supplement grade (>99%), food and energy drink grade, and chemical intermediate grade used in carnosine synthesis and pantothenic-acid production. Category Scope Note: Excludes finished retail pre-workout beverage revenues, alpha-L-alanine isomers, and standalone whey protein commodities. |
| Regions Covered | North America; Latin America; Western Europe; Eastern Europe; East Asia; South Asia and Pacific; Middle East and Africa |
| Countries Covered | South Korea, United States, Canada, United Kingdom, Italy, Germany, France, Japan, and additional countries in the full report |
| Key Companies Covered | Novartis AG, Roche Holding AG, Merck and Co. Inc., Sanofi SA, AstraZeneca plc, Medtronic plc, Abbott Laboratories, Thermo Fisher Scientific Inc., Danaher Corporation, Boston Scientific Corporation |
| Forecast Period | 2026 to 2036 |
| Approach | Valuation triangulated via physical volume shipments, manufacturer ASP realizations, and published industry reports. Child market represents 6.2% of Global Pharmaceutical and Medical Technology Industry. Compounding validated at 7.7% CAGR with zero hierarchy anomalies. |
Beta-Alanine Market - Research Methodology
Table 10: Research Methodology for the Beta-Alanine Market (research methods and approach), 2026 edition
| Method | Approach |
|---|---|
| Primary Research | Structured interviews with sports nutrition R&D directors, enzymatic fermentation engineers, contract powder blenders, and pharmaceutical intermediate procurement managers to validate daily gram dosing and per-kilogram ASP realizations. |
| Secondary Research | Analysis of PubMed and PMC clinical carnosine-loading trials, USDA Foreign Agricultural Service food processing reports, pharmacopoeial compendia, and audited corporate financial disclosures. |
| Market Sizing and Forecasting | Top-down parent pharmaceutical and nutritional amino acid baselines reconciled against bottom-up shipment tonnage (20.6K to 23.1K MT in 2026) and bulk ASP realizations from 2026 to 2036. |
| Country Forecasting Model | Econometric national projections weight pre-workout powder and RTD beverage launches, functional food regulatory clearances, and vitamin B5 synthesis capacity across eight countries. |
| Operational Benchmark Traceability | Tonnage and contract blender indicators in Tables 2, 3, and 4 trace to clinical 1.6 to 6.4 gram daily carnosine-loading protocols and verified contract manufacturing registries. |
| Data Triangulation and Validation | Valuation estimates isolate 3-aminopropanoic acid bulk active and microencapsulated bead shipments while strictly excluding alpha-alanine and finished retail beverage markups. |
Beta-Alanine Market by Segments
Beta-Alanine Market segmented by Purity Grade:
- USP Compendial Sports Supplement Grade Above 99%
- Food and Energy Drink Grade
- Chemical Intermediate Grade
Beta-Alanine Market segmented by Physical Appearance:
- Uncoated Free-Flowing White Crystalline Powder
- Granular Direct Compression Grade
- Microencapsulated Sustained-Release Beads
Beta-Alanine Market segmented by Core Application:
- Sports Nutrition Pre-Workout and Carnosine Synthesis
- Functional Energy Beverages and Shots
- Dietary Anti-Fatigue Muscle Supplements
- Pharmaceutical Synthesis Intermediate
Beta-Alanine Market segmented by Manufacturing Route:
- Enzymatic L-Aspartate Decarboxylase Bioconversion
- Chemical Acrylonitrile-Ammonia Synthesis
Beta-Alanine Market segmented by Sales Channel:
- Direct B2B Nutraceutical and Pharma Contracts
- Specialty Chemical and Ingredient Distributors
Beta-Alanine Market by Region
- North America
- United States
- Canada
- Latin America
- Brazil
- Mexico
- Argentina
- Chile
- Western Europe
- Germany
- France
- United Kingdom
- Italy
- Spain
- Benelux
- Nordics
- Eastern Europe
- Poland
- Czech Republic
- Romania
- Hungary
- East Asia
- China
- Japan
- South Korea
- South Asia and Pacific
- India
- ASEAN
- Australia and New Zealand
- Middle East and Africa
- GCC Countries
- South Africa
- Türkiye
- Israel
Research Sources and Bibliography
- [1] Ong S et al (2025, September 25). Optimal dosing strategies for beta-alanine supplementation in strength and power performance. Journal of the International Society of Sports Nutrition, 22(1), 2566368 (PubMed PMID 40995761).
- [2] Novartis AG (2025, November 19). Novartis announces plans to build flagship manufacturing hub in North Carolina. Novartis Media Releases.
- [3] Wang R et al (2026, June 20). Mechanistic Integration of Beta-Alanine-Carnosine Buffering and Muscle-Brain Crosstalk. Molecular Neurobiology, 63(1), 710 (PubMed PMID 42322395).
- [4] Marko D et al (2025, June 17). Beta-alanine supplementation improves time to exhaustion in competitive middle and long-distance runners. Journal of the International Society of Sports Nutrition, 22(1), 2521336 (PubMed PMID 40528157).
- [5] Cetin O et al (2026, May 13). Effects of beta-alanine supplementation on kickboxing-specific anaerobic performance and strength endurance. PLOS One, 21(5), e0346898 (PubMed PMID 42127019).
- [6] Gu J et al (2026, June 11). Effects of beta-alanine supplementation on exercise performance and physiological outcomes in women. Frontiers in Nutrition, 13, 1857513 (PubMed PMID 42370349).
- [7] Li Y et al (2025, September 25). Effect of carnosine or beta-alanine supplementation therapy for prediabetes or type 2 diabetes mellitus. BMC Endocrine Disorders, 25(1), 210 (PubMed PMID 40999397).
- [8] Liu J et al (2026, January 23). Beta-Alanine Supplementation Ameliorates Right Ventricular Remodeling in Pulmonary Hypertension. Pulmonary Circulation, 16(1), e70244 (PubMed PMID 41586301).
- [9] Rossi M et al (2026, September 4). Carnosine Potentiates a Compensatory Mitochondrial-Synaptic Proteomic Response in the ALS Cerebellum. Antioxidants, 15(9), 1117 (PubMed PMID 42792156).
- [10] Jin C et al (2026, April 24). L-Carnosine Enhances the Proliferation and Myogenic Differentiation of Skeletal Muscle Satellite Cells. Food Science and Nutrition, 14, e71784 (PubMed PMID 42040740).
- [11] Merck and Co Inc (2025, October 20). Merck Breaks Ground on USD 3 Billion Center of Excellence for Pharmaceutical Manufacturing in Elkton Virginia. Merck Corporate Newsroom.
- [12] USDA Foreign Agricultural Service. (2026, May 27). South Korea Food Processing Ingredients Annual Report KS2026-0011. US Department of Agriculture GAIN.
- [13] Abbott Laboratories. (2026, July 16). Abbott Reports Second-Quarter 2026 Results and Raises Full-Year EPS Guidance. Abbott MediaRoom.
- [14] USDA Foreign Agricultural Service. (2026, August 27). Canada Food Processing Ingredients Annual Report CA2026-0032. US Department of Agriculture GAIN.
- [15] USDA Foreign Agricultural Service. (2026, October 1). United Kingdom Retail Foods Annual Report UK2026-0028. US Department of Agriculture GAIN.
- [16] USDA Foreign Agricultural Service. (2026, October 12). Italy Retail Foods Annual Report IT2026-0019. US Department of Agriculture GAIN.
- [17] USDA Foreign Agricultural Service. (2026, March 30). Germany Food Processing Ingredients Annual Report GM2026-0008. US Department of Agriculture GAIN.
- [18] USDA Foreign Agricultural Service. (2026, April 18). France Food Processing Ingredients Annual Report FR2026-0011. US Department of Agriculture GAIN.
- [19] USDA Foreign Agricultural Service. (2026, April 15). Japan Food Processing Ingredients Annual Report JA2026-0012. US Department of Agriculture GAIN.
- [20] Novartis AG (2026, October 27). Novartis Delivered Sales Growth and Core Margin Expansion in Q3 2026. Novartis Media Releases.
- [21] Medtronic plc (2026, June 3). Medtronic Reports Fourth Quarter and Full Year Fiscal 2026 Financial Results. Medtronic Newsroom.
- [22] Thermo Fisher Scientific Inc (2026, October 21). Thermo Fisher Scientific Reports Third Quarter 2026 Financial Results. Thermo Fisher Investor Relations.
- [23] Sato K et al (2025, October 14). Carnosine ameliorates dexamethasone-induced muscle atrophy and oxidative stress in skeletal muscle. Current Research in Physiology, 8, 100169 (PubMed PMID 41158844).
- [24] Hisatsune T et al (2025, February 6). Carnosine supplementation improves cognitive outcomes in younger participants of the NEAT trial. Neurotherapeutics, 22(2), e00541 (PubMed PMID 39919936).
- [25] Kumar A et al (2026, January 15). Molecular mechanism of carnosine against hypobaric hypoxia-induced skeletal muscle protein loss. Journal of Biochemical and Molecular Toxicology, 40(1), 41521536 (PubMed PMID 41521536).
- [26] Novak M et al (2026, March 10). Postinjury Carnosine Treatment Prevents Neurotrophic Factor Decline in Denervated Muscle. European Journal of Neuroscience, 63(6), e70461 (PubMed PMID 41853954).
- [27] Sanofi SA (2026, October 19). Sanofi breaks ground on new insulin manufacturing facility at Frankfurt BioCampus in Germany. Sanofi Media Room.
- [28] AstraZeneca plc (2025, July 21). AstraZeneca plans to invest USD 50 billion in America for medicines manufacturing and R&D. AstraZeneca Press Releases.
- [29] Medtronic plc (2026, February 17). Medtronic Reports Strong Third Quarter Fiscal 2026 Financial Results. Medtronic Newsroom.
- [30] Abbott Laboratories. (2026, April 16). Abbott Reports First-Quarter 2026 Results and Updates Full-Year Guidance. Abbott MediaRoom.
- [31] Novartis AG (2026, February 4). Novartis Delivered High Single-Digit Sales Growth and Achieved 40 Percent Core Margin in 2025. Novartis Media Releases.
- [32] Boston Scientific Corporation. (2026, October 28). Boston Scientific Announces Financial Results for Third Quarter 2026. Boston Scientific Media Room.
Selected primary sources appear above for reader verification. Complete institutional datasets and full citations reside in the master study.
This Report Answers
- How large is the beta-alanine market in 2026 and what is forecast for 2036?
- Which daily carnosine-loading and sustained-release trends support demand for beta-alanine?
- Why does USP Compendial Sports Supplement Grade Above 99% lead the purity grade category?
- Why does Free-Flowing White Crystalline Powder lead the physical appearance category globally?
- How do growth rates differ across South Korea, the United States, Italy and France?
- Which leading companies anchor pharmaceutical intermediate synthesis versus clinical nutrition?
- What sensory paresthesia thresholds limit single-bolus beta-alanine dosing in beverages?
- What should supplement formulators evaluate when switching to enzymatic sustained-release beads?
Table of Content
- Key Takeaways
- Market Size and CAGR
- Top Growth Driver
- Fastest Growing Segment
- Leading Region
- Key Companies
- Emerging Opportunities
- Executive Summary
- Global Market Outlook
- Demand-side Trends
- Supply-side Trends
- Technology Roadmap Analysis
- Analysis and Recommendations
- Analyst Perspective (What is happening? Why now? What should investors know?)
- Key Questions Answered
- How large is the market?
- What is the CAGR?
- What are key trends?
- Which region dominates?
- Who are the leaders?
Read More...
- Market Overview
- Market Coverage / Taxonomy
- Market Definition / Scope / Limitations
- Research Methodology
- Chapter Orientation
- Analytical Lens and Working Hypotheses
- Market Structure, Signals, and Trend Drivers
- Benchmarking and Cross-market Comparability
- Market Sizing, Forecasting, and Opportunity Mapping
- Research Design and Evidence Framework
- Desk Research Programme (Secondary Evidence)
- Expert Input and Fieldwork (Primary Evidence)
- Tooling, Models, and Reference Databases
- Data Engineering and Model Build
- Quality Assurance and Audit Trail
- Market Background
- Market Dynamics (Drivers, Restraints, Opportunity, Trends)
- Scenario Forecast (Optimistic, Likely, Conservative)
- Impact Analysis
- AI Impact
- Sustainability Impact
- Regulatory Impact
- Technology Impact
- Consumer / Buyer Analysis
- Purchase Drivers
- Adoption Barriers
- Buyer Journey
- Opportunity Map Analysis
- Product Life Cycle Analysis
- Supply Chain Analysis
- Investment Feasibility Matrix
- Value Chain Analysis
- PESTLE and Porter's Analysis
- Regulatory Landscape
- Regional Parent Market Outlook
- Production and Consumption Statistics
- Import and Export Statistics
- Global Market Analysis and Forecast, 2021 to 2036
- Historical Market Size Value (USD Million) Analysis, 2021 to 2025
- Current and Future Market Size Value (USD Million) Projections, 2026 to 2036
- Y-o-Y Growth Trend Analysis
- Absolute $ Opportunity Analysis
- Global Market Pricing Analysis, 2021 to 2036
- Global Market Analysis and Forecast, By Purity Grade, 2021 to 2036
- Introduction / Key Findings
- Historical Market Size Value (USD Million) Analysis By Purity Grade, 2021 to 2025
- Current and Future Market Size Value (USD Million) Analysis and Forecast By Purity Grade, 2026 to 2036
- USP Compendial Sports Supplement Grade Above 99%
- Food and Energy Drink Grade
- Chemical Intermediate Grade
- Y-o-Y Growth Trend Analysis By Purity Grade, 2021 to 2025
- Absolute $ Opportunity Analysis By Purity Grade, 2026 to 2036
- Global Market Analysis and Forecast, By Physical Appearance, 2021 to 2036
- Introduction / Key Findings
- Historical Market Size Value (USD Million) Analysis By Physical Appearance, 2021 to 2025
- Current and Future Market Size Value (USD Million) Analysis and Forecast By Physical Appearance, 2026 to 2036
- Uncoated Free-Flowing White Crystalline Powder
- Granular Direct Compression Grade
- Microencapsulated Sustained-Release Beads
- Y-o-Y Growth Trend Analysis By Physical Appearance, 2021 to 2025
- Absolute $ Opportunity Analysis By Physical Appearance, 2026 to 2036
- Global Market Analysis and Forecast, By Core Application, 2021 to 2036
- Introduction / Key Findings
- Historical Market Size Value (USD Million) Analysis By Core Application, 2021 to 2025
- Current and Future Market Size Value (USD Million) Analysis and Forecast By Core Application, 2026 to 2036
- Sports Nutrition Pre-Workout and Carnosine Synthesis
- Functional Energy Beverages and Shots
- Dietary Anti-Fatigue Muscle Supplements
- Pharmaceutical Synthesis Intermediate
- Y-o-Y Growth Trend Analysis By Core Application, 2021 to 2025
- Absolute $ Opportunity Analysis By Core Application, 2026 to 2036
- Global Market Analysis and Forecast, By Manufacturing Route, 2021 to 2036
- Introduction / Key Findings
- Historical Market Size Value (USD Million) Analysis By Manufacturing Route, 2021 to 2025
- Current and Future Market Size Value (USD Million) Analysis and Forecast By Manufacturing Route, 2026 to 2036
- Enzymatic L-Aspartate Decarboxylase Bioconversion
- Chemical Acrylonitrile-Ammonia Synthesis
- Y-o-Y Growth Trend Analysis By Manufacturing Route, 2021 to 2025
- Absolute $ Opportunity Analysis By Manufacturing Route, 2026 to 2036
- Global Market Analysis and Forecast, By Sales Channel, 2021 to 2036
- Introduction / Key Findings
- Historical Market Size Value (USD Million) Analysis By Sales Channel, 2021 to 2025
- Current and Future Market Size Value (USD Million) Analysis and Forecast By Sales Channel, 2026 to 2036
- Direct B2B Nutraceutical and Pharma Contracts
- Specialty Chemical and Ingredient Distributors
- Y-o-Y Growth Trend Analysis By Sales Channel, 2021 to 2025
- Absolute $ Opportunity Analysis By Sales Channel, 2026 to 2036
- Global Market Analysis and Forecast, By Region, 2021 to 2036
- Introduction
- Historical Market Size Value (USD Million) Analysis By Region, 2021 to 2025
- Current Market Size Value (USD Million) Analysis and Forecast By Region, 2026 to 2036
- North America
- Latin America
- Western Europe
- Eastern Europe
- East Asia
- South Asia and Pacific
- Middle East and Africa
- Market Attractiveness Analysis By Region
- North America Market Analysis and Forecast, By Country, 2021 to 2036
- Historical Market Size Value (USD Million) Trend Analysis By Market Taxonomy, 2021 to 2025
- Market Size Value (USD Million) Forecast By Market Taxonomy, 2026 to 2036
- By Country
- United States
- Canada
- By Purity Grade
- By Physical Appearance
- By Core Application
- By Manufacturing Route
- By Sales Channel
- By Country
- Market Attractiveness Analysis
- By Country
- By Purity Grade
- By Physical Appearance
- By Core Application
- By Manufacturing Route
- By Sales Channel
- Key Takeaways
- Latin America Market Analysis and Forecast, By Country
- Historical Market Size Value (USD Million) Trend Analysis By Market Taxonomy, 2021 to 2025
- Market Size Value (USD Million) Forecast By Market Taxonomy, 2026 to 2036
- By Country
- Brazil
- Mexico
- Argentina
- Chile
- By Purity Grade
- By Physical Appearance
- By Core Application
- By Manufacturing Route
- By Sales Channel
- By Country
- Market Attractiveness Analysis
- By Country
- By Purity Grade
- By Physical Appearance
- By Core Application
- By Manufacturing Route
- By Sales Channel
- Key Takeaways
- Western Europe Market Analysis and Forecast, By Country
- Historical Market Size Value (USD Million) Trend Analysis By Market Taxonomy, 2021 to 2025
- Market Size Value (USD Million) Forecast By Market Taxonomy, 2026 to 2036
- By Country
- Germany
- France
- United Kingdom
- Italy
- Spain
- Benelux
- Nordics
- By Purity Grade
- By Physical Appearance
- By Core Application
- By Manufacturing Route
- By Sales Channel
- By Country
- Market Attractiveness Analysis
- By Country
- By Purity Grade
- By Physical Appearance
- By Core Application
- By Manufacturing Route
- By Sales Channel
- Key Takeaways
- Eastern Europe Market Analysis and Forecast, By Country
- Historical Market Size Value (USD Million) Trend Analysis By Market Taxonomy, 2021 to 2025
- Market Size Value (USD Million) Forecast By Market Taxonomy, 2026 to 2036
- By Country
- Poland
- Czech Republic
- Romania
- Hungary
- By Purity Grade
- By Physical Appearance
- By Core Application
- By Manufacturing Route
- By Sales Channel
- By Country
- Market Attractiveness Analysis
- By Country
- By Purity Grade
- By Physical Appearance
- By Core Application
- By Manufacturing Route
- By Sales Channel
- Key Takeaways
- East Asia Market Analysis and Forecast, By Country
- Historical Market Size Value (USD Million) Trend Analysis By Market Taxonomy, 2021 to 2025
- Market Size Value (USD Million) Forecast By Market Taxonomy, 2026 to 2036
- By Country
- China
- Japan
- South Korea
- By Purity Grade
- By Physical Appearance
- By Core Application
- By Manufacturing Route
- By Sales Channel
- By Country
- Market Attractiveness Analysis
- By Country
- By Purity Grade
- By Physical Appearance
- By Core Application
- By Manufacturing Route
- By Sales Channel
- Key Takeaways
- South Asia and Pacific Market Analysis and Forecast, By Country
- Historical Market Size Value (USD Million) Trend Analysis By Market Taxonomy, 2021 to 2025
- Market Size Value (USD Million) Forecast By Market Taxonomy, 2026 to 2036
- By Country
- India
- ASEAN
- Australia and New Zealand
- By Purity Grade
- By Physical Appearance
- By Core Application
- By Manufacturing Route
- By Sales Channel
- By Country
- Market Attractiveness Analysis
- By Country
- By Purity Grade
- By Physical Appearance
- By Core Application
- By Manufacturing Route
- By Sales Channel
- Key Takeaways
- Middle East and Africa Market Analysis and Forecast, By Country
- Historical Market Size Value (USD Million) Trend Analysis By Market Taxonomy, 2021 to 2025
- Market Size Value (USD Million) Forecast By Market Taxonomy, 2026 to 2036
- By Country
- GCC Countries
- South Africa
- Türkiye
- Israel
- By Purity Grade
- By Physical Appearance
- By Core Application
- By Manufacturing Route
- By Sales Channel
- By Country
- Market Attractiveness Analysis
- By Country
- By Purity Grade
- By Physical Appearance
- By Core Application
- By Manufacturing Route
- By Sales Channel
- Key Takeaways
- Key Countries Market Analysis
- United States
- Pricing Analysis
- Market Share Analysis, 2025
- By Purity Grade
- By Physical Appearance
- By Core Application
- By Manufacturing Route
- By Sales Channel
- Canada
- Pricing Analysis
- Market Share Analysis, 2025
- By Purity Grade
- By Physical Appearance
- By Core Application
- By Manufacturing Route
- By Sales Channel
- Mexico
- Pricing Analysis
- Market Share Analysis, 2025
- By Purity Grade
- By Physical Appearance
- By Core Application
- By Manufacturing Route
- By Sales Channel
- Brazil
- Pricing Analysis
- Market Share Analysis, 2025
- By Purity Grade
- By Physical Appearance
- By Core Application
- By Manufacturing Route
- By Sales Channel
- Chile
- Pricing Analysis
- Market Share Analysis, 2025
- By Purity Grade
- By Physical Appearance
- By Core Application
- By Manufacturing Route
- By Sales Channel
- Germany
- Pricing Analysis
- Market Share Analysis, 2025
- By Purity Grade
- By Physical Appearance
- By Core Application
- By Manufacturing Route
- By Sales Channel
- United Kingdom
- Pricing Analysis
- Market Share Analysis, 2025
- By Purity Grade
- By Physical Appearance
- By Core Application
- By Manufacturing Route
- By Sales Channel
- Italy
- Pricing Analysis
- Market Share Analysis, 2025
- By Purity Grade
- By Physical Appearance
- By Core Application
- By Manufacturing Route
- By Sales Channel
- Spain
- Pricing Analysis
- Market Share Analysis, 2025
- By Purity Grade
- By Physical Appearance
- By Core Application
- By Manufacturing Route
- By Sales Channel
- France
- Pricing Analysis
- Market Share Analysis, 2025
- By Purity Grade
- By Physical Appearance
- By Core Application
- By Manufacturing Route
- By Sales Channel
- India
- Pricing Analysis
- Market Share Analysis, 2025
- By Purity Grade
- By Physical Appearance
- By Core Application
- By Manufacturing Route
- By Sales Channel
- ASEAN
- Pricing Analysis
- Market Share Analysis, 2025
- By Purity Grade
- By Physical Appearance
- By Core Application
- By Manufacturing Route
- By Sales Channel
- Australia and New Zealand
- Pricing Analysis
- Market Share Analysis, 2025
- By Purity Grade
- By Physical Appearance
- By Core Application
- By Manufacturing Route
- By Sales Channel
- China
- Pricing Analysis
- Market Share Analysis, 2025
- By Purity Grade
- By Physical Appearance
- By Core Application
- By Manufacturing Route
- By Sales Channel
- Japan
- Pricing Analysis
- Market Share Analysis, 2025
- By Purity Grade
- By Physical Appearance
- By Core Application
- By Manufacturing Route
- By Sales Channel
- South Korea
- Pricing Analysis
- Market Share Analysis, 2025
- By Purity Grade
- By Physical Appearance
- By Core Application
- By Manufacturing Route
- By Sales Channel
- Poland
- Pricing Analysis
- Market Share Analysis, 2025
- By Purity Grade
- By Physical Appearance
- By Core Application
- By Manufacturing Route
- By Sales Channel
- Hungary
- Pricing Analysis
- Market Share Analysis, 2025
- By Purity Grade
- By Physical Appearance
- By Core Application
- By Manufacturing Route
- By Sales Channel
- Türkiye
- Pricing Analysis
- Market Share Analysis, 2025
- By Purity Grade
- By Physical Appearance
- By Core Application
- By Manufacturing Route
- By Sales Channel
- South Africa
- Pricing Analysis
- Market Share Analysis, 2025
- By Purity Grade
- By Physical Appearance
- By Core Application
- By Manufacturing Route
- By Sales Channel
- United States
- Market Structure Analysis
- Competition Dashboard
- Competition Benchmarking
- Market Share Analysis of Top Players
- By Regional
- By Purity Grade
- By Physical Appearance
- By Core Application
- By Manufacturing Route
- By Sales Channel
- Emerging Startups
- Innovation Benchmarking
- Competition Analysis
- Competition Deep Dive
- Novartis AG
- Overview
- Product Portfolio
- Profitability by Market Segments
- Sales Footprint
- Strategy Overview
- Marketing Strategy
- Product Strategy
- Channel Strategy
- Roche Holding AG
- Merck and Co. Inc.
- Sanofi SA
- AstraZeneca plc
- Medtronic plc
- Abbott Laboratories
- Thermo Fisher Scientific Inc.
- Danaher Corporation
- Boston Scientific Corporation
- Novartis AG
- Case Studies
- Success Stories
- Recent Developments
- Competition Deep Dive
- Assumptions & Acronyms Used
List of Tables
- Table 1: Global Market Value (USD Million) Forecast by Region, 2021 to 2036
- Table 2: Global Market Value (USD Million) Forecast by Purity Grade, 2021 to 2036
- Table 3: Global Market Value (USD Million) Forecast by Physical Appearance, 2021 to 2036
- Table 4: Global Market Value (USD Million) Forecast by Core Application, 2021 to 2036
- Table 5: Global Market Value (USD Million) Forecast by Manufacturing Route, 2021 to 2036
- Table 6: Global Market Value (USD Million) Forecast by Sales Channel, 2021 to 2036
- Table 7: North America Market Value (USD Million) Forecast by Country, 2021 to 2036
- Table 8: North America Market Value (USD Million) Forecast by Purity Grade, 2021 to 2036
- Table 9: North America Market Value (USD Million) Forecast by Physical Appearance, 2021 to 2036
- Table 10: North America Market Value (USD Million) Forecast by Core Application, 2021 to 2036
- Table 11: North America Market Value (USD Million) Forecast by Manufacturing Route, 2021 to 2036
- Table 12: North America Market Value (USD Million) Forecast by Sales Channel, 2021 to 2036
- Table 13: Latin America Market Value (USD Million) Forecast by Country, 2021 to 2036
- Table 14: Latin America Market Value (USD Million) Forecast by Purity Grade, 2021 to 2036
- Table 15: Latin America Market Value (USD Million) Forecast by Physical Appearance, 2021 to 2036
- Table 16: Latin America Market Value (USD Million) Forecast by Core Application, 2021 to 2036
- Table 17: Latin America Market Value (USD Million) Forecast by Manufacturing Route, 2021 to 2036
- Table 18: Latin America Market Value (USD Million) Forecast by Sales Channel, 2021 to 2036
- Table 19: Western Europe Market Value (USD Million) Forecast by Country, 2021 to 2036
- Table 20: Western Europe Market Value (USD Million) Forecast by Purity Grade, 2021 to 2036
- Table 21: Western Europe Market Value (USD Million) Forecast by Physical Appearance, 2021 to 2036
- Table 22: Western Europe Market Value (USD Million) Forecast by Core Application, 2021 to 2036
- Table 23: Western Europe Market Value (USD Million) Forecast by Manufacturing Route, 2021 to 2036
- Table 24: Western Europe Market Value (USD Million) Forecast by Sales Channel, 2021 to 2036
- Table 25: Eastern Europe Market Value (USD Million) Forecast by Country, 2021 to 2036
- Table 26: Eastern Europe Market Value (USD Million) Forecast by Purity Grade, 2021 to 2036
- Table 27: Eastern Europe Market Value (USD Million) Forecast by Physical Appearance, 2021 to 2036
- Table 28: Eastern Europe Market Value (USD Million) Forecast by Core Application, 2021 to 2036
- Table 29: Eastern Europe Market Value (USD Million) Forecast by Manufacturing Route, 2021 to 2036
- Table 30: Eastern Europe Market Value (USD Million) Forecast by Sales Channel, 2021 to 2036
- Table 31: East Asia Market Value (USD Million) Forecast by Country, 2021 to 2036
- Table 32: East Asia Market Value (USD Million) Forecast by Purity Grade, 2021 to 2036
- Table 33: East Asia Market Value (USD Million) Forecast by Physical Appearance, 2021 to 2036
- Table 34: East Asia Market Value (USD Million) Forecast by Core Application, 2021 to 2036
- Table 35: East Asia Market Value (USD Million) Forecast by Manufacturing Route, 2021 to 2036
- Table 36: East Asia Market Value (USD Million) Forecast by Sales Channel, 2021 to 2036
- Table 37: South Asia and Pacific Market Value (USD Million) Forecast by Country, 2021 to 2036
- Table 38: South Asia and Pacific Market Value (USD Million) Forecast by Purity Grade, 2021 to 2036
- Table 39: South Asia and Pacific Market Value (USD Million) Forecast by Physical Appearance, 2021 to 2036
- Table 40: South Asia and Pacific Market Value (USD Million) Forecast by Core Application, 2021 to 2036
- Table 41: South Asia and Pacific Market Value (USD Million) Forecast by Manufacturing Route, 2021 to 2036
- Table 42: South Asia and Pacific Market Value (USD Million) Forecast by Sales Channel, 2021 to 2036
- Table 43: Middle East and Africa Market Value (USD Million) Forecast by Country, 2021 to 2036
- Table 44: Middle East and Africa Market Value (USD Million) Forecast by Purity Grade, 2021 to 2036
- Table 45: Middle East and Africa Market Value (USD Million) Forecast by Physical Appearance, 2021 to 2036
- Table 46: Middle East and Africa Market Value (USD Million) Forecast by Core Application, 2021 to 2036
- Table 47: Middle East and Africa Market Value (USD Million) Forecast by Manufacturing Route, 2021 to 2036
- Table 48: Middle East and Africa Market Value (USD Million) Forecast by Sales Channel, 2021 to 2036
List of Figures
- Figure 1: Global Market Pricing Analysis
- Figure 2: Global Market Value (USD Million) Forecast 2021-2036
- Figure 3: Global Market Value Share and BPS Analysis by Purity Grade, 2026 and 2036
- Figure 4: Global Market Y-o-Y Growth Comparison by Purity Grade, 2026-2036
- Figure 5: Global Market Attractiveness Analysis by Purity Grade
- Figure 6: Global Market Value Share and BPS Analysis by Physical Appearance, 2026 and 2036
- Figure 7: Global Market Y-o-Y Growth Comparison by Physical Appearance, 2026-2036
- Figure 8: Global Market Attractiveness Analysis by Physical Appearance
- Figure 9: Global Market Value Share and BPS Analysis by Core Application, 2026 and 2036
- Figure 10: Global Market Y-o-Y Growth Comparison by Core Application, 2026-2036
- Figure 11: Global Market Attractiveness Analysis by Core Application
- Figure 12: Global Market Value Share and BPS Analysis by Manufacturing Route, 2026 and 2036
- Figure 13: Global Market Y-o-Y Growth Comparison by Manufacturing Route, 2026-2036
- Figure 14: Global Market Attractiveness Analysis by Manufacturing Route
- Figure 15: Global Market Value Share and BPS Analysis by Sales Channel, 2026 and 2036
- Figure 16: Global Market Y-o-Y Growth Comparison by Sales Channel, 2026-2036
- Figure 17: Global Market Attractiveness Analysis by Sales Channel
- Figure 18: Global Market Value (USD Million) Share and BPS Analysis by Region, 2026 and 2036
- Figure 19: Global Market Y-o-Y Growth Comparison by Region, 2026-2036
- Figure 20: Global Market Attractiveness Analysis by Region
- Figure 21: North America Market Incremental Dollar Opportunity, 2026-2036
- Figure 22: Latin America Market Incremental Dollar Opportunity, 2026-2036
- Figure 23: Western Europe Market Incremental Dollar Opportunity, 2026-2036
- Figure 24: Eastern Europe Market Incremental Dollar Opportunity, 2026-2036
- Figure 25: East Asia Market Incremental Dollar Opportunity, 2026-2036
- Figure 26: South Asia and Pacific Market Incremental Dollar Opportunity, 2026-2036
- Figure 27: Middle East and Africa Market Incremental Dollar Opportunity, 2026-2036
- Figure 28: North America Market Value Share and BPS Analysis by Country, 2026 and 2036
- Figure 29: North America Market Value Share and BPS Analysis by Purity Grade, 2026 and 2036
- Figure 30: North America Market Y-o-Y Growth Comparison by Purity Grade, 2026-2036
- Figure 31: North America Market Attractiveness Analysis by Purity Grade
- Figure 32: North America Market Value Share and BPS Analysis by Physical Appearance, 2026 and 2036
- Figure 33: North America Market Y-o-Y Growth Comparison by Physical Appearance, 2026-2036
- Figure 34: North America Market Attractiveness Analysis by Physical Appearance
- Figure 35: North America Market Value Share and BPS Analysis by Core Application, 2026 and 2036
- Figure 36: North America Market Y-o-Y Growth Comparison by Core Application, 2026-2036
- Figure 37: North America Market Attractiveness Analysis by Core Application
- Figure 38: North America Market Value Share and BPS Analysis by Manufacturing Route, 2026 and 2036
- Figure 39: North America Market Y-o-Y Growth Comparison by Manufacturing Route, 2026-2036
- Figure 40: North America Market Attractiveness Analysis by Manufacturing Route
- Figure 41: North America Market Value Share and BPS Analysis by Sales Channel, 2026 and 2036
- Figure 42: North America Market Y-o-Y Growth Comparison by Sales Channel, 2026-2036
- Figure 43: North America Market Attractiveness Analysis by Sales Channel
- Figure 44: Latin America Market Value Share and BPS Analysis by Country, 2026 and 2036
- Figure 45: Latin America Market Value Share and BPS Analysis by Purity Grade, 2026 and 2036
- Figure 46: Latin America Market Y-o-Y Growth Comparison by Purity Grade, 2026-2036
- Figure 47: Latin America Market Attractiveness Analysis by Purity Grade
- Figure 48: Latin America Market Value Share and BPS Analysis by Physical Appearance, 2026 and 2036
- Figure 49: Latin America Market Y-o-Y Growth Comparison by Physical Appearance, 2026-2036
- Figure 50: Latin America Market Attractiveness Analysis by Physical Appearance
- Figure 51: Latin America Market Value Share and BPS Analysis by Core Application, 2026 and 2036
- Figure 52: Latin America Market Y-o-Y Growth Comparison by Core Application, 2026-2036
- Figure 53: Latin America Market Attractiveness Analysis by Core Application
- Figure 54: Latin America Market Value Share and BPS Analysis by Manufacturing Route, 2026 and 2036
- Figure 55: Latin America Market Y-o-Y Growth Comparison by Manufacturing Route, 2026-2036
- Figure 56: Latin America Market Attractiveness Analysis by Manufacturing Route
- Figure 57: Latin America Market Value Share and BPS Analysis by Sales Channel, 2026 and 2036
- Figure 58: Latin America Market Y-o-Y Growth Comparison by Sales Channel, 2026-2036
- Figure 59: Latin America Market Attractiveness Analysis by Sales Channel
- Figure 60: Western Europe Market Value Share and BPS Analysis by Country, 2026 and 2036
- Figure 61: Western Europe Market Value Share and BPS Analysis by Purity Grade, 2026 and 2036
- Figure 62: Western Europe Market Y-o-Y Growth Comparison by Purity Grade, 2026-2036
- Figure 63: Western Europe Market Attractiveness Analysis by Purity Grade
- Figure 64: Western Europe Market Value Share and BPS Analysis by Physical Appearance, 2026 and 2036
- Figure 65: Western Europe Market Y-o-Y Growth Comparison by Physical Appearance, 2026-2036
- Figure 66: Western Europe Market Attractiveness Analysis by Physical Appearance
- Figure 67: Western Europe Market Value Share and BPS Analysis by Core Application, 2026 and 2036
- Figure 68: Western Europe Market Y-o-Y Growth Comparison by Core Application, 2026-2036
- Figure 69: Western Europe Market Attractiveness Analysis by Core Application
- Figure 70: Western Europe Market Value Share and BPS Analysis by Manufacturing Route, 2026 and 2036
- Figure 71: Western Europe Market Y-o-Y Growth Comparison by Manufacturing Route, 2026-2036
- Figure 72: Western Europe Market Attractiveness Analysis by Manufacturing Route
- Figure 73: Western Europe Market Value Share and BPS Analysis by Sales Channel, 2026 and 2036
- Figure 74: Western Europe Market Y-o-Y Growth Comparison by Sales Channel, 2026-2036
- Figure 75: Western Europe Market Attractiveness Analysis by Sales Channel
- Figure 76: Eastern Europe Market Value Share and BPS Analysis by Country, 2026 and 2036
- Figure 77: Eastern Europe Market Value Share and BPS Analysis by Purity Grade, 2026 and 2036
- Figure 78: Eastern Europe Market Y-o-Y Growth Comparison by Purity Grade, 2026-2036
- Figure 79: Eastern Europe Market Attractiveness Analysis by Purity Grade
- Figure 80: Eastern Europe Market Value Share and BPS Analysis by Physical Appearance, 2026 and 2036
- Figure 81: Eastern Europe Market Y-o-Y Growth Comparison by Physical Appearance, 2026-2036
- Figure 82: Eastern Europe Market Attractiveness Analysis by Physical Appearance
- Figure 83: Eastern Europe Market Value Share and BPS Analysis by Core Application, 2026 and 2036
- Figure 84: Eastern Europe Market Y-o-Y Growth Comparison by Core Application, 2026-2036
- Figure 85: Eastern Europe Market Attractiveness Analysis by Core Application
- Figure 86: Eastern Europe Market Value Share and BPS Analysis by Manufacturing Route, 2026 and 2036
- Figure 87: Eastern Europe Market Y-o-Y Growth Comparison by Manufacturing Route, 2026-2036
- Figure 88: Eastern Europe Market Attractiveness Analysis by Manufacturing Route
- Figure 89: Eastern Europe Market Value Share and BPS Analysis by Sales Channel, 2026 and 2036
- Figure 90: Eastern Europe Market Y-o-Y Growth Comparison by Sales Channel, 2026-2036
- Figure 91: Eastern Europe Market Attractiveness Analysis by Sales Channel
- Figure 92: East Asia Market Value Share and BPS Analysis by Country, 2026 and 2036
- Figure 93: East Asia Market Value Share and BPS Analysis by Purity Grade, 2026 and 2036
- Figure 94: East Asia Market Y-o-Y Growth Comparison by Purity Grade, 2026-2036
- Figure 95: East Asia Market Attractiveness Analysis by Purity Grade
- Figure 96: East Asia Market Value Share and BPS Analysis by Physical Appearance, 2026 and 2036
- Figure 97: East Asia Market Y-o-Y Growth Comparison by Physical Appearance, 2026-2036
- Figure 98: East Asia Market Attractiveness Analysis by Physical Appearance
- Figure 99: East Asia Market Value Share and BPS Analysis by Core Application, 2026 and 2036
- Figure 100: East Asia Market Y-o-Y Growth Comparison by Core Application, 2026-2036
- Figure 101: East Asia Market Attractiveness Analysis by Core Application
- Figure 102: East Asia Market Value Share and BPS Analysis by Manufacturing Route, 2026 and 2036
- Figure 103: East Asia Market Y-o-Y Growth Comparison by Manufacturing Route, 2026-2036
- Figure 104: East Asia Market Attractiveness Analysis by Manufacturing Route
- Figure 105: East Asia Market Value Share and BPS Analysis by Sales Channel, 2026 and 2036
- Figure 106: East Asia Market Y-o-Y Growth Comparison by Sales Channel, 2026-2036
- Figure 107: East Asia Market Attractiveness Analysis by Sales Channel
- Figure 108: South Asia and Pacific Market Value Share and BPS Analysis by Country, 2026 and 2036
- Figure 109: South Asia and Pacific Market Value Share and BPS Analysis by Purity Grade, 2026 and 2036
- Figure 110: South Asia and Pacific Market Y-o-Y Growth Comparison by Purity Grade, 2026-2036
- Figure 111: South Asia and Pacific Market Attractiveness Analysis by Purity Grade
- Figure 112: South Asia and Pacific Market Value Share and BPS Analysis by Physical Appearance, 2026 and 2036
- Figure 113: South Asia and Pacific Market Y-o-Y Growth Comparison by Physical Appearance, 2026-2036
- Figure 114: South Asia and Pacific Market Attractiveness Analysis by Physical Appearance
- Figure 115: South Asia and Pacific Market Value Share and BPS Analysis by Core Application, 2026 and 2036
- Figure 116: South Asia and Pacific Market Y-o-Y Growth Comparison by Core Application, 2026-2036
- Figure 117: South Asia and Pacific Market Attractiveness Analysis by Core Application
- Figure 118: South Asia and Pacific Market Value Share and BPS Analysis by Manufacturing Route, 2026 and 2036
- Figure 119: South Asia and Pacific Market Y-o-Y Growth Comparison by Manufacturing Route, 2026-2036
- Figure 120: South Asia and Pacific Market Attractiveness Analysis by Manufacturing Route
- Figure 121: South Asia and Pacific Market Value Share and BPS Analysis by Sales Channel, 2026 and 2036
- Figure 122: South Asia and Pacific Market Y-o-Y Growth Comparison by Sales Channel, 2026-2036
- Figure 123: South Asia and Pacific Market Attractiveness Analysis by Sales Channel
- Figure 124: Middle East and Africa Market Value Share and BPS Analysis by Country, 2026 and 2036
- Figure 125: Middle East and Africa Market Value Share and BPS Analysis by Purity Grade, 2026 and 2036
- Figure 126: Middle East and Africa Market Y-o-Y Growth Comparison by Purity Grade, 2026-2036
- Figure 127: Middle East and Africa Market Attractiveness Analysis by Purity Grade
- Figure 128: Middle East and Africa Market Value Share and BPS Analysis by Physical Appearance, 2026 and 2036
- Figure 129: Middle East and Africa Market Y-o-Y Growth Comparison by Physical Appearance, 2026-2036
- Figure 130: Middle East and Africa Market Attractiveness Analysis by Physical Appearance
- Figure 131: Middle East and Africa Market Value Share and BPS Analysis by Core Application, 2026 and 2036
- Figure 132: Middle East and Africa Market Y-o-Y Growth Comparison by Core Application, 2026-2036
- Figure 133: Middle East and Africa Market Attractiveness Analysis by Core Application
- Figure 134: Middle East and Africa Market Value Share and BPS Analysis by Manufacturing Route, 2026 and 2036
- Figure 135: Middle East and Africa Market Y-o-Y Growth Comparison by Manufacturing Route, 2026-2036
- Figure 136: Middle East and Africa Market Attractiveness Analysis by Manufacturing Route
- Figure 137: Middle East and Africa Market Value Share and BPS Analysis by Sales Channel, 2026 and 2036
- Figure 138: Middle East and Africa Market Y-o-Y Growth Comparison by Sales Channel, 2026-2036
- Figure 139: Middle East and Africa Market Attractiveness Analysis by Sales Channel
- Figure 140: Global Market - Tier Structure Analysis
- Figure 141: Global Market - Company Share Analysis
Frequently Asked Questions
How big is the beta-alanine market in 2026, and what is forecast for 2036?
FMI estimates that the global beta-alanine market size stood at USD 473.5 million in 2025 and reached USD 508.1 million in 2026. Overall industry valuation is on track to hit USD 1,066.9 million by 2036 as sports nutrition and metabolic formulas scale daily gram doses.
What is the CAGR for the beta-alanine market from 2026 to 2036?
The beta-alanine sector is projected to expand at a 7.7% CAGR over the 2026 to 2036 window, adding USD 558.8 million in net market value across sports nutrition and pharmaceutical intermediate channels.
Which purity grade segment leads the beta-alanine market?
USP Compendial Sports Supplement Grade Above 99% holds 48.7% of purity grade demand in 2026 because multi-gram daily dosing requires strict control of heavy metals and residual monomers.
Which physical appearance segment leads the beta-alanine market?
Uncoated Free-Flowing White Crystalline Powder represents 52.4% of the physical appearance category in 2026 as dry crystalline grades dissolve rapidly and integrate directly into pre-workout powder tubs.
Which country has a notable growth outlook during the assessment period?
South Korea leads national expansion projections at an 8.7% CAGR through 2036, supported by convenience-store endurance shots and functional health food clearances.
Who are the key players in the market?
Novartis AG and Roche Holding AG with Merck and Co Inc and Sanofi SA lead pharmaceutical intermediate synthesis. AstraZeneca plc and Abbott Laboratories with Thermo Fisher Scientific Inc and Danaher Corporation, Medtronic plc, and Boston Scientific Corporation anchor clinical nutrition and analytical systems.
Preview the report firsthand - request a free sample
Get SampleGet the brochure for pricing and purchase details.
Get PDF
