
- Market Size (2026)
- USD 156.2 Mn
- Forecast (2036)
- USD 274.5 Mn
- CAGR (2026 to 2036)
- 5.8%
How big is Menadione Market in 2026?
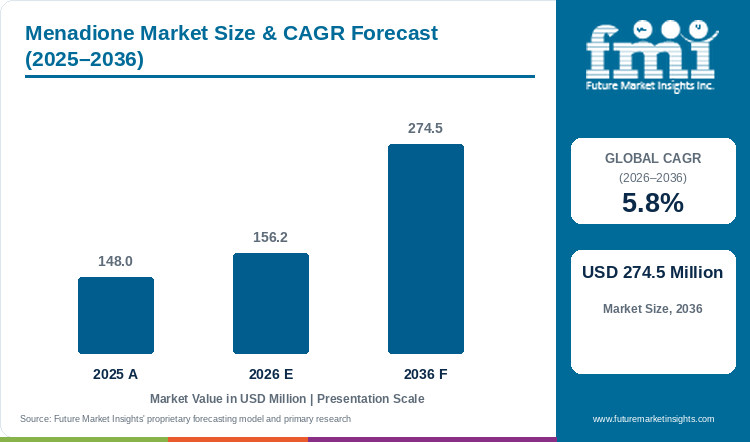
The menadione market demonstrated steady progress from USD 148.0 million in 2025 to USD 156.2 million in 2026, building toward a targeted valuation of USD 274.5 million by 2036 at a CAGR of 5.8%.
Commercial poultry and swine feed producers are raising vitamin K3 inclusion per ton of ration because mold toxins in stored grain and preventive flock medications reduce natural vitamin production in animals. Global menadione market size reached USD 148.0 million during 2025 and advances to a projected USD 156.2 million for 2026, before scaling to USD 274.5 million by the close of 2036 on a 5.8% ten-year CAGR. Menadione Sodium Bisulfite MSB leads 2026 derivative demand at 40.8% share since its high active vitamin content gives feed mills the lowest fortification cost per batch. Buyer confidence across Europe strengthened in September 2026 when the European Commission adopted Implementing Regulation (EU) 2026/2115 renewing feed authorization for menadione sodium bisulfite 3a710 and menadione nicotinamide bisulfite 3a711 until October 2036. This regulatory renewal supports faster adoption than general compound feed premixes at 3.3% CAGR, since high-density livestock farms require continuous vitamin K3 dosing to prevent internal bleeding and bone defects. Suppliers are adding regional blending capacity to meet this demand, as seen in November 2025 when Cargill increased output at its Engerwitzdorf micronutrition plant in Austria by 50% to 30,000 metric tons annually. FMI market monitoring confirms that heat losses during steam pelleting and strict workplace chromium dust rules remain key factors restraining unstabilized powder adoption through 2036.
Key Market Trends & Insights
- By chemical salt derivative: Menadione Sodium Bisulfite MSB holds an estimated 40.8% share in 2026 because minimum 50.0% active menadione equivalence minimizes per-ton ration fortification cost.
- By physical format: Dry Free-Flowing Mineral Premix Powder represents 61.2% in 2026 as low-moisture crystalline carriers blend uniformly into automated feed mill micro-dosing bins.
- By target sector: Poultry Broiler and Layer Vitamin K3 Feeds account for 39.9% in 2026 because short intestinal transit and coccidiosis prevention require continuous dietary prothrombin support.
- By feed grade specification: Standard Feed Grade Minimum 50% Menadione secures 56.4% in 2026 owing to broad regulatory registration across starter and grower livestock rations.
- By distribution channel: Direct to Integrated Feed Mills commands 54.8% in 2026 through multi-plant quality audits and batch-specific chromium certificates of analysis.
Regional Highlights
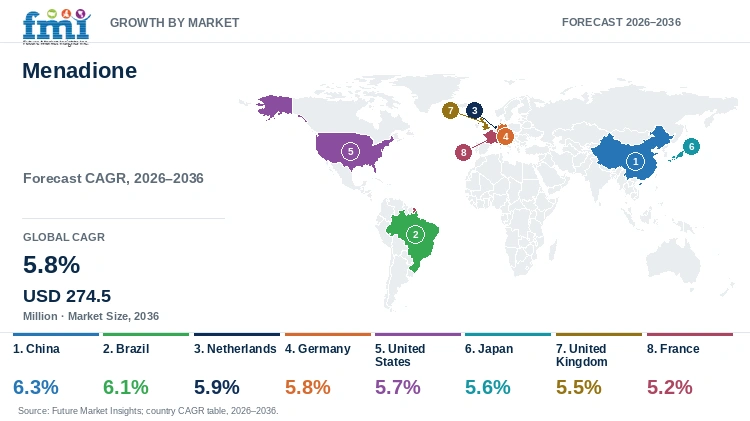
- Top national expansion: China leads national growth projections at a 6.3% CAGR through 2036 under industrial hog herd consolidation and intensive aquaculture feed fortification.
- Broader country progression: Brazil advances at a 6.1% CAGR ahead of the Netherlands at 5.9% and Germany at 5.8%, whereas the United States records a 5.7% CAGR.
Market Size & Forecast
Table 1: Market Size and Forecast for the Menadione Market (USD million and CAGR percentage), 2025 to 2036
| Metric | Value |
|---|---|
| 2025 Market Size | USD 148.0 million |
| Estimated Market Size in 2026 | USD 156.2 million |
| Projected Market Size by 2036 | USD 274.5 million |
| CAGR, 2026 to 2036 | 5.8% |
| Added Market Value, 2026 to 2036 | USD 118.3 million |
Commercial livestock producers face costly flock mortality and weak skeletal growth whenever mold-damaged corn reduces natural blood-clotting activity in animals. Natural vitamin K1 present in green forage breaks down rapidly during grain drying and silo storage, which creates a recurring nutritional gap for confinement farms. Because of this storage loss, feed mills must add synthetic vitamin K3 salts to every batch of commercial starter and grower feed. In December 2025, the European Food Safety Authority FEEDAP Panel reviewed commercial feed dossiers and confirmed that menadione sodium bisulfite batches average 51.6% active vitamin K3 while nicotinamide grades retain 75% to 85% potency after pelleting. These verified stability figures encourage feed nutritionists to combine stabilized vitamin K3 with feed micronutrients so commercial flocks maintain strong survival rates.
Fortified-Feed and Active-Dosage Sizing
Table 2: Fortified-Feed and Active-Dosage Sizing for the Menadione Market (USD million and operational ranges), 2025 to 2036
| Metric | 2025 | 2026 | 2036 |
|---|---|---|---|
| Market size (USD million) | 148.0 | 156.2 | 274.5 |
| Fortified compound feed volume (million metric tons) | 1,180.0 to 1,240.0 | 1,230.0 to 1,295.0 | 1,890.0 to 2,010.0 |
| Commercial menadione salt volume (thousand metric tons) | 11.2 to 12.4 | 11.8 to 13.0 | 19.5 to 21.6 |
| Fortification cost per metric ton of feed (USD) | 0.11 to 0.13 | 0.12 to 0.13 | 0.13 to 0.15 |
Operational note: Fortified-feed ranges apply standard 1.5 to 4.0 mg/kg active vitamin K3 dosing in poultry and swine diets and 10.0 to 40.0 mg/kg in aquaculture feeds.
Feed mills operating high-output steam pelleting lines expose vitamin blends to moisture and heat that rapidly break down unprotected vitamin powders. When standard vitamin K3 contacts moisture and trace minerals inside warm conditioning chambers, potency drops before the feed reaches the farm. To prevent this loss and avoid expensive over-dosing, commercial feed manufacturers actively adopt coated and nicotinamide-bound vitamin K3 formats paired with vitamin premixes for long warehouse shelf life.
Per Capita & Commercial Feed Mill Line Sizing
Table 3: Per Capita and Feed Mill Line Market Value Indicators for the Menadione Market (USD), 2025 to 2036
| Metric | 2025 | 2026 | 2036 |
|---|---|---|---|
| Global population (billion) | 8.2 | 8.3 | 9.0 |
| Market value per 1,000 people (USD) | 18.0 | 18.8 | 30.5 |
| Annual market value per commercial feed mill (USD thousand) | 5.2 to 5.8 | 5.5 to 6.1 | 9.2 to 10.4 |
| High-stability MNB & MPB derivative share (%) | 46.0% to 49.0% | 48.0% to 51.0% | 58.0% to 62.0% |
Table 4: Industrial Feed Mill & Channel Indicators for the Menadione Market (USD and percentages), 2026
| Metric | Value | Institutional Reference Basis |
|---|---|---|
| Market size, 2026 | USD 156.2 million | 2026 global market value baseline |
| Commercial compound feed mills global | 27,500 mills | Industrial poultry, swine, aquafeed & pet plants |
| Market value per feed mill | USD 5,680.0 | Annualized menadione procurement per plant |
| Direct to Integrated Feed Mills value, 2026 | USD 85.6 million | 54.8% distribution channel allocation |
Feed manufacturers are shifting from basic sodium bisulfite powders toward nicotinamide-bound vitamin K3 because lower moisture content prevents caking inside humid storage bins. Standard sodium bisulfite salts absorb moisture when blended with choline chloride, which clogs automated dosing screws and slows plant output. Formulators combine low-dust nicotinamide granules with mineral premixes to eliminate caking and protect vitamin potency against copper and iron oxidation.
Analyst Perspective
"Feed integrators no longer buy menadione as an interchangeable commodity powder because steam-pelleting heat losses and workplace dust rules directly impact feed mill operating costs. Suppliers that offer low-chromium nicotinamide complexes and coated premix granules will secure multi-year supply contracts across commercial poultry and aquaculture mills."
- Nandini Roy Choudhury, Principal Consultant, Future Market Insights.
How is the menadione market segmented?
The menadione market is segmented by chemical salt derivative, physical format, target sector, feed grade specification, and distribution channel. In 2026, Menadione Sodium Bisulfite MSB is projected at 40.8%, Dry Free-Flowing Mineral Premix Powder at 61.2%, Poultry Broiler and Layer Vitamin K3 Feeds at 39.9%, Standard Feed Grade Minimum 50% Menadione at 56.4%, and Direct to Integrated Feed Mills at 54.8%.
By chemical salt derivative: Menadione Sodium Bisulfite MSB and Menadione Nicotinamide Bisulfite MNB High Stability lead demand. Menadione Dimethylpyrimidinol Bisulfite MPB and Menadione Sodium Bisulfite Complex MSBC complete the category.
By physical format: Dry Free-Flowing Mineral Premix Powder and Microencapsulated Coated Granules anchor commercial supply. Water-Soluble Dispersible Powder and Feed-Grade Pelleted Concentrates serve specialized dosing lines.
By target sector: Poultry Broiler and Layer Vitamin K3 Feeds and Swine Piglet and Grow-Finish Diets represent primary volume. Aquaculture Marine Fish and Shrimp Feeds and Pet Food Nutritional Premixes capture specialty demand.
By feed grade specification: Standard Feed Grade Minimum 50% Menadione and High-Stability Low-Chromium MNB Grade lead procurement. Veterinary Water-Dispersible Grade and Companion Animal Compliance Grade serve targeted rations.
By distribution channel: Direct to Integrated Feed Mills and Specialty Premix and Micronutrient Blenders handle bulk contracts. Agricultural Veterinary Distributors and Online B2B Ingredient Platforms supply regional accounts.
Why does Menadione Sodium Bisulfite MSB lead the chemical salt derivative category?
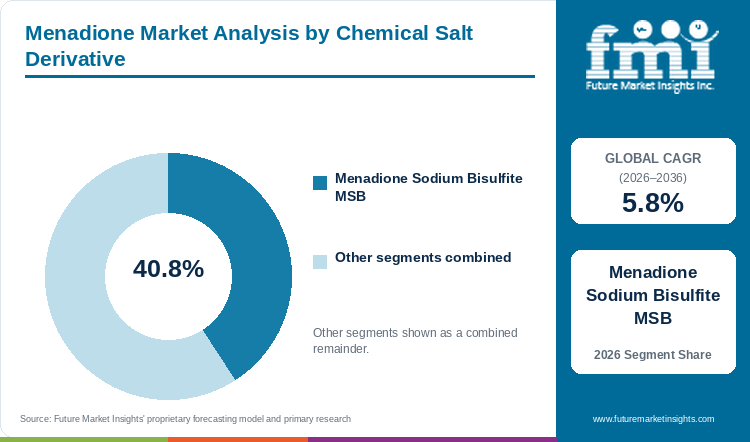
Menadione Sodium Bisulfite MSB holds an estimated 40.8% of chemical salt derivative demand in 2026, anchored by 51.6% average menadione content and rapid water solubility.
Table 5: Chemical Salt Derivative Share for the Menadione Market (percentage share), 2026
| Chemical Salt Derivative | Share (2026) |
|---|---|
| Menadione Sodium Bisulfite MSB | 40.8% |
| Other Segments Combined | 59.2%* |
| Total | 100.0% |
*Note: Remaining chemical salt derivative categories account for the balance of 2026 global menadione demand.
Table 6: Chemical Salt Derivative Leadership and Market Growth for the Menadione Market (segment and CAGR percentage), 2026 to 2036
| Metric | Value |
|---|---|
| Global CAGR (2026 to 2036) | 5.8% |
| Leading Segment | Menadione Sodium Bisulfite MSB |
Menadione Sodium Bisulfite MSB attracts the largest volume of orders from commercial feed mills because it delivers minimum 50.0% active vitamin K3 at the lowest price per kilogram. It dissolves quickly in cold water and mixes evenly into dry mash rations, making it the preferred choice for farms that do not use high-heat extrusion. Buyers sourcing compound feed and feed additives rely on MSB for starter broiler mash and veterinary drinking-water packets to keep ration costs low.
- Menadione Sodium Bisulfite MSB holds 40.8% of chemical salt derivative value in 2026 because its 1-to-2 vitamin K3 equivalency ratio delivers the lowest unit dosing cost.
- Federal veterinary feed guidance from the FDA Center for Veterinary Medicine confirms that synthetic menadione salts remain safe and effective across poultry and swine diets at levels up to 1,000 times baseline requirements, which sustains bulk MSB procurement.
What sustains Dry Free-Flowing Mineral Premix Powder leadership in the physical format segment?
Dry Free-Flowing Mineral Premix Powder represents 61.2% of the physical format category in 2026, supported by automated micro-bin flowability and premix carrier stability.
Dry Free-Flowing Mineral Premix Powder leads physical format demand because commercial feed mills run automated dry micro-dosing bins that require consistent powder flow. Liquid vitamin sprays require separate post-pelleting pumps and storage tanks that add maintenance expenses for regional mills. Dry crystalline powders blended on calcium carbonate or rice-hull carriers integrate directly into animal feed organic trace minerals premix bags without sticking or bridging inside hoppers.
- Dry Free-Flowing Mineral Premix Powder represents 61.2% of the physical format segment in 2026 as commercial premix plants standardize dry carrier dilution.
- This preference for dry premix stability was reinforced in July 2026 when a study in Mycologia showed that menadione at 0.50 mmol/L stops ochratoxin A mold toxin production in storage fungi, helping dry premixes protect feed quality.
How do Poultry Broiler and Layer Vitamin K3 Feeds lead the target sector category?
Poultry Broiler and Layer Vitamin K3 Feeds account for 39.9% of target sector demand in 2026, driven by short avian gut transit and coccidiostat prothrombin requirements.
Poultry Broiler and Layer Vitamin K3 Feeds represent the largest end-use sector because chickens and turkeys have a short digestive tract that produces almost no natural vitamin K. Without steady dietary vitamin K3 supplementation, fast-growing broilers suffer bruising and internal bleeding that downgrade carcass value at slaughterhouses. Integrators formulating high-protein rations with poultry meal also increase vitamin K3 dosage whenever flocks receive coccidiosis medications that block vitamin absorption.
- Poultry Broiler and Layer Vitamin K3 Feeds account for 39.9% of target sector demand in 2026 because intensive broiler and cage-free layer flocks require continuous prothrombin carboxylation.
- To verify how vitamin K3 protects poultry skeletal quality, researchers publishing in Poultry Science in February 2026 tested 300 breeder quails over eight weeks and showed that combining 2.0 mg/kg dietary vitamin K3 with vitamin D3 improved tibial bone ash and mineralization.
Why does Standard Feed Grade Minimum 50% Menadione lead the feed grade specification category?
Standard Feed Grade Minimum 50% Menadione secures 56.4% of feed grade specification value in 2026, supported by global feed monograph registration and cost efficiency.
Standard Feed Grade Minimum 50% Menadione captures the majority of buyer orders because it meets international feed safety limits on chromium residues while keeping per-ton fortification costs predictable. Although specialized aquaculture and pet food mills pay higher prices for coated grades, large hog and poultry operations prioritize standard 50% feed-grade powder for everyday mash and pelleted diets.
- Standard Feed Grade Minimum 50% Menadione secures 56.4% of feed grade specification demand in 2026 as bulk livestock mills prioritize standardized monograph compliance.
- Commercial adoption of standardized vitamin premixes was validated in March 2026 when a broiler study in Veterinary Medicine and Science showed that multi-component vitamin and antioxidant supplementation under high stocking density improved weight gain and feed conversion.
What gives Direct to Integrated Feed Mills the leading position in distribution channel?
Direct to Integrated Feed Mills commands 54.8% of distribution channel share in 2026, anchored by EU Regulation 2026/2115 premix traceability and chromium audits.
Direct to Integrated Feed Mills accounts for over half of market value because large poultry and pork producers audit vitamin suppliers directly for heavy-metal purity and workplace dust compliance. European Union Regulation 2026/2115 requires vitamin K3 to enter compound feed strictly through licensed premixtures, which encourages large feed mills to sign direct annual supply contracts with primary premix manufacturers.
- Direct to Integrated Feed Mills commands 54.8% of distribution channel value in 2026 because regulatory traceability and chromium speciation audits favor direct producer contracts.
- To serve these direct enterprise accounts more efficiently, dsm-firmenich announced an agreement in February 2026 with CVC Capital Partners to establish its Animal Nutrition and Health business as a dedicated standalone vitamin and premix company.
What are the drivers, restraints, and opportunities in the menadione market?
In the menadione market, intensive poultry and aquaculture fortification and EU 2036 regulatory renewal are projected to drive adoption whereas chromium reagent limits and pelleting heat loss restrain unstabilized MSB and nicotinamide MNB complexes create premium growth opportunities.
- Driver: Intensive aquaculture and high-density poultry farming require higher vitamin K3 dosing per ton of feed to prevent bleeding and support bone strength.
- Restraint: Hexavalent chromium reagent residues from sodium dichromate oxidation and thermal degradation during high-moisture steam pelleting restrict unstabilized MSB use and increase compliance costs.
- Opportunity: Adoption of nicotinamide-bound MNB and microencapsulated vitamin K3 granules opens high-margin demand in extruded aquafeeds and antibiotic-free swine nursery diets.
Growth Analysis and Future Potential: Qualitative Demand Catalysts
Rapid growth in commercial fish and shrimp farming across Asia and Latin America is creating strong new demand for heat-stable vitamin K3 formulations. Whereas land livestock require only 2 to 4 milligrams of vitamin K3 per kilogram of feed, farmed salmon and marine shrimp require 10 to 40 milligrams per kilogram to support survival and liver health under crowded pond conditions. Feed manufacturers blending aquafeed additives also run wet twin-screw extruders above 110 degrees Celsius, which drives buyers to select nicotinamide-stabilized MNB over basic MSB. This shift in aquaculture consumption patterns was demonstrated in April 2025 when a trial in Biology found that feeding coho salmon juveniles 31.97 to 43.5 mg/kg of menadione nicotinamide bisulfite significantly increased survival rates and liver vitamin stores.
Risk Assessment of the Menadione Market: Operational and Formulation Friction
Strict workplace dust limits and chromium residue caps in chemical manufacturing remain the main factors restraining low-cost menadione production. Chemical synthesis of vitamin K3 from methylnaphthalene uses sodium dichromate oxidation, which leaves trace chromium in the finished powder and requires costly wastewater treatment. In addition, regulatory agencies have not approved synthetic menadione for human food, and several premium dog food brands advertise vitamin K3-free recipes. A June 2025 metabolic study in Food Science and Nutrition explained that synthetic menadione requires liver enzyme conversion before becoming active vitamin K2 in tissues, which prompts ongoing scrutiny in companion-animal nutrition. Consequently, blenders supplying pet food premixes must invest in closed dust-free mixing lines and encapsulated formats.
Commercial Opportunity Analysis: Formulation Differentiation and Value-Add Formats
Suppliers are capturing higher profit margins by shifting feed mills from basic MSB powder to Menadione Nicotinamide Bisulfite MNB and microencapsulated granules. Substitution of sodium with nicotinamide removes water of crystallization and lowers powder moisture to 0.3%, while supplying 31.7% active vitamin B3 with 44.6% vitamin K3 in one ingredient. Because livestock rations already require niacin supplementation, feed mills can credit the vitamin B3 value in MNB to offset its higher purchase price. Formulators combining MNB with trace minerals in feed achieve up to 85% vitamin survival after steam pelleting. In October 2025, a broiler trial in Poultry Science confirmed that balanced trace-mineral and vitamin premixes reduce gut oxidation and improve nutrient digestibility in commercial flocks.
Menadione Market by Country (2026 to 2036)
FMI country modeling indicates that China leads menadione market value expansion at a 6.3% CAGR through 2036, ahead of Brazil at 6.1% and the Netherlands at 5.9%. Germany follows at 5.8% and the United States tracks at 5.7%, while Japan records 5.6% ahead of the United Kingdom at 5.5% and France at 5.2%. National growth differences reflect commercial feed mill consolidation and export poultry quality standards along with domestic vitamin synthesis capacity.
Table 7: Country CAGR and Primary Growth Levers for the Menadione Market (CAGR percentage and operational drivers), 2026 to 2036
| Country | CAGR (2026 to 2036) | Primary Growth Lever |
|---|---|---|
| China | 6.3% | Domestic 2-methylnaphthalene synthesis scale and hog and aquafeed consolidation |
| Brazil | 6.1% | Export broiler carcass bruising prevention and humidity-stable MNB premixes |
| Netherlands | 5.9% | Pan-European premix export blending and EU 2026/2115 low-dust compliance |
| Germany | 5.8% | Cage-free poultry coccidiosis management and strict workplace chromium rules |
| United States | 5.7% | 21 CFR 573.620 MPB pelleting stability across integrated broiler and swine mills |
| Japan | 5.6% | High-lipid marine finfish extrusion diets and table-egg shell quality protocols |
| United Kingdom | 5.5% | Mycotoxin-corrective broiler dosing and Scottish Atlantic salmon feed extrusion |
| France | 5.2% | Label Rouge free-range poultry parasite protection and cooperative feed integration |
Source: Future Market Insights analysis
China Menadione Market Outlook (2026 to 2036)
China leads global menadione growth at a 6.3% CAGR through 2036 because it is both the world's largest producer of vitamin K3 raw materials and the largest consumer of commercial hog and aquaculture feed. Chemical plants in Zhejiang and Jiangxi provinces integrate vitamin K3 oxidation with chromium salt production for leather tanning, which gives domestic premix blenders a direct cost advantage over import-dependent countries. On the demand side, medium and large hog farms are replacing backyard swill feeding with standardized compound rations. March 2026 Beijing attaché Grain and Feed Annual figures indicate that commercial feed mills are raising micronutrient fortification across over 700 million metric tons of domestic grain to improve feed conversion.
Key takeaway: In China, integrated domestic vitamin K3 synthesis and industrial hog feed modernization are projected to generate a top 6.3% CAGR.
Brazil Menadione Market Outlook (2026 to 2036)
What sets Brazil apart in the global menadione market is its large export broiler industry paired with warm tropical storage conditions that rapidly degrade unstabilized vitamins. Poultry and pork integrators in Parana and Santa Catarina enforce strict slaughterhouse grading where wing or breast bruising from vitamin K deficiency leads to export rejection. At the same time, high ambient humidity causes basic MSB powder to cake inside premix bags containing choline chloride. Findings in the September 2026 USDA GAIN Brazil Poultry and Products Annual report confirm that rising poultry exports to Middle Eastern and Asian buyers are expanding pelleted feed output across Brazil. This export demand pushes Brazilian mills toward coated vitamin K3 grades at a 6.1% CAGR.
Key takeaway: In Brazil, tropical premix storage humidity and strict export broiler carcass standards are expected to deliver a 6.1% CAGR.
Netherlands Menadione Market Outlook (2026 to 2036)
Demand in the Netherlands advances at a 5.9% CAGR through 2036 because Dutch nutrition companies operate as the main premix formulation and export hub for Western Europe. Rather than relying only on domestic livestock numbers, premix blenders in Breda and Rotterdam import bulk vitamin K3 actives for heavy-metal testing and export finished premixtures across European markets. April 2026 Hague attaché food processing trade records demonstrate how Dutch processors use port logistics and technical formulation labs to supply value-added ingredients across the European Union. Enforcement of EU Regulation 2026/2115 workplace dust rules is also shifting Dutch blenders toward low-dust granulated MNB.
Key takeaway: In the Netherlands, pan-European premix export blending and EU Regulation 2026/2115 dust compliance are forecast to maintain a 5.9% CAGR.
Germany Menadione Market Outlook (2026 to 2036)
In Germany, market expansion at a 5.8% CAGR through 2036 is shaped by animal-welfare housing reforms that move laying hens and turkeys from cages to floor and barn systems. When poultry flocks forage on floor litter rather than wire flooring, exposure to coccidial parasites increases and raises intestinal bleeding risks. German feed nutritionists respond by raising dietary vitamin K3 safety margins in starter and layer rations to protect flock livability without preventive antibiotics. Statistics in the April 2026 USDA GAIN European Union Grain and Feed Annual report confirm that poultry rations represent 35% of EU compound feed output with Germany acting as a top producer. Strict German occupational safety inspections also favor low-dust vitamin K3 granules.
Key takeaway: In Germany, floor-reared poultry coccidiosis management and workplace dust standards are anticipated to fuel a 5.8% CAGR.
United States Menadione Market Outlook (2026 to 2036)
Unlike European feed mills restricted solely to MSB and MNB, nutritionists in the United States rely heavily on Menadione Dimethylpyrimidinol Bisulfite MPB approved under federal regulation 21 CFR 573.620 for high-heat poultry and swine pelleting. Vertically integrated broiler complexes across the Southeast and hog integrators in the Midwest run high-speed conditioning towers where MPB and MNB retain higher vitamin potency than commodity MSB. In August 2026, Archer Daniels Midland Company reported USD 2,214 million in year-to-date segment operating profit while noting stronger North American animal nutrition premix margins. Although consumer clean-label preferences limit menadione use in retail dog food, commercial livestock rations sustain a 5.7% CAGR across the United States.
Key takeaway: Across the United States, federal MPB formulation flexibility and high-throughput poultry pelleting are estimated to underpin a 5.7% CAGR.
Japan Menadione Market Outlook (2026 to 2036)
Japan records a 5.6% growth pace between 2026 and 2036 as national consumption is driven by intensive marine fish farming and strict quality standards for commercial table eggs. Yellowtail and coho salmon farms in Kyushu and Shikoku feed high-oil extruded pellets that require 10 to 40 mg/kg of heat-stable vitamin K3 to prevent gill bleeding and oxidative liver damage. On land, Japanese egg producers dose vitamin K3 with vitamin D3 to prevent blood spots in eggs and reduce shell breakage on automated packing lines. Figures in the September 2026 USDA GAIN Japan Grain and Feed Update indicate that domestic compound feed mills maintain steady production volumes using imported corn and precision vitamin premixes.
Key takeaway: In Japan, marine finfish extrusion diets and zero-defect egg quality standards are slated to underpin a 5.6% CAGR.
United Kingdom Menadione Market Outlook (2026 to 2036)
Wet autumn harvests across British grain-growing regions create a recurring commercial driver for menadione in the United Kingdom, which expands at a 5.5% CAGR through 2036. Whenever damp storage conditions raise mold toxin levels in domestic feed wheat, poultry veterinarians increase in-feed and drinking-water vitamin K3 dosages to protect blood clotting in broiler flocks. At the same time, Atlantic salmon feed plants in Scotland purchase microencapsulated MNB granules that survive high-pressure extruder barrels. April 2026 London attaché grain and feed projections indicate that British feed wheat production is rebounding to normal levels while livestock mills focus on ration efficiency.
Key takeaway: Across the United Kingdom, mycotoxin-corrective poultry dosing and Scottish salmon feed extrusion are likely to deliver a 5.5% CAGR.
France Menadione Market Outlook (2026 to 2036)
France expands on a 5.2% ten-year rate to 2036 while its large Label Rouge free-range chicken and duck farming sectors create specialized vitamin K3 supplementation needs. Birds raised with outdoor pasture access in Brittany and Pays de la Loire encounter soil parasites and natural plant anticoagulants that increase internal bleeding risks compared with indoor flocks. Consolidation among French poultry integrators is further standardizing premix procurement across regional feed cooperatives. Trade records in the September 2026 USDA GAIN European Union Poultry and Products Annual report note that French poultry leader LDC received regulatory approval in February 2026 to acquire Pierre Martinet and expand its integrated poultry operations.
Key takeaway: In France, free-range poultry parasite protection and processor consolidation are predicted to support a 5.2% CAGR.
Full report country CAGRs cover North America and Latin America with Western Europe and Eastern Europe. Coverage also spans East Asia and South Asia and Pacific with Middle East and Africa.
Who are the notable companies in the menadione market?
dsm-firmenich AG, Archer Daniels Midland Company, Cargill Incorporated, Novonesis (Chr. Hansen Holding A/S), Symrise AG, Givaudan SA, Brother Enterprises Holding Co., Ltd., Oxyvit Kimya San. ve Tic. A.S., Dirox S.A., and Orffa Additives B.V. are the notable companies in the menadione market.
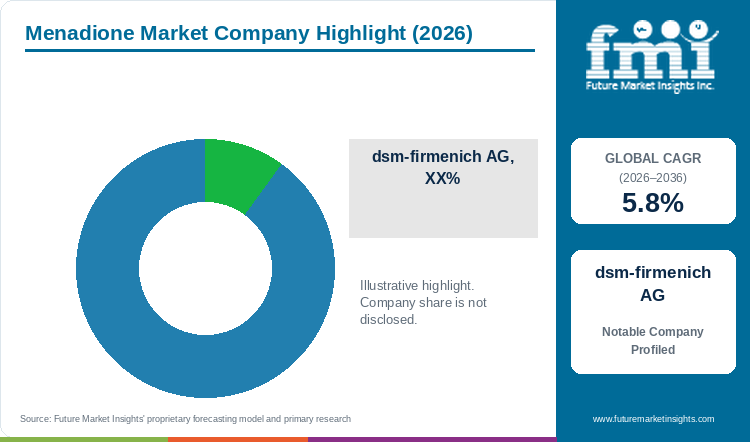
Commercial participation in the menadione market spans upstream naphthoquinone chemical synthesizers and multinational vitamin premix integrators as well as specialized feed bioactive houses. Brother Enterprises Holding Co. and Oxyvit Kimya with Dirox S.A. operate integrated 2-methylnaphthalene oxidation and chromium-coupled vitamin K3 synthesis plants. Meanwhile, dsm-firmenich and Archer Daniels Midland Company with Cargill and Orffa Additives formulate stabilized vitamin K3 premixes. Novonesis and Symrise with Givaudan supply complementary feed enzymes and encapsulated palatability ingredients.
- Primary Vitamin K3 and Naphthoquinone Synthesizers: Brother Enterprises Holding Co. and Oxyvit Kimya with Dirox S.A. manufacture bulk MSB and MNB salts as well as MPB grades integrated with chromium sulfate co-product streams.
- Global Vitamin Premix and Animal Nutrition Integrators: dsm-firmenich AG and Archer Daniels Midland Company with Cargill Incorporated and Orffa Additives B.V. hold EU 3a710/3a711 dossier registrations and operate regional premix blending plants.
- Adjacent Feed Bioactive and Palatability Specialists: Novonesis and Symrise AG with Givaudan SA supply gut-health enzymes and pet-food palatability coatings with encapsulated phytogenics.
Competitive Benchmarking: Menadione Market
Table 8: Competitive Benchmarking for the Menadione Market (qualitative capability ratings), 2026
| Company | Documented Vitamin K3 Activity | Premix Application Support | Pelleting Stability Fit | Geographic Reach |
|---|---|---|---|---|
| dsm-firmenich AG | High | High | High | Global ANH premix network and EU 3a710/3a711 renewal holder |
| Archer Daniels Midland Company | High | High | High | Global animal nutrition labs and EU ADM International dossier holder |
| Cargill Incorporated | High | High | High | Global Provimi premix network; expanded Austria plant in Nov 2025 |
| Brother Enterprises Holding | High | Medium | High | Global MSB, MNB, and MPB synthesis leader based in Zhejiang, China |
| Oxyvit Kimya San. ve Tic. A.S. | High | Medium | High | Mersin, Turkey vitamin K3 synthesizer and EU FEEDAP renewal applicant |
| Dirox S.A. | High | Medium | High | Uruguay synthesis plant supplying K3 salts across the Americas and Europe |
| Orffa Additives B.V. | High | High | High | Breda, Netherlands EU 3a710/3a711 holder supplying Excential premixes |
| Novonesis (Chr. Hansen) | Medium | High | High | Global biosolutions and feed enzyme leader after June 2025 alliance buyout |
| Symrise AG | Medium | High | Medium | Global pet food palatability and functional feed ingredient network |
| Givaudan SA | Medium | Medium | Medium | Global taste, microencapsulation, and functional nutrition matrices |
Evaluation basis: Documented Vitamin K3 Activity evaluates primary synthesis or EU and FDA dossier ownership for MSB and MNB salts, whereas Premix Application Support rates pilot pelleting and feed-mill calibration labs. Thermal Stability Fit measures capability to supply nicotinamide-stabilized or microencapsulated vitamin K3 formats.
Key Developments in the Menadione Market
- dsm-firmenich AG completed the divestment of its 50% stake in the Feed Enzymes Alliance to Novonesis for EUR 1.5 billion on June 2, 2025 to sharpen strategic capital allocation ahead of its animal nutrition separation.
- Cargill Incorporated inaugurated its largest South Asian dairy and livestock feed manufacturing facility in Bathinda, Punjab on February 26, 2026 to expand regional micronutrient and compound feed supply.
- dsm-firmenich Animal Nutrition and Health entered a strategic research partnership with Schothorst Feed Research on October 2, 2025 to advance precision vitamin and feed sustainability trials.
Key Players in the Menadione Market
Primary Vitamin K3 and Naphthoquinone Synthesizers
- Brother Enterprises Holding Co., Ltd.
- Oxyvit Kimya San. ve Tic. A.S.
- Dirox S.A.
- Orffa Additives B.V.
Global Vitamin Premix and Animal Nutrition Integrators
- dsm-firmenich AG
- Archer Daniels Midland Company
- Cargill Incorporated
- Novonesis (Chr. Hansen Holding A/S)
Adjacent Feed Bioactive and Palatability Specialists
- Symrise AG
- Givaudan SA
Menadione Market - Report Scope
Table 9: Report Scope for the Menadione Market (coverage fields and definitions), 2026 to 2036
| Coverage field | Report scope |
|---|---|
| Market breakdown | Chemical Salt Derivative; Physical Format; Target Sector; Feed Grade Specification; Distribution Channel |
| Quantitative Units | USD Million |
| Market Definition | Includes commercial producer and premix formulator valuation from synthetic vitamin K3 salts (menadione sodium bisulfite MSB, menadione nicotinamide bisulfite MNB, menadione dimethylpyrimidinol bisulfite MPB, and menadione sodium bisulfite complex MSBC) and attributable vitamin K3 value in compound feed premixes. Excludes natural fermentation vitamin K2 (MK-7) supplements and human clinical injectables. |
| Regions Covered | North America; Latin America; Western Europe; Eastern Europe; East Asia; South Asia and Pacific; Middle East and Africa |
| Countries Covered | China, Brazil, Netherlands, Germany, United States, Japan, United Kingdom, France, and additional countries in the full report |
| Key Companies Covered | dsm-firmenich AG, Archer Daniels Midland Company, Cargill Incorporated, Novonesis (Chr. Hansen Holding A/S), Symrise AG, Givaudan SA, Brother Enterprises Holding Co., Ltd., Oxyvit Kimya San. ve Tic. A.S., Dirox S.A., Orffa Additives B.V. |
| Forecast Period | 2026 to 2036 |
| Approach | Primary and secondary research with top-down and bottom-up market triangulation. |
Menadione Market - Research Methodology
Table 10: Research Methodology for the Menadione Market (research methods and approach), 2026 edition
| Method | Approach |
|---|---|
| Primary Research | Structured interviews with commercial poultry and swine nutritionists, aquafeed extrusion engineers, naphthoquinone chemical plant directors, and EU FEEDAP regulatory specialists to validate mg/kg inclusion rates and pelleting recovery. |
| Secondary Research | Analysis of European Commission Implementing Regulation (EU) 2026/2115, EFSA FEEDAP Panel scientific opinions, FDA 21 CFR 573.620 feed additive registries, USDA FAS Grain and Feed Annual reports, and peer-reviewed PubMed/PMC trials. |
| Market Sizing and Forecasting | Top-down global feed premix and feed vitamin baselines reconciled against bottom-up fortified compound feed tonnage (1,230M to 1,295M MT in 2026) and active MSB, MNB, and MPB dosage costs per metric ton from 2026 to 2036. |
| Country Forecasting Model | Econometric national projections weight industrial broiler, hog, and aquaculture feed output, mycotoxin incidence, and EU/FDA regulatory compliance gates across eight national markets. |
| Operational Benchmark Traceability | Fortified-feed and feed-mill indicators in Tables 2, 3, and 4 trace to EFSA FEEDAP batch purity assays (98.9% MSB, 97.6% MNB), USDA FAS national feed registries, and published salmonid and poultry dose-response trials. |
| Data Triangulation and Validation | Valuation estimates isolate synthetic 2-methyl-1,4-naphthoquinone derivatives in animal nutrition while strictly excluding bulk carrier limestone, standalone trace minerals, and human dietary phylloquinone. |
Menadione Market by Segments
Menadione Market segmented by Chemical Salt Derivative:
- Menadione Sodium Bisulfite MSB
- Menadione Nicotinamide Bisulfite MNB High Stability
- Menadione Dimethylpyrimidinol Bisulfite MPB
- Menadione Sodium Bisulfite Complex MSBC
Menadione Market segmented by Physical Format:
- Dry Free-Flowing Mineral Premix Powder
- Microencapsulated Coated Granules
- Water-Soluble Dispersible Powder
- Feed-Grade Pelleted Concentrates
Menadione Market segmented by Target Sector:
- Poultry Broiler and Layer Vitamin K3 Feeds
- Swine Piglet and Grow-Finish Diets
- Aquaculture Marine Fish and Shrimp Feeds
- Pet Food Nutritional Premixes
- Ruminant and Specialty Veterinary Feeds
Menadione Market segmented by Feed Grade Specification:
- Standard Feed Grade Minimum 50% Menadione
- High-Stability Low-Chromium MNB Grade
- Veterinary Water-Dispersible Grade
- Companion Animal Compliance Grade
Menadione Market segmented by Distribution Channel:
- Direct to Integrated Feed Mills
- Specialty Premix and Micronutrient Blenders
- Agricultural Veterinary Distributors
- Online B2B Ingredient Platforms
Menadione Market by Region
- North America
- United States
- Canada
- Latin America
- Brazil
- Mexico
- Argentina
- Chile
- Western Europe
- Germany
- France
- United Kingdom
- Italy
- Spain
- Benelux
- Nordics
- Eastern Europe
- Poland
- Czech Republic
- Romania
- Hungary
- East Asia
- China
- Japan
- South Korea
- South Asia and Pacific
- India
- ASEAN
- Australia and New Zealand
- Middle East and Africa
- GCC Countries
- South Africa
- Türkiye
- Israel
Research Sources and Bibliography
- [1] European Commission. (2026, September 24). Commission Implementing Regulation (EU) 2026/2115 of 23 September 2026 concerning the renewal of the authorisation of menadione sodium bisulphite (vitamin K3) and menadione nicotinamide bisulphite (vitamin K3) as feed additives for all animal species and repealing Implementing Regulation (EU) 2015/2307. Official Journal of the European Union, OJ L 2026/2115.
- [2] Cargill Incorporated. (2025, November 4). Cargill Animal Nutrition & Health Increases Micronutrition Production Capacity in Engerwitzdorf, Austria by 50% to 30,000 Metric Tons. Cargill Corporate Newsroom.
- [3] EFSA Panel on Additives and Products or Substances used in Animal Feed (FEEDAP), Villa, R. E., Azimonti, G., Bonos, E., Christensen, H., Durjava, M., Dusemund, B., Gehring, R., Glandorf, B., Kouba, M., Lopez-Alonso, M., Marcon, F., Nebbia, C., Pechova, A., Prieto-Maradona, M., Rohe, I., Theodoridou, K., Ornsrud, R., Galobart, J., & Gkimprixi, E. (2025, December 12). Assessment of the feed additives menadione sodium bisulphite (3a710) and menadione nicotinamide bisulphite (3a711) (vitamin K3) for all animal species for the renewal of their authorisation. EFSA Journal, 23(12), e9792 (PubMed Central PMCID PMC12699196).
- [4] U.S. Food and Drug Administration. (2024, October 24). Vitamin K Substances and Animal Feed: Regulatory Status of Menadione Dimethylpyrimidinol Bisulfite (21 CFR 573.620), MSB, and MSBC. U.S. Department of Health and Human Services, Center for Veterinary Medicine.
- [5] Zhang, H., Wang, L., & Chen, Y. (2026, July 9). Menadione (2-methyl-1,4-naphthoquinone) induces oxidative stress to regulate growth and ochratoxin A biosynthesis in Aspergillus westerdijkiae fc-1. Mycologia, 118(5), 926-933 (PubMed PMID 42423640).
- [6] Gholameipour, M., Khosravinia, H., & Masouri, B. (2026, February 8). Single and combined effects of parenteral vitamins D3, A and K3 administration on tibia morphometry, mineral density and ash content in aged Japanese quails. Poultry Science, 105(5), 106604 (PubMed Central PMCID PMC12934305).
- [7] Gholami-Ahangaran, M., Ahmadi-Dastgerdi, A., & Karimi-Dehkordi, M. (2026, March 14). Stocking density and dietary inclusion of a multi-component vitamin and antioxidant complex in broiler chickens. Veterinary Medicine and Science, 12(2), e70289 (PubMed Central PMCID PMC13594889).
- [8] dsm-firmenich AG. (2026, February 9). dsm-firmenich announces agreement to divest Animal Nutrition & Health to CVC Capital Partners. dsm-firmenich Corporate Press Releases.
- [9] Yilmaz, S., Ergün, S., & Soytas, N. (2025, April 20). Effects of Varying Dietary Concentrations of Menadione Nicotinamide Bisulphite (VK3) on Growth Performance, Muscle Composition, Liver and Muscle Menaquinone-4 Concentration, and Antioxidant Capacities of Coho Salmon (Oncorhynchus kisutch) Alevins. Biology, 14(4), 447 (PubMed Central PMCID PMC12024625).
- [10] Bellinge, J. W., Dalgaard, F., Murray, K., Connolly, E., Blekkenhorst, L. C., Bondonno, C. P., Lewis, J. R., Sim, M., Croft, K. D., Gislason, G., Torp-Pedersen, C., Tjonneland, A., Overvad, K., Hodgson, J. M., Schultz, C. J., & Bondonno, N. P. (2025, June 17). Vitamin K: Metabolism, Genetic Influences, and Chronic Disease Outcomes. Food Science & Nutrition, 13(6), e70431 (PubMed Central PMCID PMC12173841).
- [11] Ghasemi, H. A., Hajkhodadadi, I., & Hafizi, M. (2025, October 18). Performance, digestibility, antioxidant activity, immunity, and zinc bioavailability in broiler chickens fed dietary organic and nanoparticle micronutrients. Poultry Science, 104(12), 105817 (PubMed Central PMCID PMC12581715).
- [12] USDA Foreign Agricultural Service. (2026, March 19). China: Grain and Feed Annual. U.S. Department of Agriculture GAIN Report CH2026-0031.
- [13] USDA Foreign Agricultural Service. (2026, September 15). Brazil: Poultry and Products Annual. U.S. Department of Agriculture GAIN Report BR2026-0037.
- [14] USDA Foreign Agricultural Service. (2026, April 2). Netherlands: Food Processing Ingredients Annual. U.S. Department of Agriculture GAIN Report NL2026-0005.
- [15] USDA Foreign Agricultural Service. (2026, April 20). European Union: Grain and Feed Annual. U.S. Department of Agriculture GAIN Report E42026-0034.
- [16] Archer Daniels Midland Company. (2026, August 4). ADM Reports Second Quarter 2026 Results and Updates Full-Year Guidance. ADM Corporate News Releases.
- [17] USDA Foreign Agricultural Service. (2026, September 30). Japan: Grain and Feed Update. U.S. Department of Agriculture GAIN Report JA2026-0061.
- [18] USDA Foreign Agricultural Service. (2026, April 30). United Kingdom: Grain and Feed Annual. U.S. Department of Agriculture GAIN Report UK2026-0012.
- [19] USDA Foreign Agricultural Service. (2026, September 14). European Union: Poultry and Products Annual. U.S. Department of Agriculture GAIN Report E42026-0072.
- [20] dsm-firmenich AG. (2025, June 2). dsm-firmenich completes sale of its stake in Feed Enzymes Alliance to Novonesis for EUR 1.5 billion. dsm-firmenich Corporate Press Releases.
- [21] Cargill Incorporated. (2026, February 26). Cargill Deepens India Commitment and Opens Largest Dairy Feed Plant in South Asia in Punjab. Cargill Corporate Newsroom.
- [22] dsm-firmenich AG. (2025, October 2). dsm-firmenich Animal Nutrition & Health and Schothorst Feed Research Partner to Advance Sustainability in Animal Nutrition. dsm-firmenich Integrated Annual Report Animal Nutrition & Health.
- [23] Novonesis. (2026, February 25). Novonesis delivered strong organic sales growth of 7% in 2025. Novonesis Corporate Announcements.
- [24] Symrise AG. (2026, April 3). Symrise delivered solid organic sales growth of 2.8% and strong profitability improvement for 2025. Symrise AG Newsroom.
- [25] dsm-firmenich AG. (2026, February 20). dsm-firmenich publishes 2025 Integrated Annual Report. dsm-firmenich Investor Relations.
- [26] Archer Daniels Midland Company. (2026, February 3). ADM Reports Fourth Quarter and Full-Year 2025 Results and Provides 2026 Guidance. ADM Corporate News Releases.
- [27] Givaudan SA. (2026, January 29). 2025 Full Year Results: Strong Financial Performance Across Taste & Wellbeing and Fragrance & Beauty. Givaudan SA Media Releases.
- [28] Symrise AG. (2026, October 28). Symrise delivered strong volume-driven organic sales growth of 5.3% in Q3 2026 and reaffirms full-year outlook. Symrise AG Financial News.
- [29] dsm-firmenich AG. (2026, February 12). dsm-firmenich reports full year 2025 results. dsm-firmenich Corporate News.
- [30] Archer Daniels Midland Company. (2025, November 4). ADM Reports Third Quarter 2025 Financial and Nutrition Segment Results. ADM Corporate News Releases.
- [31] USDA Foreign Agricultural Service. (2026, September 16). European Union: Livestock and Products Annual (Report No. E42026-0075). U.S. Department of Agriculture, Global Agricultural Information Network.
- [32] Novonesis. (2025, November 6). Novonesis delivered 8% organic sales growth in the first nine months of 2025. Novonesis Investor News.
This bibliography is provided for reader reference and is not exhaustive. The full report contains the complete reference list and detailed citations.
This Report Answers
- How large is the menadione market in 2026 and what is forecast for 2036?
- Which biosecurity and mycotoxin pressures support demand for synthetic vitamin K3 salts?
- Why does Menadione Sodium Bisulfite MSB lead the chemical salt derivative category?
- Why does Dry Free-Flowing Mineral Premix Powder lead the physical format category globally?
- How do national growth rates compare between China and Brazil versus the United States?
- Which leading companies synthesize primary menadione salts versus blended feed premixes today?
- What limits unstabilized MSB pelleting recovery or triggers chromium compliance audits?
- What should feed integrators evaluate when switching from commodity MSB to nicotinamide MNB?
Table of Content
- Key Takeaways
- Market Size and CAGR
- Top Growth Driver
- Fastest Growing Segment
- Leading Region
- Key Companies
- Emerging Opportunities
- Executive Summary
- Global Market Outlook
- Demand-side Trends
- Supply-side Trends
- Technology Roadmap Analysis
- Analysis and Recommendations
- Analyst Perspective (What is happening? Why now? What should investors know?)
- Key Questions Answered
- How large is the market?
- What is the CAGR?
- What are key trends?
- Which region dominates?
- Who are the leaders?
Read More...
- Market Overview
- Market Coverage / Taxonomy
- Market Definition / Scope / Limitations
- Research Methodology
- Chapter Orientation
- Analytical Lens and Working Hypotheses
- Market Structure, Signals, and Trend Drivers
- Benchmarking and Cross-market Comparability
- Market Sizing, Forecasting, and Opportunity Mapping
- Research Design and Evidence Framework
- Desk Research Programme (Secondary Evidence)
- Expert Input and Fieldwork (Primary Evidence)
- Tooling, Models, and Reference Databases
- Data Engineering and Model Build
- Quality Assurance and Audit Trail
- Market Background
- Market Dynamics (Drivers, Restraints, Opportunity, Trends)
- Scenario Forecast (Optimistic, Likely, Conservative)
- Impact Analysis
- AI Impact
- Sustainability Impact
- Regulatory Impact
- Technology Impact
- Consumer / Buyer Analysis
- Purchase Drivers
- Adoption Barriers
- Buyer Journey
- Opportunity Map Analysis
- Product Life Cycle Analysis
- Supply Chain Analysis
- Investment Feasibility Matrix
- Value Chain Analysis
- PESTLE and Porter's Analysis
- Regulatory Landscape
- Regional Parent Market Outlook
- Production and Consumption Statistics
- Import and Export Statistics
- Global Market Analysis and Forecast, 2021 to 2036
- Historical Market Size Value (USD Million) Analysis, 2021 to 2025
- Current and Future Market Size Value (USD Million) Projections, 2026 to 2036
- Y-o-Y Growth Trend Analysis
- Absolute $ Opportunity Analysis
- Global Market Pricing Analysis, 2021 to 2036
- Global Market Analysis and Forecast, By Chemical Salt Derivative, 2021 to 2036
- Introduction / Key Findings
- Historical Market Size Value (USD Million) Analysis By Chemical Salt Derivative, 2021 to 2025
- Current and Future Market Size Value (USD Million) Analysis and Forecast By Chemical Salt Derivative, 2026 to 2036
- Menadione Sodium Bisulfite MSB
- Menadione Nicotinamide Bisulfite MNB High Stability
- Menadione Dimethylpyrimidinol Bisulfite MPB
- Menadione Sodium Bisulfite Complex MSBC
- Y-o-Y Growth Trend Analysis By Chemical Salt Derivative, 2021 to 2025
- Absolute $ Opportunity Analysis By Chemical Salt Derivative, 2026 to 2036
- Global Market Analysis and Forecast, By Physical Format, 2021 to 2036
- Introduction / Key Findings
- Historical Market Size Value (USD Million) Analysis By Physical Format, 2021 to 2025
- Current and Future Market Size Value (USD Million) Analysis and Forecast By Physical Format, 2026 to 2036
- Dry Free-Flowing Mineral Premix Powder
- Microencapsulated Coated Granules
- Water-Soluble Dispersible Powder
- Feed-Grade Pelleted Concentrates
- Y-o-Y Growth Trend Analysis By Physical Format, 2021 to 2025
- Absolute $ Opportunity Analysis By Physical Format, 2026 to 2036
- Global Market Analysis and Forecast, By Target Sector, 2021 to 2036
- Introduction / Key Findings
- Historical Market Size Value (USD Million) Analysis By Target Sector, 2021 to 2025
- Current and Future Market Size Value (USD Million) Analysis and Forecast By Target Sector, 2026 to 2036
- Poultry Broiler and Layer Vitamin K3 Feeds
- Swine Piglet and Grow-Finish Diets
- Aquaculture Marine Fish and Shrimp Feeds
- Pet Food Nutritional Premixes
- Ruminant and Specialty Veterinary Feeds
- Y-o-Y Growth Trend Analysis By Target Sector, 2021 to 2025
- Absolute $ Opportunity Analysis By Target Sector, 2026 to 2036
- Global Market Analysis and Forecast, By Feed Grade Specification, 2021 to 2036
- Introduction / Key Findings
- Historical Market Size Value (USD Million) Analysis By Feed Grade Specification, 2021 to 2025
- Current and Future Market Size Value (USD Million) Analysis and Forecast By Feed Grade Specification, 2026 to 2036
- Standard Feed Grade Minimum 50% Menadione
- High-Stability Low-Chromium MNB Grade
- Veterinary Water-Dispersible Grade
- Companion Animal Compliance Grade
- Y-o-Y Growth Trend Analysis By Feed Grade Specification, 2021 to 2025
- Absolute $ Opportunity Analysis By Feed Grade Specification, 2026 to 2036
- Global Market Analysis and Forecast, By Distribution Channel, 2021 to 2036
- Introduction / Key Findings
- Historical Market Size Value (USD Million) Analysis By Distribution Channel, 2021 to 2025
- Current and Future Market Size Value (USD Million) Analysis and Forecast By Distribution Channel, 2026 to 2036
- Direct to Integrated Feed Mills
- Specialty Premix and Micronutrient Blenders
- Agricultural Veterinary Distributors
- Online B2B Ingredient Platforms
- Y-o-Y Growth Trend Analysis By Distribution Channel, 2021 to 2025
- Absolute $ Opportunity Analysis By Distribution Channel, 2026 to 2036
- Global Market Analysis and Forecast, By Region, 2021 to 2036
- Introduction
- Historical Market Size Value (USD Million) Analysis By Region, 2021 to 2025
- Current Market Size Value (USD Million) Analysis and Forecast By Region, 2026 to 2036
- North America
- Latin America
- Western Europe
- Eastern Europe
- East Asia
- South Asia and Pacific
- Middle East and Africa
- Market Attractiveness Analysis By Region
- North America Market Analysis and Forecast, By Country, 2021 to 2036
- Historical Market Size Value (USD Million) Trend Analysis By Market Taxonomy, 2021 to 2025
- Market Size Value (USD Million) Forecast By Market Taxonomy, 2026 to 2036
- By Country
- United States
- Canada
- By Chemical Salt Derivative
- By Physical Format
- By Target Sector
- By Feed Grade Specification
- By Distribution Channel
- By Country
- Market Attractiveness Analysis
- By Country
- By Chemical Salt Derivative
- By Physical Format
- By Target Sector
- By Feed Grade Specification
- By Distribution Channel
- Key Takeaways
- Latin America Market Analysis and Forecast, By Country
- Historical Market Size Value (USD Million) Trend Analysis By Market Taxonomy, 2021 to 2025
- Market Size Value (USD Million) Forecast By Market Taxonomy, 2026 to 2036
- By Country
- Brazil
- Mexico
- Argentina
- Chile
- By Chemical Salt Derivative
- By Physical Format
- By Target Sector
- By Feed Grade Specification
- By Distribution Channel
- By Country
- Market Attractiveness Analysis
- By Country
- By Chemical Salt Derivative
- By Physical Format
- By Target Sector
- By Feed Grade Specification
- By Distribution Channel
- Key Takeaways
- Western Europe Market Analysis and Forecast, By Country
- Historical Market Size Value (USD Million) Trend Analysis By Market Taxonomy, 2021 to 2025
- Market Size Value (USD Million) Forecast By Market Taxonomy, 2026 to 2036
- By Country
- Germany
- France
- United Kingdom
- Italy
- Spain
- Benelux
- Nordics
- By Chemical Salt Derivative
- By Physical Format
- By Target Sector
- By Feed Grade Specification
- By Distribution Channel
- By Country
- Market Attractiveness Analysis
- By Country
- By Chemical Salt Derivative
- By Physical Format
- By Target Sector
- By Feed Grade Specification
- By Distribution Channel
- Key Takeaways
- Eastern Europe Market Analysis and Forecast, By Country
- Historical Market Size Value (USD Million) Trend Analysis By Market Taxonomy, 2021 to 2025
- Market Size Value (USD Million) Forecast By Market Taxonomy, 2026 to 2036
- By Country
- Poland
- Czech Republic
- Romania
- Hungary
- By Chemical Salt Derivative
- By Physical Format
- By Target Sector
- By Feed Grade Specification
- By Distribution Channel
- By Country
- Market Attractiveness Analysis
- By Country
- By Chemical Salt Derivative
- By Physical Format
- By Target Sector
- By Feed Grade Specification
- By Distribution Channel
- Key Takeaways
- East Asia Market Analysis and Forecast, By Country
- Historical Market Size Value (USD Million) Trend Analysis By Market Taxonomy, 2021 to 2025
- Market Size Value (USD Million) Forecast By Market Taxonomy, 2026 to 2036
- By Country
- China
- Japan
- South Korea
- By Chemical Salt Derivative
- By Physical Format
- By Target Sector
- By Feed Grade Specification
- By Distribution Channel
- By Country
- Market Attractiveness Analysis
- By Country
- By Chemical Salt Derivative
- By Physical Format
- By Target Sector
- By Feed Grade Specification
- By Distribution Channel
- Key Takeaways
- South Asia and Pacific Market Analysis and Forecast, By Country
- Historical Market Size Value (USD Million) Trend Analysis By Market Taxonomy, 2021 to 2025
- Market Size Value (USD Million) Forecast By Market Taxonomy, 2026 to 2036
- By Country
- India
- ASEAN
- Australia and New Zealand
- By Chemical Salt Derivative
- By Physical Format
- By Target Sector
- By Feed Grade Specification
- By Distribution Channel
- By Country
- Market Attractiveness Analysis
- By Country
- By Chemical Salt Derivative
- By Physical Format
- By Target Sector
- By Feed Grade Specification
- By Distribution Channel
- Key Takeaways
- Middle East and Africa Market Analysis and Forecast, By Country
- Historical Market Size Value (USD Million) Trend Analysis By Market Taxonomy, 2021 to 2025
- Market Size Value (USD Million) Forecast By Market Taxonomy, 2026 to 2036
- By Country
- GCC Countries
- South Africa
- Türkiye
- Israel
- By Chemical Salt Derivative
- By Physical Format
- By Target Sector
- By Feed Grade Specification
- By Distribution Channel
- By Country
- Market Attractiveness Analysis
- By Country
- By Chemical Salt Derivative
- By Physical Format
- By Target Sector
- By Feed Grade Specification
- By Distribution Channel
- Key Takeaways
- Key Countries Market Analysis
- United States
- Pricing Analysis
- Market Share Analysis, 2025
- By Chemical Salt Derivative
- By Physical Format
- By Target Sector
- By Feed Grade Specification
- By Distribution Channel
- Canada
- Pricing Analysis
- Market Share Analysis, 2025
- By Chemical Salt Derivative
- By Physical Format
- By Target Sector
- By Feed Grade Specification
- By Distribution Channel
- Mexico
- Pricing Analysis
- Market Share Analysis, 2025
- By Chemical Salt Derivative
- By Physical Format
- By Target Sector
- By Feed Grade Specification
- By Distribution Channel
- Brazil
- Pricing Analysis
- Market Share Analysis, 2025
- By Chemical Salt Derivative
- By Physical Format
- By Target Sector
- By Feed Grade Specification
- By Distribution Channel
- Chile
- Pricing Analysis
- Market Share Analysis, 2025
- By Chemical Salt Derivative
- By Physical Format
- By Target Sector
- By Feed Grade Specification
- By Distribution Channel
- Germany
- Pricing Analysis
- Market Share Analysis, 2025
- By Chemical Salt Derivative
- By Physical Format
- By Target Sector
- By Feed Grade Specification
- By Distribution Channel
- United Kingdom
- Pricing Analysis
- Market Share Analysis, 2025
- By Chemical Salt Derivative
- By Physical Format
- By Target Sector
- By Feed Grade Specification
- By Distribution Channel
- Italy
- Pricing Analysis
- Market Share Analysis, 2025
- By Chemical Salt Derivative
- By Physical Format
- By Target Sector
- By Feed Grade Specification
- By Distribution Channel
- Spain
- Pricing Analysis
- Market Share Analysis, 2025
- By Chemical Salt Derivative
- By Physical Format
- By Target Sector
- By Feed Grade Specification
- By Distribution Channel
- France
- Pricing Analysis
- Market Share Analysis, 2025
- By Chemical Salt Derivative
- By Physical Format
- By Target Sector
- By Feed Grade Specification
- By Distribution Channel
- India
- Pricing Analysis
- Market Share Analysis, 2025
- By Chemical Salt Derivative
- By Physical Format
- By Target Sector
- By Feed Grade Specification
- By Distribution Channel
- ASEAN
- Pricing Analysis
- Market Share Analysis, 2025
- By Chemical Salt Derivative
- By Physical Format
- By Target Sector
- By Feed Grade Specification
- By Distribution Channel
- Australia and New Zealand
- Pricing Analysis
- Market Share Analysis, 2025
- By Chemical Salt Derivative
- By Physical Format
- By Target Sector
- By Feed Grade Specification
- By Distribution Channel
- China
- Pricing Analysis
- Market Share Analysis, 2025
- By Chemical Salt Derivative
- By Physical Format
- By Target Sector
- By Feed Grade Specification
- By Distribution Channel
- Japan
- Pricing Analysis
- Market Share Analysis, 2025
- By Chemical Salt Derivative
- By Physical Format
- By Target Sector
- By Feed Grade Specification
- By Distribution Channel
- South Korea
- Pricing Analysis
- Market Share Analysis, 2025
- By Chemical Salt Derivative
- By Physical Format
- By Target Sector
- By Feed Grade Specification
- By Distribution Channel
- Poland
- Pricing Analysis
- Market Share Analysis, 2025
- By Chemical Salt Derivative
- By Physical Format
- By Target Sector
- By Feed Grade Specification
- By Distribution Channel
- Hungary
- Pricing Analysis
- Market Share Analysis, 2025
- By Chemical Salt Derivative
- By Physical Format
- By Target Sector
- By Feed Grade Specification
- By Distribution Channel
- Türkiye
- Pricing Analysis
- Market Share Analysis, 2025
- By Chemical Salt Derivative
- By Physical Format
- By Target Sector
- By Feed Grade Specification
- By Distribution Channel
- South Africa
- Pricing Analysis
- Market Share Analysis, 2025
- By Chemical Salt Derivative
- By Physical Format
- By Target Sector
- By Feed Grade Specification
- By Distribution Channel
- Netherlands
- Pricing Analysis
- Market Share Analysis, 2025
- By Chemical Salt Derivative
- By Physical Format
- By Target Sector
- By Feed Grade Specification
- By Distribution Channel
- United States
- Market Structure Analysis
- Competition Dashboard
- Competition Benchmarking
- Market Share Analysis of Top Players
- By Regional
- By Chemical Salt Derivative
- By Physical Format
- By Target Sector
- By Feed Grade Specification
- By Distribution Channel
- Emerging Startups
- Innovation Benchmarking
- Competition Analysis
- Competition Deep Dive
- dsm-firmenich AG
- Overview
- Product Portfolio
- Profitability by Market Segments
- Sales Footprint
- Strategy Overview
- Marketing Strategy
- Product Strategy
- Channel Strategy
- Archer Daniels Midland Company
- Cargill Incorporated
- Brother Enterprises Holding
- Oxyvit Kimya San. ve Tic. A.S.
- Dirox S.A.
- Orffa Additives B.V.
- Novonesis (Chr. Hansen)
- Symrise AG
- Givaudan SA
- Brother Enterprises Holding Co., Ltd.
- Novonesis (Chr. Hansen Holding A/S)
- dsm-firmenich AG
- Case Studies
- Success Stories
- Recent Developments
- Competition Deep Dive
- Assumptions & Acronyms Used
List of Tables
- Table 1: Global Market Value (USD Million) Forecast by Region, 2021 to 2036
- Table 2: Global Market Value (USD Million) Forecast by Chemical Salt Derivative, 2021 to 2036
- Table 3: Global Market Value (USD Million) Forecast by Physical Format, 2021 to 2036
- Table 4: Global Market Value (USD Million) Forecast by Target Sector, 2021 to 2036
- Table 5: Global Market Value (USD Million) Forecast by Feed Grade Specification, 2021 to 2036
- Table 6: Global Market Value (USD Million) Forecast by Distribution Channel, 2021 to 2036
- Table 7: North America Market Value (USD Million) Forecast by Country, 2021 to 2036
- Table 8: North America Market Value (USD Million) Forecast by Chemical Salt Derivative, 2021 to 2036
- Table 9: North America Market Value (USD Million) Forecast by Physical Format, 2021 to 2036
- Table 10: North America Market Value (USD Million) Forecast by Target Sector, 2021 to 2036
- Table 11: North America Market Value (USD Million) Forecast by Feed Grade Specification, 2021 to 2036
- Table 12: North America Market Value (USD Million) Forecast by Distribution Channel, 2021 to 2036
- Table 13: Latin America Market Value (USD Million) Forecast by Country, 2021 to 2036
- Table 14: Latin America Market Value (USD Million) Forecast by Chemical Salt Derivative, 2021 to 2036
- Table 15: Latin America Market Value (USD Million) Forecast by Physical Format, 2021 to 2036
- Table 16: Latin America Market Value (USD Million) Forecast by Target Sector, 2021 to 2036
- Table 17: Latin America Market Value (USD Million) Forecast by Feed Grade Specification, 2021 to 2036
- Table 18: Latin America Market Value (USD Million) Forecast by Distribution Channel, 2021 to 2036
- Table 19: Western Europe Market Value (USD Million) Forecast by Country, 2021 to 2036
- Table 20: Western Europe Market Value (USD Million) Forecast by Chemical Salt Derivative, 2021 to 2036
- Table 21: Western Europe Market Value (USD Million) Forecast by Physical Format, 2021 to 2036
- Table 22: Western Europe Market Value (USD Million) Forecast by Target Sector, 2021 to 2036
- Table 23: Western Europe Market Value (USD Million) Forecast by Feed Grade Specification, 2021 to 2036
- Table 24: Western Europe Market Value (USD Million) Forecast by Distribution Channel, 2021 to 2036
- Table 25: Eastern Europe Market Value (USD Million) Forecast by Country, 2021 to 2036
- Table 26: Eastern Europe Market Value (USD Million) Forecast by Chemical Salt Derivative, 2021 to 2036
- Table 27: Eastern Europe Market Value (USD Million) Forecast by Physical Format, 2021 to 2036
- Table 28: Eastern Europe Market Value (USD Million) Forecast by Target Sector, 2021 to 2036
- Table 29: Eastern Europe Market Value (USD Million) Forecast by Feed Grade Specification, 2021 to 2036
- Table 30: Eastern Europe Market Value (USD Million) Forecast by Distribution Channel, 2021 to 2036
- Table 31: East Asia Market Value (USD Million) Forecast by Country, 2021 to 2036
- Table 32: East Asia Market Value (USD Million) Forecast by Chemical Salt Derivative, 2021 to 2036
- Table 33: East Asia Market Value (USD Million) Forecast by Physical Format, 2021 to 2036
- Table 34: East Asia Market Value (USD Million) Forecast by Target Sector, 2021 to 2036
- Table 35: East Asia Market Value (USD Million) Forecast by Feed Grade Specification, 2021 to 2036
- Table 36: East Asia Market Value (USD Million) Forecast by Distribution Channel, 2021 to 2036
- Table 37: South Asia and Pacific Market Value (USD Million) Forecast by Country, 2021 to 2036
- Table 38: South Asia and Pacific Market Value (USD Million) Forecast by Chemical Salt Derivative, 2021 to 2036
- Table 39: South Asia and Pacific Market Value (USD Million) Forecast by Physical Format, 2021 to 2036
- Table 40: South Asia and Pacific Market Value (USD Million) Forecast by Target Sector, 2021 to 2036
- Table 41: South Asia and Pacific Market Value (USD Million) Forecast by Feed Grade Specification, 2021 to 2036
- Table 42: South Asia and Pacific Market Value (USD Million) Forecast by Distribution Channel, 2021 to 2036
- Table 43: Middle East and Africa Market Value (USD Million) Forecast by Country, 2021 to 2036
- Table 44: Middle East and Africa Market Value (USD Million) Forecast by Chemical Salt Derivative, 2021 to 2036
- Table 45: Middle East and Africa Market Value (USD Million) Forecast by Physical Format, 2021 to 2036
- Table 46: Middle East and Africa Market Value (USD Million) Forecast by Target Sector, 2021 to 2036
- Table 47: Middle East and Africa Market Value (USD Million) Forecast by Feed Grade Specification, 2021 to 2036
- Table 48: Middle East and Africa Market Value (USD Million) Forecast by Distribution Channel, 2021 to 2036
List of Figures
- Figure 1: Global Market Pricing Analysis
- Figure 2: Global Market Value (USD Million) Forecast 2021-2036
- Figure 3: Global Market Value Share and BPS Analysis by Chemical Salt Derivative, 2026 and 2036
- Figure 4: Global Market Y-o-Y Growth Comparison by Chemical Salt Derivative, 2026-2036
- Figure 5: Global Market Attractiveness Analysis by Chemical Salt Derivative
- Figure 6: Global Market Value Share and BPS Analysis by Physical Format, 2026 and 2036
- Figure 7: Global Market Y-o-Y Growth Comparison by Physical Format, 2026-2036
- Figure 8: Global Market Attractiveness Analysis by Physical Format
- Figure 9: Global Market Value Share and BPS Analysis by Target Sector, 2026 and 2036
- Figure 10: Global Market Y-o-Y Growth Comparison by Target Sector, 2026-2036
- Figure 11: Global Market Attractiveness Analysis by Target Sector
- Figure 12: Global Market Value Share and BPS Analysis by Feed Grade Specification, 2026 and 2036
- Figure 13: Global Market Y-o-Y Growth Comparison by Feed Grade Specification, 2026-2036
- Figure 14: Global Market Attractiveness Analysis by Feed Grade Specification
- Figure 15: Global Market Value Share and BPS Analysis by Distribution Channel, 2026 and 2036
- Figure 16: Global Market Y-o-Y Growth Comparison by Distribution Channel, 2026-2036
- Figure 17: Global Market Attractiveness Analysis by Distribution Channel
- Figure 18: Global Market Value (USD Million) Share and BPS Analysis by Region, 2026 and 2036
- Figure 19: Global Market Y-o-Y Growth Comparison by Region, 2026-2036
- Figure 20: Global Market Attractiveness Analysis by Region
- Figure 21: North America Market Incremental Dollar Opportunity, 2026-2036
- Figure 22: Latin America Market Incremental Dollar Opportunity, 2026-2036
- Figure 23: Western Europe Market Incremental Dollar Opportunity, 2026-2036
- Figure 24: Eastern Europe Market Incremental Dollar Opportunity, 2026-2036
- Figure 25: East Asia Market Incremental Dollar Opportunity, 2026-2036
- Figure 26: South Asia and Pacific Market Incremental Dollar Opportunity, 2026-2036
- Figure 27: Middle East and Africa Market Incremental Dollar Opportunity, 2026-2036
- Figure 28: North America Market Value Share and BPS Analysis by Country, 2026 and 2036
- Figure 29: North America Market Value Share and BPS Analysis by Chemical Salt Derivative, 2026 and 2036
- Figure 30: North America Market Y-o-Y Growth Comparison by Chemical Salt Derivative, 2026-2036
- Figure 31: North America Market Attractiveness Analysis by Chemical Salt Derivative
- Figure 32: North America Market Value Share and BPS Analysis by Physical Format, 2026 and 2036
- Figure 33: North America Market Y-o-Y Growth Comparison by Physical Format, 2026-2036
- Figure 34: North America Market Attractiveness Analysis by Physical Format
- Figure 35: North America Market Value Share and BPS Analysis by Target Sector, 2026 and 2036
- Figure 36: North America Market Y-o-Y Growth Comparison by Target Sector, 2026-2036
- Figure 37: North America Market Attractiveness Analysis by Target Sector
- Figure 38: North America Market Value Share and BPS Analysis by Feed Grade Specification, 2026 and 2036
- Figure 39: North America Market Y-o-Y Growth Comparison by Feed Grade Specification, 2026-2036
- Figure 40: North America Market Attractiveness Analysis by Feed Grade Specification
- Figure 41: North America Market Value Share and BPS Analysis by Distribution Channel, 2026 and 2036
- Figure 42: North America Market Y-o-Y Growth Comparison by Distribution Channel, 2026-2036
- Figure 43: North America Market Attractiveness Analysis by Distribution Channel
- Figure 44: Latin America Market Value Share and BPS Analysis by Country, 2026 and 2036
- Figure 45: Latin America Market Value Share and BPS Analysis by Chemical Salt Derivative, 2026 and 2036
- Figure 46: Latin America Market Y-o-Y Growth Comparison by Chemical Salt Derivative, 2026-2036
- Figure 47: Latin America Market Attractiveness Analysis by Chemical Salt Derivative
- Figure 48: Latin America Market Value Share and BPS Analysis by Physical Format, 2026 and 2036
- Figure 49: Latin America Market Y-o-Y Growth Comparison by Physical Format, 2026-2036
- Figure 50: Latin America Market Attractiveness Analysis by Physical Format
- Figure 51: Latin America Market Value Share and BPS Analysis by Target Sector, 2026 and 2036
- Figure 52: Latin America Market Y-o-Y Growth Comparison by Target Sector, 2026-2036
- Figure 53: Latin America Market Attractiveness Analysis by Target Sector
- Figure 54: Latin America Market Value Share and BPS Analysis by Feed Grade Specification, 2026 and 2036
- Figure 55: Latin America Market Y-o-Y Growth Comparison by Feed Grade Specification, 2026-2036
- Figure 56: Latin America Market Attractiveness Analysis by Feed Grade Specification
- Figure 57: Latin America Market Value Share and BPS Analysis by Distribution Channel, 2026 and 2036
- Figure 58: Latin America Market Y-o-Y Growth Comparison by Distribution Channel, 2026-2036
- Figure 59: Latin America Market Attractiveness Analysis by Distribution Channel
- Figure 60: Western Europe Market Value Share and BPS Analysis by Country, 2026 and 2036
- Figure 61: Western Europe Market Value Share and BPS Analysis by Chemical Salt Derivative, 2026 and 2036
- Figure 62: Western Europe Market Y-o-Y Growth Comparison by Chemical Salt Derivative, 2026-2036
- Figure 63: Western Europe Market Attractiveness Analysis by Chemical Salt Derivative
- Figure 64: Western Europe Market Value Share and BPS Analysis by Physical Format, 2026 and 2036
- Figure 65: Western Europe Market Y-o-Y Growth Comparison by Physical Format, 2026-2036
- Figure 66: Western Europe Market Attractiveness Analysis by Physical Format
- Figure 67: Western Europe Market Value Share and BPS Analysis by Target Sector, 2026 and 2036
- Figure 68: Western Europe Market Y-o-Y Growth Comparison by Target Sector, 2026-2036
- Figure 69: Western Europe Market Attractiveness Analysis by Target Sector
- Figure 70: Western Europe Market Value Share and BPS Analysis by Feed Grade Specification, 2026 and 2036
- Figure 71: Western Europe Market Y-o-Y Growth Comparison by Feed Grade Specification, 2026-2036
- Figure 72: Western Europe Market Attractiveness Analysis by Feed Grade Specification
- Figure 73: Western Europe Market Value Share and BPS Analysis by Distribution Channel, 2026 and 2036
- Figure 74: Western Europe Market Y-o-Y Growth Comparison by Distribution Channel, 2026-2036
- Figure 75: Western Europe Market Attractiveness Analysis by Distribution Channel
- Figure 76: Eastern Europe Market Value Share and BPS Analysis by Country, 2026 and 2036
- Figure 77: Eastern Europe Market Value Share and BPS Analysis by Chemical Salt Derivative, 2026 and 2036
- Figure 78: Eastern Europe Market Y-o-Y Growth Comparison by Chemical Salt Derivative, 2026-2036
- Figure 79: Eastern Europe Market Attractiveness Analysis by Chemical Salt Derivative
- Figure 80: Eastern Europe Market Value Share and BPS Analysis by Physical Format, 2026 and 2036
- Figure 81: Eastern Europe Market Y-o-Y Growth Comparison by Physical Format, 2026-2036
- Figure 82: Eastern Europe Market Attractiveness Analysis by Physical Format
- Figure 83: Eastern Europe Market Value Share and BPS Analysis by Target Sector, 2026 and 2036
- Figure 84: Eastern Europe Market Y-o-Y Growth Comparison by Target Sector, 2026-2036
- Figure 85: Eastern Europe Market Attractiveness Analysis by Target Sector
- Figure 86: Eastern Europe Market Value Share and BPS Analysis by Feed Grade Specification, 2026 and 2036
- Figure 87: Eastern Europe Market Y-o-Y Growth Comparison by Feed Grade Specification, 2026-2036
- Figure 88: Eastern Europe Market Attractiveness Analysis by Feed Grade Specification
- Figure 89: Eastern Europe Market Value Share and BPS Analysis by Distribution Channel, 2026 and 2036
- Figure 90: Eastern Europe Market Y-o-Y Growth Comparison by Distribution Channel, 2026-2036
- Figure 91: Eastern Europe Market Attractiveness Analysis by Distribution Channel
- Figure 92: East Asia Market Value Share and BPS Analysis by Country, 2026 and 2036
- Figure 93: East Asia Market Value Share and BPS Analysis by Chemical Salt Derivative, 2026 and 2036
- Figure 94: East Asia Market Y-o-Y Growth Comparison by Chemical Salt Derivative, 2026-2036
- Figure 95: East Asia Market Attractiveness Analysis by Chemical Salt Derivative
- Figure 96: East Asia Market Value Share and BPS Analysis by Physical Format, 2026 and 2036
- Figure 97: East Asia Market Y-o-Y Growth Comparison by Physical Format, 2026-2036
- Figure 98: East Asia Market Attractiveness Analysis by Physical Format
- Figure 99: East Asia Market Value Share and BPS Analysis by Target Sector, 2026 and 2036
- Figure 100: East Asia Market Y-o-Y Growth Comparison by Target Sector, 2026-2036
- Figure 101: East Asia Market Attractiveness Analysis by Target Sector
- Figure 102: East Asia Market Value Share and BPS Analysis by Feed Grade Specification, 2026 and 2036
- Figure 103: East Asia Market Y-o-Y Growth Comparison by Feed Grade Specification, 2026-2036
- Figure 104: East Asia Market Attractiveness Analysis by Feed Grade Specification
- Figure 105: East Asia Market Value Share and BPS Analysis by Distribution Channel, 2026 and 2036
- Figure 106: East Asia Market Y-o-Y Growth Comparison by Distribution Channel, 2026-2036
- Figure 107: East Asia Market Attractiveness Analysis by Distribution Channel
- Figure 108: South Asia and Pacific Market Value Share and BPS Analysis by Country, 2026 and 2036
- Figure 109: South Asia and Pacific Market Value Share and BPS Analysis by Chemical Salt Derivative, 2026 and 2036
- Figure 110: South Asia and Pacific Market Y-o-Y Growth Comparison by Chemical Salt Derivative, 2026-2036
- Figure 111: South Asia and Pacific Market Attractiveness Analysis by Chemical Salt Derivative
- Figure 112: South Asia and Pacific Market Value Share and BPS Analysis by Physical Format, 2026 and 2036
- Figure 113: South Asia and Pacific Market Y-o-Y Growth Comparison by Physical Format, 2026-2036
- Figure 114: South Asia and Pacific Market Attractiveness Analysis by Physical Format
- Figure 115: South Asia and Pacific Market Value Share and BPS Analysis by Target Sector, 2026 and 2036
- Figure 116: South Asia and Pacific Market Y-o-Y Growth Comparison by Target Sector, 2026-2036
- Figure 117: South Asia and Pacific Market Attractiveness Analysis by Target Sector
- Figure 118: South Asia and Pacific Market Value Share and BPS Analysis by Feed Grade Specification, 2026 and 2036
- Figure 119: South Asia and Pacific Market Y-o-Y Growth Comparison by Feed Grade Specification, 2026-2036
- Figure 120: South Asia and Pacific Market Attractiveness Analysis by Feed Grade Specification
- Figure 121: South Asia and Pacific Market Value Share and BPS Analysis by Distribution Channel, 2026 and 2036
- Figure 122: South Asia and Pacific Market Y-o-Y Growth Comparison by Distribution Channel, 2026-2036
- Figure 123: South Asia and Pacific Market Attractiveness Analysis by Distribution Channel
- Figure 124: Middle East and Africa Market Value Share and BPS Analysis by Country, 2026 and 2036
- Figure 125: Middle East and Africa Market Value Share and BPS Analysis by Chemical Salt Derivative, 2026 and 2036
- Figure 126: Middle East and Africa Market Y-o-Y Growth Comparison by Chemical Salt Derivative, 2026-2036
- Figure 127: Middle East and Africa Market Attractiveness Analysis by Chemical Salt Derivative
- Figure 128: Middle East and Africa Market Value Share and BPS Analysis by Physical Format, 2026 and 2036
- Figure 129: Middle East and Africa Market Y-o-Y Growth Comparison by Physical Format, 2026-2036
- Figure 130: Middle East and Africa Market Attractiveness Analysis by Physical Format
- Figure 131: Middle East and Africa Market Value Share and BPS Analysis by Target Sector, 2026 and 2036
- Figure 132: Middle East and Africa Market Y-o-Y Growth Comparison by Target Sector, 2026-2036
- Figure 133: Middle East and Africa Market Attractiveness Analysis by Target Sector
- Figure 134: Middle East and Africa Market Value Share and BPS Analysis by Feed Grade Specification, 2026 and 2036
- Figure 135: Middle East and Africa Market Y-o-Y Growth Comparison by Feed Grade Specification, 2026-2036
- Figure 136: Middle East and Africa Market Attractiveness Analysis by Feed Grade Specification
- Figure 137: Middle East and Africa Market Value Share and BPS Analysis by Distribution Channel, 2026 and 2036
- Figure 138: Middle East and Africa Market Y-o-Y Growth Comparison by Distribution Channel, 2026-2036
- Figure 139: Middle East and Africa Market Attractiveness Analysis by Distribution Channel
- Figure 140: Global Market - Tier Structure Analysis
- Figure 141: Global Market - Company Share Analysis
Frequently Asked Questions
How big is the menadione market in 2026, and what is forecast for 2036?
In 2025, global menadione valuation registered USD 148.0 million before advancing in 2026 to USD 156.2 million. Total market size will climb in 2036 to USD 274.5 million while poultry and swine integrators standardize vitamin K3 fortification.
What is the CAGR for the menadione market from 2026 to 2036?
Global menadione demand advances at a 5.8% ten-year CAGR through 2036, generating USD 118.3 million in incremental market value across compound feed and premix mills.
Which chemical salt derivative segment leads the menadione market?
Menadione Sodium Bisulfite MSB holds 40.8% of chemical salt derivative demand in 2026 because its minimum 50.0% menadione equivalence and rapid water solubility minimize unit dosing costs.
Which physical format segment leads the menadione market?
Dry Free-Flowing Mineral Premix Powder captures 61.2% within physical formats in 2026 as dry crystalline carriers integrate directly into automated feed mill micro-dosing bins.
Which country has a notable growth outlook during the assessment period?
China paces national growth rankings recording a 6.3% rate through 2036, reinforced by domestic naphthoquinone synthesis scale and industrial hog and aquaculture feed consolidation.
Who are the key players in the market?
Brother Enterprises and Oxyvit Kimya with Dirox S.A. and Orffa Additives lead chemical synthesis and dossier supply. Meanwhile, dsm-firmenich and Archer Daniels Midland Company with Cargill Incorporated and Novonesis anchor global premix blending, while Symrise AG and Givaudan SA supply palatability and encapsulation systems.
Preview the report firsthand - request a free sample
Get SampleGet the brochure for pricing and purchase details.
Get PDF
