
- Market Size (2026)
- USD 675.0 Mn
- Forecast (2036)
- USD 1153.0 Mn
- CAGR (2026 to 2036)
- 5.5%
How big is Synephrine Market in 2026?
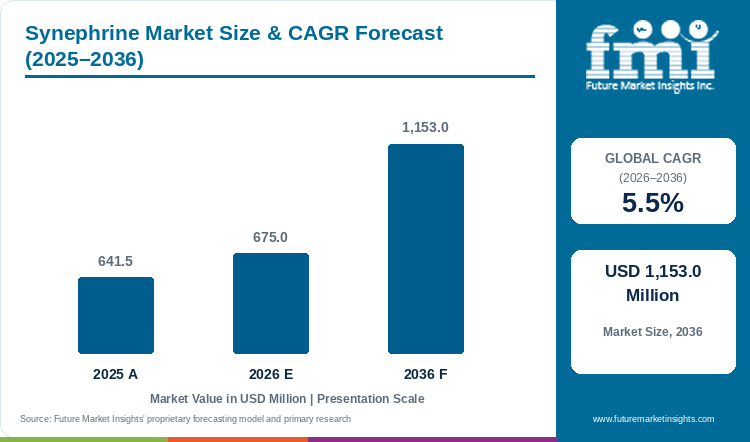
With a valuation of USD 641.5 million in 2025 and moving to USD 675.0 million in 2026, the synephrine market is positioned to attain USD 1,153.0 million by 2036, exhibiting a CAGR of 5.5%.
The global synephrine market was valued at USD 641.5 million in 2025 and is estimated to reach USD 675.0 million in 2026. The market is projected to reach USD 1,153.0 million by 2036, expanding at a compound annual growth rate (CAGR) of 5.5% between 2026 and 2036. Bitter orange Citrus aurantium unripe fruit extract holds an estimated 59.0% share of 2026 demand because dietary supplement rules in North America and Europe require natural botanical extraction over synthetic chemical salts. Demand for standardized bitter orange extracts comes from gym consumers and dieters seeking mild metabolic calorie burning at 20 mg to 50 mg oral doses without blood-pressure spikes. Those strict daily milligram limits separate the niche from dietary supplement formulations at 9.5% CAGR, where everyday protein and vitamin powders sell across mass grocery retailers without stimulant caps. To capture growing consumer interest in metabolic health, dsm-firmenich AG highlighted expanded weight-management and active nutrition partnerships within its February 2026 Integrated Annual Report on 2025 operations. Evidence compiled by FMI suggests that sports nutrition brands renew synephrine supply contracts when lab tests prove 100% natural para-synephrine purity with zero banned stimulant contaminants, while European daily dose caps govern label claims through 2036.
Key Market Trends & Insights
- By extraction source: Bitter Orange Citrus aurantium Unripe Fruit Extract secures 59.0% share in 2026 because immature dried fruitlets satisfy natural dietary ingredient definitions.
- By active purity: Standardized 6% to 30% Botanical p-Synephrine Powder holds 62.7% in 2026 as multi-ingredient pre-workout scoops require free-flowing carrier powders.
- By commercial application: Sports Nutrition Thermogenic Pre-Workout Supplements capture 49.8% in 2026 due to acute exercise fat-oxidation and energy positioning.
- By delivery format: Flavored Scoop Pre-Workout Powders represent 51.6% in 2026 because gym consumers stack p-synephrine with beta-alanine and citrulline.
- By sales channel: Direct to Sports Nutrition and Supplement Contract Manufacturers commands 55.8% in 2026 through third-party banned-substance certification audits.
Regional Highlights
- Top national expansion: The United States leads national growth projections at a 6.2% CAGR through 2036 under DSHEA compliant botanical pre-workout and thermogenic powder innovation.
- Broader country progression: South Korea tracks at a 5.8% CAGR ahead of Canada at 5.4% and Germany at 5.3%. Japan advances at a 5.2% CAGR while the Netherlands progresses at a 5.1% CAGR and Spain grows at a 5.0% CAGR.
Market Size & Forecast
Table 1: Market Size and Forecast for the Synephrine Market (USD million and CAGR percentage), 2025 to 2036
| Metric | Value |
|---|---|
| 2025 Market Size | USD 641.5 million |
| Estimated Market Size in 2026 | USD 675.0 million |
| Projected Market Size by 2036 | USD 1,153.0 million |
| CAGR, 2026 to 2036 | 5.5% |
| Added Value, 2026 to 2036 | USD 478.0 million |
Fitness supplement brands and weight-management companies need safe, legal thermogenic ingredients that boost workout calorie burn without triggering athletic doping bans or heart-rate spikes. Natural para-synephrine extracted from young bitter oranges gently stimulates fat-burning receptors in fat tissue without causing the heavy jitteriness linked to banned ephedra or high-dose synthetic stimulants. Per a January 2025 cellular pharmacology study in Cell Biochemistry and Biophysics, synephrine also neutralizes free radicals and protects cells against oxidative stress during intense metabolic activity. Supplement formulators blending sports nutrition powders therefore use standardized bitter orange extracts to give gym-goers clean workout energy and cellular recovery support.
Processed Bitter Orange Fruitlet and Active Protoalkaloid Sizing
Table 2: Processed Bitter Orange Fruitlet and Active Protoalkaloid Sizing for the Synephrine Market (USD million and operational ranges), 2025 to 2036
| Metric | 2025 | 2026 | 2036 |
|---|---|---|---|
| Market size (USD million) | 641.5 | 675.0 | 1153.0 |
| Processed dry bitter orange fruitlet feedstock (thousand metric tons) | 82.0 to 92.5 | 86.0 to 97.0 | 142.0 to 160.0 |
| Standardized extract & crystalline output (metric tons) | 4,850 to 5,450 | 5,100 to 5,720 | 8,450 to 9,500 |
| Average realized ingredient price per kg (USD) | 117.7 to 132.3 | 118.0 to 132.4 | 121.4 to 136.4 |
Operational note: Botanical extraction requires harvesting immature Citrus aurantium fruitlets in May and June before natural protoalkaloid concentrations drop by more than 75% during fruit ripening.
Reliable bitter orange potency is a major supply-chain priority for supplement buyers because natural synephrine levels in the fruit drop sharply as oranges ripen on the tree. Botanical extractors must harvest young fallen Citrus aurantium fruitlets in May and June when active protoalkaloid concentrations reach their seasonal peak. Genetic and chemical profiling of bitter orange varieties in PMC confirmed that unripe May fruitlets hold up to 7.64 mg per gram of synephrine before falling by more than 75% during later ripening. Procurement managers formulating pre-workout supplement blends consequently sign early-spring harvest contracts with Mediterranean and Asian extractors to lock in consistent batch potency.
Per Capita & Sports Supplement Line Sizing
Table 3: Per Capita and Supplement Line Indicators for the Synephrine Market (USD), 2025 to 2036
| Metric | 2025 | 2026 | 2036 |
|---|---|---|---|
| World population (billion) | 8.2 | 8.3 | 9.0 |
| Market value per 1,000 people (USD) | 78.2 | 81.3 | 128.1 |
| Annual procurement per sports & weight-loss supplement plant (USD thousand) | 162.0 to 184.0 | 170.0 to 193.0 | 282.0 to 320.0 |
| Chiral-verified botanical & micro-encapsulated share (%) | 64.0% to 68.5% | 66.0% to 70.5% | 76.5% to 81.0% |
Table 4: Sports Nutrition & Channel Indicators for the Synephrine Market (USD and percentages), 2026
| Metric | Value | Institutional Reference Basis |
|---|---|---|
| Market size, 2026 | USD 675.0 million | 2026 global valuation baseline |
| Qualified sports & thermogenic supplement plants global | 3,720 facilities | Pre-workout powder, thermogenic capsule & energy shot plants |
| Average facility synephrine procurement | USD 181,451.6 | Annualized protoalkaloid extract & salt allocation |
| Direct to Contract Manufacturers value, 2026 | USD 376.7 million | 55.8% direct sales channel allocation |
Everyday weight-management shoppers are shifting away from harsh high-caffeine diet pills toward milder daily metabolic drinks and capsules that support fat oxidation during regular exercise. When brands combine moderate doses of bitter orange extract with green tea or amino acids, consumers get steady calorie-burning support without afternoon energy crashes. In February 2025, nutrition scientists reporting in the Journal of the Science of Food and Agriculture demonstrated that Citrus aurantium extracts improved fat metabolism and gut microbiome balance in high-fat-diet obesity models. Product developers creating weight management supplements therefore pair 20 mg to 30 mg of natural p-synephrine with plant polyphenols for daily metabolic maintenance.
Analyst Perspective
"Sports nutrition and slimming brands do not buy synephrine based on cheap bulk powder weight, because a single tainted batch can trigger athlete doping bans or retail recalls. Botanical extractors that guarantee 100% natural para-synephrine purity and taste-masked soluble powders for ready-to-drink cans will capture premium supply contracts through 2036."
- Nandini Roy Choudhury, Principal Consultant, Future Market Insights.
How is the synephrine market segmented?
The synephrine market is segmented by extraction source, active purity, commercial application, delivery format, and sales channel. In 2026, Bitter Orange Citrus aurantium Unripe Fruit Extract is projected at 59.0%, Standardized 6% to 30% Botanical p-Synephrine Powder at 62.7%, Sports Nutrition Thermogenic Pre-Workout Supplements at 49.8%, Flavored Scoop Pre-Workout Powders at 51.6%, and Direct to Sports Nutrition and Supplement Contract Manufacturers at 55.8%.
By extraction source: Bitter Orange Citrus aurantium Unripe Fruit Extract and Chemical Synthesis High Purity along with Multi-Citrus Standardized Peel Blends.
By active purity: Standardized 6% to 30% Botanical p-Synephrine Powder and High Purity 98% p-Synephrine Hydrochloride Crystalline plus Water-Soluble Beverage Micro-Encapsulated Grades.
By commercial application: Sports Nutrition Thermogenic Pre-Workout Supplements and Dietary Weight Management and Metabolic Rate Pills along with Functional Energy Shots and Beverages.
By delivery format: Flavored Scoop Pre-Workout Powders and Compressed Thermogenic Tablets and Capsules along with Ready-to-Drink Liquid Energy Shots.
By sales channel: Direct to Sports Nutrition and Supplement Contract Manufacturers with Botanical and Nutraceutical Ingredient Distributors and Online B2B Bulk Ingredient Marketplaces.
Why does Bitter Orange Citrus aurantium Unripe Fruit Extract lead the extraction source category?
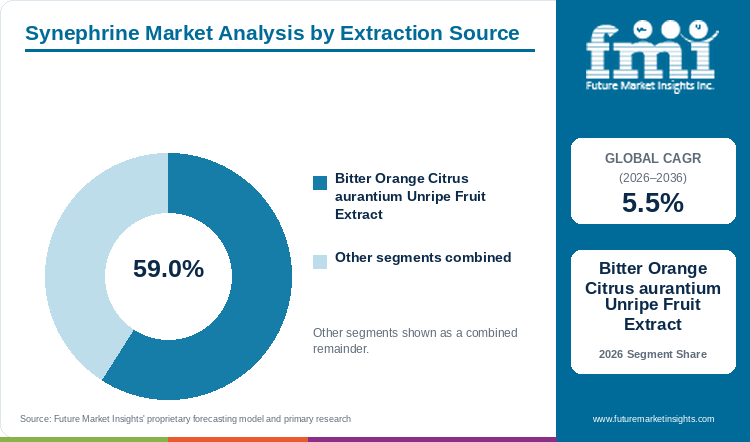
Bitter Orange Citrus aurantium Unripe Fruit Extract holds an estimated 59.0% of extraction source demand in 2026, anchored by natural dietary ingredient compliance across North America, Europe, and East Asia.
Table 5: Extraction Source Share for the Synephrine Market (percentage share), 2026
| Extraction Source | Share (2026) |
|---|---|
| Bitter Orange Citrus aurantium Unripe Fruit Extract | 59.0% |
| Other Segments Combined | 41.0%* |
| Total | 100.0% |
*Note: Remaining extraction source categories account for the balance of 2026 global synephrine demand.
Table 6: Extraction Source Leadership and Market Growth for the Synephrine Market (segment and CAGR percentage), 2026 to 2036
| Metric | Value |
|---|---|
| Global CAGR (2026 to 2036) | 5.5% |
| Leading Segment | Bitter Orange Citrus aurantium Unripe Fruit Extract |
Supplement laws in the United States, Canada, and Europe require over-the-counter fat-burning powders and capsules to use natural plant extracts rather than synthetic factory chemicals. Dried young bitter oranges supply natural para-synephrine with helpful citrus bioflavonoids, making citrus aurantium extracts the compliant foundation for retail sports supplements.
- Bitter Orange Citrus aurantium Unripe Fruit Extract holds 59.0% of 2026 extraction source demand since dietary supplement statutes prohibit synthetic stimulants in retail fitness products.
- An August 2025 systematic review in Nutrients evaluated citrus naringin co-extracts across metabolic trials and confirmed protective vascular and lipid benefits that complement bitter orange formulas.
What sustains Standardized 6% to 30% Botanical p-Synephrine Powder leadership in active purity?
Standardized 6% to 30% Botanical p-Synephrine Powder represents 62.7% of the active purity category in 2026, supported by uniform dry-blending dispersion inside multi-gram pre-workout scoops.
Contract powder blenders prefer 6% to 30% standardized botanical powders spray-dried onto maltodextrin carriers because factory workers can weigh 100 mg to 300 mg per scoop to hit an exact 20 mg to 30 mg active dose. By comparison, pure 98% crystalline salts are difficult to mix evenly in large powder vats and trigger drug classification in retail weight loss supplement capsules.
- Standardized 6% to 30% Botanical p-Synephrine Powder represents 62.7% of active purity demand in 2026 because carrier-standardized botanical powders mix evenly in high-speed ribbon blenders.
- In September 2025, pharmacology authors writing in PubMed confirmed that standardized orange peel extracts rich in citrus bioactives significantly reduced tissue inflammation and oxidative stress.
How do Sports Nutrition Thermogenic Pre-Workout Supplements lead commercial applications?
Sports Nutrition Thermogenic Pre-Workout Supplements account for 49.8% of commercial application demand in 2026, driven by acute fat-oxidation and ephedra-free energy positioning.
Gym members and amateur athletes consistently buy pre-workout formulas that combine mental focus with faster fat burning during weight training and cardio sessions. Co-formulation of standardized p-synephrine with L-carnitine supplement ingredients and moderate caffeine boosts exercise fat utilization without raising resting heart rate in healthy adults.
- Sports Nutrition Thermogenic Pre-Workout Supplements account for 49.8% of commercial application value in 2026 because pre-workout powder tubs generate the highest repeat monthly purchases.
- A December 2025 network meta-analysis of 48 clinical trials involving 612 participants in PubMed confirmed that calibrated pre-exercise stimulant dosing improves time-trial speed and power output.
Why do Flavored Scoop Pre-Workout Powders lead the delivery format category?
Flavored Scoop Pre-Workout Powders secure 51.6% of delivery format value in 2026, supported by high-grammage amino acid, citrulline, and botanical thermogenic stacking.
Modern pre-workout recipes pack 3 to 6 grams of citrulline, 3.2 grams of beta-alanine, and botanical thermogenics into a single 15-gram serving that cannot fit into standard pills. Dry bitter orange extract powders dissolve quickly in cold gym shaker bottles when blended with fruit acids and natural sweeteners.
- Flavored Scoop Pre-Workout Powders secure 51.6% of delivery format demand in 2026 because multi-gram amino acid and thermogenic stacks require scoopable canister formats.
- A February 2025 double-blind randomized trial involving 80 men in PubMed showed that pre-exercise stimulant supplementation paired with interval training improved 3-kilometer running times and peak power.
What gives Direct to Sports Nutrition and Supplement Contract Manufacturers the leading position in sales channel?
Direct to Sports Nutrition and Supplement Contract Manufacturers commands 55.8% of sales channel share in 2026, anchored by chiral HPLC verification and WADA anti-doping batch audits.
Major fitness brands require NSF Certified for Sport and Informed-Choice lab testing on every production lot to prove their bitter orange extracts contain zero banned octopamine or synthetic isomers. Contract supplement makers therefore buy directly from audited botanical extractors that provide batch-specific chiral purity certificates.
- Direct to Sports Nutrition and Supplement Contract Manufacturers accounts for 55.8% of 2026 sales channel demand since anti-doping certification requires direct lab chromatogram verification.
- In June 2025, Novonesis launched its Optiva LS Prime biosolution to help commercial food and beverage formulators cut added sugar and improve metabolic nutrition profiles.
What are the drivers, restraints, and opportunities in the synephrine market?
In the synephrine market, athletic adoption of ephedra-free thermogenic pre-workout powders and metabolic maintenance supplements is projected to drive growth whereas European 20 mg to 30 mg daily dose ceilings and high-caffeine stacking warnings restrain high-dose pills and micro-encapsulated p-synephrine opens clear energy shots.
- Driver: Athletic adoption of ephedra-free thermogenic pre-workout powders and non-prescription metabolic rate enhancers drives standardized bitter orange extract procurement.
- Restraint: Strict European national daily intake caps of 20 mg to 30 mg and adverse cardiovascular case reports from high-caffeine stacking restrain aggressive high-dose formulations.
- Opportunity: Micro-encapsulated water-soluble p-synephrine and stimulant-free fat-oxidation stacks with L-carnitine and green tea catechins open ready-to-drink fitness beverages.
Growth Analysis and Future Potential: Qualitative Demand Catalysts
Higher gym participation and consumer demand for everyday metabolic support are prompting nutrition brands to add standardized bitter orange extracts to daily fitness powders and slimming drinks. As shoppers look for non-prescription ways to maintain weight and muscle tone, formulators pair p-synephrine with food supplement ingredients that support active energy expenditure. In September 2026, physiology researchers publishing in the Journal of Visualized Experiments showed that citrus bioactive supplementation activates cellular antioxidant defenses and protects working skeletal muscle. That combination of calorie burning and muscle protection encourages repeat purchases among active adult shoppers.
Risk Assessment of the Synephrine Market: Operational and Formulation Friction
Strict European daily dose caps and medical warnings against mixing high-dose synephrine with heavy caffeine remain the chief restraints limiting aggressive stimulant formulas. Food safety regulators across Europe cap daily p-synephrine intake at 20 mg to 30 mg and discourage high-stimulant combinations in casual nutraceutical gummy formats. In May 2026, cardiologists reporting in PubMed documented rapid heart rhythm episodes in a consumer taking high-dose bitter orange weight-loss pills stacked with multiple stimulants, explaining why major brands enforce clear 20 mg to 30 mg serving limits.
Commercial Opportunity Analysis: Formulation Differentiation and Value-Add Formats
Botanical refiners can capture higher margins by micro-encapsulating natural p-synephrine so beverage brands can launch clear, non-bitter 60-milliliter fitness energy shots. Uncoated bitter orange extract leaves a sharp, astringent aftertaste that limits its use in ready-to-drink cans unless suppliers wrap the extract in protective carrier shells with nutricosmetic active ingredients. A March 2026 pharmacology study in PMC confirmed that synephrine selectively modulates peripheral adrenergic receptors in a dose-dependent manner, supporting both oral fitness shots and targeted topical toning serums.
Synephrine Market by Country (2026 to 2036)
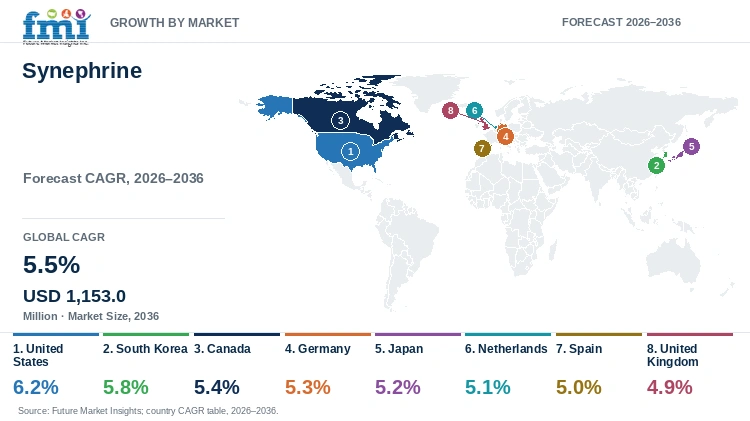
FMI country modeling indicates that the United States leads synephrine market expansion at a 6.2% CAGR through 2036, while the United Kingdom advances at a 4.9% CAGR. National growth disparities across North America sports supplement hubs, East Asian functional slimming markets, and European maximum-dose regulatory jurisdictions reflect local botanical supplement rules and pre-workout retail velocity.
Table 7: Country CAGR and Primary Growth Levers for the Synephrine Market (CAGR percentage and operational drivers), 2026 to 2036
| Country | CAGR (2026 to 2036) | Primary Growth Lever |
|---|---|---|
| United States | 6.2% | DSHEA botanical flexibility and high-velocity pre-workout powder and RTD launches |
| South Korea | 5.8% | MFDS-compliant weight-management ampoules and convenience-store slimming shots |
| Canada | 5.4% | Health Canada NHP workout supplement monographs and third-party anti-doping certification |
| Germany | 5.3% | BfR-compliant moderate-dose thermogenic stacks with L-carnitine in e-commerce powders |
| Japan | 5.2% | Adult fat-metabolism tablets and walking-exercise functional drinks |
| Netherlands | 5.1% | Rotterdam botanical import warehousing and pan-European contract powder blending |
| Spain | 5.0% | Seville bitter orange immature fruitlet extraction and traceable European refining |
| United Kingdom | 4.9% | Informed-Sport certified pre-workout sachets and high-street metabolic wellness powders |
Source: Future Market Insights analysis
United States Synephrine Market Outlook (2026 to 2036)
Synephrine demand across the United States will advance at a top 6.2% CAGR through 2036 because millions of gym-goers purchase thermogenic pre-workout powders and zero-sugar energy cans every month. Unlike European countries that cap daily servings at 20 mg, federal dietary supplement rules in the United States allow 30 mg to 50 mg natural bitter orange servings when supported by good manufacturing practice quality tests. In October 2025, Kerry Group plc reported third-quarter 2025 results noting steady volume growth across United States beverage and nutritional taste-masking systems. Sports supplement makers in the United States pair bitter orange extracts with citrus flavor maskers in ready-to-drink workout cans.
Key takeaway: In the United States, DSHEA botanical flexibility and high-velocity pre-workout powder and RTD innovation are projected to drive a leading 6.2% CAGR.
South Korea Synephrine Market Outlook (2026 to 2036)
Whereas sales in the United States revolve around gym pre-workout tubs, consumer adoption in South Korea is driven by beauty-focused weight management and convenience-store slimming liquid shots. Valuation of the synephrine market in South Korea is forecast to advance at a 5.8% CAGR between 2026 and 2036 across certified nutraceutical contract plants in Gyeonggi and Chungcheong provinces. Per the May 2026 USDA Foreign Agricultural Service South Korea Food Processing Ingredients Annual report, domestic supplement makers actively import standardized botanical extracts that meet Ministry of Food and Drug Safety standards. Diet brands in South Korea favor debittered, water-soluble bitter orange powders for pocket-sized slimming ampoules sold across retail chains.
Key takeaway: In South Korea, active weight-management consumer demand and portable slimming shot formulations are forecast to sustain a 5.8% CAGR.
Canada Synephrine Market Outlook (2026 to 2036)
Unlike self-affirmed supplement launches in the United States, commercial procurement across Canada is governed by federal Natural Health Product workout monographs that set clear daily p-synephrine and caffeine limits. The synephrine market in Canada is estimated to progress at a 5.4% CAGR through 2036 across licensed sports nutrition brands in Ontario and western provinces. In October 2025, dsm-firmenich AG published its third-quarter 2025 trading update confirming steady demand for human health and dietary supplement premixes across North America nutrition accounts. Contract blenders in Canada purchase third-party-tested 6% to 30% bitter orange powders carrying verified Natural Product Numbers and full chiral purity certificates for specialty fitness retailers.
Key takeaway: In Canada, licensed Natural Health Product workout monographs and third-party anti-doping certification are estimated to support a 5.4% CAGR.
Germany Synephrine Market Outlook (2026 to 2036)
Market growth in Germany is shaped by strict Federal Institute for Risk Assessment guidelines that cap daily p-synephrine doses and steer sports brands in Germany toward moderate, low-caffeine fat-burning formulas. Valuation of the synephrine market in Germany is anticipated to grow at a 5.3% CAGR from 2026 to 2036 across gym-chain private labels and online fitness nutrition stores. A June 2026 sports physiology review in PMC examining exercise performance and muscle blood flow confirmed that athletes actively pair moderate plant stimulants with amino acid recovery nutrients. Supplement makers in Germany therefore blend 6% bitter orange extract with L-carnitine and B-vitamins to stay within national safety limits.
Key takeaway: In Germany, BfR-compliant moderate-dose thermogenic stacks paired with L-carnitine in e-commerce sports powders are anticipated to anchor a 5.3% CAGR.
Japan Synephrine Market Outlook (2026 to 2036)
Unlike Western bodybuilding markets focused on high-stimulant scoops, shopper uptake across Japan focuses on mild daily fat-metabolism tablets and convenience-store walking-exercise drinks for office workers. Synephrine industry valuation in Japan will progress at a 5.2% CAGR between 2026 and 2036 as beverage and supplement brands market gentle thermogenic formulas for adult weight maintenance. Findings in the April 2026 USDA Foreign Agricultural Service annual assessment of Japan food processing ingredients show that functional health drinks and metabolic supplements remain resilient growth categories within Japan's USD 174 billion food industry. Formulators in Japan require ultra-low-pesticide citrus extracts verified by domestic lab testing for daily consumer health routines.
Key takeaway: In Japan, daily fat-metabolism tablets and walking-exercise functional drinks for adult consumers are projected to sustain a 5.2% CAGR.
Netherlands Synephrine Market Outlook (2026 to 2036)
The Netherlands functions as Western Europe's main import, warehousing, and contract-blending hub for bulk botanical powders and private-label sports nutrition tubs. Synephrine market size in the Netherlands is projected to climb at a 5.1% CAGR through 2036 across Rotterdam and Venlo supplement fulfillment and powder-packaging facilities. April 2026 findings in the USDA Foreign Agricultural Service annual report on Netherlands food processing ingredients confirms that the Netherlands acts as the primary port gateway for specialty nutraceutical ingredients entering the European Union. Contract packers in the Netherlands blend standardized 10% and 30% bitter orange extracts into cross-border e-commerce pre-workout canisters and athletic supplement pouches for European retail chains.
Key takeaway: In the Netherlands, port-of-entry botanical warehousing and pan-European contract pre-workout powder blending are slated to drive a 5.1% CAGR.
Spain Synephrine Market Outlook (2026 to 2036)
Spain holds a distinct dual advantage as Europe's largest grower of Seville bitter oranges and a growing Mediterranean market for active-lifestyle and slimming supplements. The synephrine market in Spain is predicted to grow at a 5.0% CAGR from 2026 to 2036 as botanical refineries in Andalusia and Murcia harvest young May fruitlets for both European export and domestic capsule lines. March 2026 Madrid reporting from the USDA Foreign Agricultural Service report on the food processing ingredients sector in Spain, domestic extractors supply high-value Mediterranean plant derivatives across European nutrition accounts. Refiners in Spain win buyers through full orchard-to-lab traceability and zero synthetic adulteration across bulk export shipments.
Key takeaway: In Spain, indigenous Seville bitter orange fruitlet extraction and traceable European botanical refining are predicted to maintain a 5.0% CAGR.
United Kingdom Synephrine Market Outlook (2026 to 2036)
Demand in the United Kingdom is driven by commercial gym chains and Informed-Sport certified pre-workout powders formulated for football, rugby, and everyday fitness consumers. Synephrine market valuation across the United Kingdom is predicted to climb at a 4.9% CAGR between 2026 and 2036 across northern England contract powder blenders and high-street nutrition retailers. March 2026 London statistics from the USDA Foreign Agricultural Service report on the food processing ingredients sector in the United Kingdom, wellness brands prioritize clean-label plant extracts supported by transparent safety files. Formulators in the United Kingdom combine 20 mg of natural p-synephrine with electrolytes in single-serve workout sachets for retail gym chains.
Key takeaway: In the United Kingdom, Informed-Sport certified pre-workout sachets and high-street metabolic wellness powders are estimated to support a 4.9% CAGR.
Full report country CAGRs cover: North America and Latin America with Western Europe and Eastern Europe. Regional modeling also covers East Asia, South Asia and Pacific, and Middle East and Africa.
Who are the notable companies in the synephrine market?
Cargill Incorporated and International Flavors and Fragrances Inc. with Kerry Group plc, Ingredion Incorporated, Tate and Lyle plc, Roquette Freres SA, Novonesis, dsm-firmenich AG, Archer Daniels Midland Company and Corbion N.V. are the notable companies in the synephrine market.
Competitive positioning in the synephrine industry separates global citrus and botanical extraction groups, taste-masking and pre-workout delivery system formulators, and pharmaceutical excipient and enzymatic biosolutions providers. Cargill Incorporated and International Flavors and Fragrances Inc. with Archer Daniels Midland Company manage global citrus side-stream origination and botanical extract standardization. Kerry Group plc and Ingredion Incorporated with Tate and Lyle plc engineer bitterness-masking flavor systems, micro-encapsulation carriers, and zero-sugar energy shot matrices. Roquette Freres SA and Novonesis with dsm-firmenich AG and Corbion N.V. supply direct-compression tablet excipients, enzymatic extraction aids, and human health premixes.
- Botanical Citrus Extraction and Origination Leaders: Cargill Incorporated and International Flavors and Fragrances Inc. with Archer Daniels Midland Company source citrus peel and unripe fruitlet streams for standardized botanical extracts.
- Bitterness-Control and Pre-Workout Matrix Formulators: Kerry Group plc and Ingredion Incorporated with Tate and Lyle plc supply modified starch carriers, sweet-protein taste modulators, and RTD beverage stabilizers.
- Tablet Compression and Biosolution Specialists: Roquette Freres SA and Novonesis with dsm-firmenich AG and Corbion N.V. provide high-speed tableting binders, extraction enzymes, and metabolic premix blends.
Competitive Benchmarking: Synephrine Market
Table 8: Competitive Benchmarking for the Synephrine Market (qualitative capability ratings), 2026
| Company | Botanical Citrus Origination | Bitterness Masking & Encapsulation | Sports & Regulatory Compliance | Geographic Reach |
|---|---|---|---|---|
| Cargill Incorporated | High | High | High | Global citrus side-stream origination, sweeteners, and APAC/Americas beverage labs |
| International Flavors and Fragrances Inc. | High | High | High | Global Health & Biosciences botanical extracts and citrus taste modulation |
| Kerry Group plc | High | High | High | Global taste maskers, proactive health botanicals, and RTD beverage centers |
| Ingredion Incorporated | Medium | High | High | Global PureCircle sweet proteins, encapsulation starches, and FUSERA matrices |
| Tate and Lyle plc | High | High | High | Global CP Kelco citrus peel valorization, stevia sweeteners, and mouthfeel systems |
| Roquette Freres SA | Medium | High | High | Global pharmaceutical tableting excipients and cyclodextrin encapsulation carriers |
| Novonesis | Medium | Medium | High | Global extraction enzymes, Optiva metabolic biosolutions, and human health actives |
| dsm-firmenich AG | High | High | High | Global clinical nutrition premixes, taste masking, and dietary supplement hubs |
| Archer Daniels Midland Company | High | High | High | Global citrus botanical extraction, wellness premixes, and beverage emulsion labs |
| Corbion N.V. | Medium | Medium | High | Global buffered acidulants and mineral lactates for sour pre-workout powders |
Evaluation basis: Botanical Citrus Origination evaluates access to immature Citrus aurantium and standardized peel supply chains, whereas Bitterness Masking & Encapsulation rates spray-drying and taste-modulation systems for pre-workout powders and energy shots. Sports & Regulatory Compliance measures chiral HPLC verification and anti-doping audit readiness.
Key Developments in the Synephrine Market
- Kerry Group plc published technical enzymatic and formulation performance findings on March 16, 2026 detailing how targeted biosolutions optimize ingredient cost-in-use and functional stability.
- Kerry Group plc secured a positive EFSA scientific opinion on May 18, 2026 for its proprietary Acrylerase enzyme, reinforcing its European regulatory dossier and biosolutions credentials.
- Puratos unveiled concentrated unit-dose formulation delivery technology at iba 2025 on May 7, 2025, demonstrating compact solid active dosing without bulk carrier powders.
Key Players in the Synephrine Market
Botanical Citrus Extraction and Origination Leaders
- Cargill Incorporated
- International Flavors and Fragrances Inc.
- Archer Daniels Midland Company
- Bitterness-Control and Pre-Workout Matrix Formulators
Kerry Group plc
- Ingredion Incorporated
- Tate and Lyle plc
- Tablet Compression and Biosolution Specialists
- Roquette Freres SA
Novonesis
- dsm-firmenich AG
- Corbion N.V.
Synephrine Market - Report Scope
Table 9: Report Scope for the Synephrine Market (coverage fields and definitions), 2026 to 2036
| Coverage field | Report scope |
|---|---|
| Market breakdown | Extraction Source, Active Purity, Commercial Application, Delivery Format, Sales Channel |
| Quantitative Units | USD Million |
| Market Definition | Includes commercial supplier valuation from standardized botanical Citrus aurantium (bitter orange) unripe fruit extracts (6% to 50%+ p-synephrine), chemically synthesized high-purity p-synephrine hydrochloride crystalline salts (98%+), and micro-encapsulated beverage grades. Category Scope Note: Excludes unstandardized bitter orange blossom neroli oil, non-synephrine citrus bioflavonoids, and prescription hospital phenylephrine. |
| Regions Covered | North America, Latin America, Western Europe, Eastern Europe, East Asia, South Asia and Pacific, Middle East and Africa |
| Countries Covered | United States, South Korea, Canada, Germany, Japan, Netherlands, Spain, United Kingdom, and additional countries in the full report |
| Key Companies Covered | Cargill Incorporated, International Flavors and Fragrances Inc., Kerry Group plc, Ingredion Incorporated, Tate and Lyle plc, Roquette Freres SA, Novonesis, dsm-firmenich AG, Archer Daniels Midland Company, Corbion N.V. |
| Forecast Period | 2026 to 2036 |
| Approach | Primary and secondary research with top-down and bottom-up market triangulation. |
Synephrine Market - Research Methodology
Table 10: Research Methodology for the Synephrine Market (research methods and approach), 2026 edition
| Method | Approach |
|---|---|
| Primary Research | Structured interviews with Seville and Asian bitter orange extractors, sports nutrition contract powder blenders, and chiral-HPLC quality directors to validate active purity pricing and harvest yields. |
| Secondary Research | Analysis of FDA DSHEA, Health Canada NHP, and European BfR/EFSA daily intake opinions, USDA FAS Food Processing Ingredients Annual reports, and PubMed/PMC adrenergic receptor studies. |
| Market Sizing and Forecasting | Top-down global sports nutrition and botanical weight-management baselines reconciled against bottom-up standardized extract and salt output (5,100 to 5,720 MT in 2026) and realized prices per kilogram through 2036. |
| Country Forecasting Model | Econometric national models weight gym membership and pre-workout supplement penetration, statutory daily p-synephrine milligram limits, and domestic citrus extraction capacity across eight countries. |
| Operational Benchmark Traceability | Fruitlet harvest tonnage and facility procurement indicators in Tables 2, 3, and 4 trace to Citrus aurantium developmental transcriptome assays and USDA FAS national processing registries. |
| Data Triangulation and Validation | Valuation estimates isolate standardized p-synephrine botanical extracts and crystalline hydrochloride salts while excluding bulk orange juice concentrates, hesperidin phlebotonics, and synthetic ephedrine. |
Synephrine Market by Segments
Synephrine Market segmented by Extraction Source:
- Bitter Orange Citrus aurantium Unripe Fruit Extract
- Chemical Synthesis High Purity
- Multi-Citrus Standardized Peel Blends
- Mandarin and Clementine Leaf/Peel Extracts
Synephrine Market segmented by Active Purity:
- Standardized 6% to 30% Botanical p-Synephrine Powder
- High Purity 98% p-Synephrine Hydrochloride Crystalline
- Water-Soluble Beverage Micro-Encapsulated Grades
- Standardized 50% Mid-Potency Thermogenic Extracts
Synephrine Market segmented by Commercial Application:
- Sports Nutrition Thermogenic Pre-Workout Supplements
- Dietary Weight Management and Metabolic Rate Pills
- Functional Energy Shots and Beverages
- Clinical & Ophthalmic Vasoconstrictor Formulations
- Topical Cosmetic & Scalp-Tonic Preparations
Synephrine Market segmented by Delivery Format:
- Flavored Scoop Pre-Workout Powders
- Compressed Thermogenic Tablets and Capsules
- Ready-to-Drink Liquid Energy Shots
- Effervescent Metabolic Sticks and Gummies
Synephrine Market segmented by Sales Channel:
- Direct to Sports Nutrition and Supplement Contract Manufacturers
- Botanical and Nutraceutical Ingredient Distributors
- Pharmaceutical Fine-Chemical Supply
- Online B2B Bulk Ingredient Marketplaces
Synephrine Market by Region
- North America
- United States
- Canada
- Latin America
- Brazil
- Mexico
- Argentina
- Chile
- Western Europe
- Germany
- France
- United Kingdom
- Italy
- Spain
- Benelux
- Nordics
- Eastern Europe
- Poland
- Czech Republic
- Romania
- Hungary
- East Asia
- China
- Japan
- South Korea
- South Asia and Pacific
- India
- ASEAN
- Australia and New Zealand
- Middle East and Africa
- GCC Countries
- South Africa
- Türkiye
- Israel
Research Sources and Bibliography
- [1] Kubacka, M. et al. (2025, March 05). p-Synephrine an overview of physicochemical properties and pharmacological effects. EXCLI Journal, 24, 381 (PMC12078783).
- [2] Kubacka, M. et al. (2025, March 05). Review of p-Synephrine toxicity and isomer differentiation in dietary supplements. EXCLI Journal (PubMed PMID 40376440).
- [3] dsm-firmenich AG. (2026, February 20). Sustainability innovation and partnerships in Health Nutrition and Care. dsm-firmenich Integrated Annual Report 2025.
- [4] Somparn, N. et al. (2025, January 20). Synephrine Inhibits Oxidative Stress and H2O2-Induced Premature Senescence in WI-38 Cells. Cell Biochemistry and Biophysics (PMC12089197).
- [5] Liu, Z. et al. (2024, September 09). Transcriptome analysis of Citrus Aurantium L. to study synephrine biosynthesis across developmental stages. BMC Genomics (PMC11391941).
- [6] Wang, J. et al. (2025, February 13). The flowers extracts of Citrus aurantium regulates fat metabolism in obese C57BL/6J mice. Journal of the Science of Food and Agriculture, 105(7), 3808-3818 (PubMed PMID 39948729).
- [7] Adams, J. A. et al. (2025, August 17). Endothelial and Cardiovascular Effects of Naringin A Systematic Review. Nutrients, 17(16), 2658 (PubMed PMID 40871686).
- [8] Oliveira, R. et al. (2025, September 01). Orange peel extract and hesperidin attenuate myeloperoxidase and oxidative stress. Inflammopharmacology (PubMed PMID 40889009).
- [9] Lin, Y. et al. (2025, December 03). Effects of Caffeine Dose and Administration Method on Time-Trial Performance Network Meta-Analysis. Sports Medicine (PubMed PMID 41374083).
- [10] Souza, D. et al. (2025, February 04). Habitual Caffeine Consumption and Training Status Affect the Ergogenicity of Pre-Exercise Intake. American Journal of Sports Medicine (PubMed PMID 39905628).
- [11] Novonesis. (2025, June 11). Novonesis launches Optiva LS Prime helping bakers cut up to 50% added sugar. Novonesis Corporate Newsroom.
- [12] Li, W. et al. (2026, September 22). Hesperidin Mitigates Skeletal Muscle Ischemia-Reperfusion Injury via Nrf2 and NF-kB Pathways. Journal of Visualized Experiments, 235, e72823 (PubMed PMID 42775776).
- [13] Patel, R. et al. (2026, May 14). Unexplained Supraventricular Tachycardia and Myocardial Injury Associated with Bitter Orange Supplement. Case Reports in Cardiology (PubMed PMID 42132724).
- [14] Hung, C. H. et al. (2026, March 10). Synephrine potentiates lidocaine-induced cutaneous analgesia via alpha-adrenergic receptors. Fundamental and Clinical Pharmacology (PMC13097421).
- [15] Kerry Group plc. (2025, October 23). Kerry Group Q3 2025 Interim Management Statement. Kerry Group plc Media Releases.
- [16] USDA Foreign Agricultural Service. (2026, May 27). South Korea Food Processing Ingredients Annual. U.S. Department of Agriculture GAIN Report KS2026-0011.
- [17] dsm-firmenich AG. (2025, October 30). dsm-firmenich Q3 2025 trading update. dsm-firmenich Corporate Press Releases.
- [18] Naderi, A. et al. (2026, June 15). Caffeine and human performance from molecular mechanisms to post-exercise recovery. Journal of the International Society of Sports Nutrition (PMC13391340).
- [19] USDA Foreign Agricultural Service. (2026, April 01). Japan Food Processing Ingredients Annual. U.S. Department of Agriculture GAIN Report JA2026-0012.
- [20] USDA Foreign Agricultural Service. (2026, April 02). Netherlands Food Processing Ingredients Annual. U.S. Department of Agriculture GAIN Report NL2026-0006.
- [21] USDA Foreign Agricultural Service. (2026, March 31). Spain Food Processing Ingredients Annual Report Madrid. U.S. Department of Agriculture GAIN Report SP2026-0003 PDF.
- [22] USDA Foreign Agricultural Service. (2026, March 24). United Kingdom Food Processing Ingredients Annual Report London. U.S. Department of Agriculture GAIN Report UK2026-0008 PDF.
- [23] Holt, C. (2026, March 16). How Enzymes Are Reshaping Bakery and Ingredient Performance. Kerry Group plc KerryDigest.
- [24] Kerry Group plc. (2026, May 18). EFSA publishes positive scientific opinion on Kerry Acrylerase enzyme. Kerry Group plc Media Releases.
- [25] Puratos Group. (2025, May 07). Puratos brings a trio of innovations to iba 2025. Puratos Group Press Room.
- [26] Savvateeva, L. V. et al. (2025, April 18). Computational Screening and Experimental Evaluation of Plant Proteases. Pharmaceuticals, 18(4), 592 (PMC12030614).
- [27] AB Enzymes GmbH. (2026, June 01). AB Enzymes Opens New Office and Baking Lab in Curitiba Brazil. AB Enzymes GmbH Newsroom.
- [28] EFSA Panel on Food Enzymes. (2026, July 06). Safety evaluation of an extension of use of the food enzyme endo-1,4-beta-xylanase from Aspergillus oryzae. EFSA Journal, 24(7), e10181 (PMC13334363).
- [29] EFSA Panel on Food Enzymes. (2026, May 08). Safety evaluation of the food enzyme glucan 1,4-alpha-maltohydrolase from Bacillus licheniformis. EFSA Journal, 24(5), e10086 (PMC13154760).
- [30] EFSA Panel on Food Enzymes. (2025, June 24). Safety evaluation of the food enzyme endo-1,4-beta-xylanase from Trichoderma citrinoviride. EFSA Journal, 23(6), e9482 (PMC12185997).
- [31] Zhang, R. et al. (2026, May 01). Role of Enzymatic Hydrolysis-Induced Macromolecular Interactions in Regulating Texture and Flavor. Journal of Food Science, 91(5), e71116 (PubMed PMID 42104754).
- [32] USDA Foreign Agricultural Service. (2026, July 03). Singapore Exporter Guide Annual. U.S. Department of Agriculture GAIN Report SN2026-0002.
Representative source citations appear above for reader inspection while the full synephrine market edition includes the complete bibliography.
This Report Answers
- How large is the synephrine market in 2026 and what is forecast for 2036?
- Which pre-workout thermogenic and non-ephedra weight-management trends support demand for synephrine?
- Why does Bitter Orange Citrus aurantium Unripe Fruit Extract lead the extraction source category?
- Why does Standardized 6% to 30% Botanical p-Synephrine Powder lead active purity globally?
- How do growth rates differ between the United States and South Korea or between Germany and Spain?
- Which leading companies supply standardized citrus botanicals versus taste-masking and tableting systems?
- What limits daily p-synephrine dosage in Europe or creates cardiovascular risk when stacked with high caffeine?
- What should sports nutrition brands verify via chiral HPLC before qualifying a bitter orange extract supplier?
Table of Content
- Key Takeaways
- Market Size and CAGR
- Top Growth Driver
- Fastest Growing Segment
- Leading Region
- Key Companies
- Emerging Opportunities
- Executive Summary
- Global Market Outlook
- Demand-side Trends
- Supply-side Trends
- Technology Roadmap Analysis
- Analysis and Recommendations
- Analyst Perspective (What is happening? Why now? What should investors know?)
- Key Questions Answered
- How large is the market?
- What is the CAGR?
- What are key trends?
- Which region dominates?
- Who are the leaders?
Read More...
- Market Overview
- Market Coverage / Taxonomy
- Market Definition / Scope / Limitations
- Research Methodology
- Chapter Orientation
- Analytical Lens and Working Hypotheses
- Market Structure, Signals, and Trend Drivers
- Benchmarking and Cross-market Comparability
- Market Sizing, Forecasting, and Opportunity Mapping
- Research Design and Evidence Framework
- Desk Research Programme (Secondary Evidence)
- Expert Input and Fieldwork (Primary Evidence)
- Tooling, Models, and Reference Databases
- Data Engineering and Model Build
- Quality Assurance and Audit Trail
- Market Background
- Market Dynamics (Drivers, Restraints, Opportunity, Trends)
- Scenario Forecast (Optimistic, Likely, Conservative)
- Impact Analysis
- AI Impact
- Sustainability Impact
- Regulatory Impact
- Technology Impact
- Consumer / Buyer Analysis
- Purchase Drivers
- Adoption Barriers
- Buyer Journey
- Opportunity Map Analysis
- Product Life Cycle Analysis
- Supply Chain Analysis
- Investment Feasibility Matrix
- Value Chain Analysis
- PESTLE and Porter's Analysis
- Regulatory Landscape
- Regional Parent Market Outlook
- Production and Consumption Statistics
- Import and Export Statistics
- Global Market Analysis and Forecast, 2021 to 2036
- Historical Market Size Value (USD Million) Analysis, 2021 to 2025
- Current and Future Market Size Value (USD Million) Projections, 2026 to 2036
- Y-o-Y Growth Trend Analysis
- Absolute $ Opportunity Analysis
- Global Market Pricing Analysis, 2021 to 2036
- Global Market Analysis and Forecast, By Extraction Source, 2021 to 2036
- Introduction / Key Findings
- Historical Market Size Value (USD Million) Analysis By Extraction Source, 2021 to 2025
- Current and Future Market Size Value (USD Million) Analysis and Forecast By Extraction Source, 2026 to 2036
- Bitter Orange Citrus aurantium Unripe Fruit Extract
- Chemical Synthesis High Purity
- Multi-Citrus Standardized Peel Blends
- Mandarin and Clementine Leaf/Peel Extracts
- Y-o-Y Growth Trend Analysis By Extraction Source, 2021 to 2025
- Absolute $ Opportunity Analysis By Extraction Source, 2026 to 2036
- Global Market Analysis and Forecast, By Active Purity, 2021 to 2036
- Introduction / Key Findings
- Historical Market Size Value (USD Million) Analysis By Active Purity, 2021 to 2025
- Current and Future Market Size Value (USD Million) Analysis and Forecast By Active Purity, 2026 to 2036
- Standardized 6% to 30% Botanical p-Synephrine Powder
- High Purity 98% p-Synephrine Hydrochloride Crystalline
- Water-Soluble Beverage Micro-Encapsulated Grades
- Standardized 50% Mid-Potency Thermogenic Extracts
- Y-o-Y Growth Trend Analysis By Active Purity, 2021 to 2025
- Absolute $ Opportunity Analysis By Active Purity, 2026 to 2036
- Global Market Analysis and Forecast, By Commercial Application, 2021 to 2036
- Introduction / Key Findings
- Historical Market Size Value (USD Million) Analysis By Commercial Application, 2021 to 2025
- Current and Future Market Size Value (USD Million) Analysis and Forecast By Commercial Application, 2026 to 2036
- Sports Nutrition Thermogenic Pre-Workout Supplements
- Dietary Weight Management and Metabolic Rate Pills
- Functional Energy Shots and Beverages
- Clinical & Ophthalmic Vasoconstrictor Formulations
- Topical Cosmetic & Scalp-Tonic Preparations
- Y-o-Y Growth Trend Analysis By Commercial Application, 2021 to 2025
- Absolute $ Opportunity Analysis By Commercial Application, 2026 to 2036
- Global Market Analysis and Forecast, By Delivery Format, 2021 to 2036
- Introduction / Key Findings
- Historical Market Size Value (USD Million) Analysis By Delivery Format, 2021 to 2025
- Current and Future Market Size Value (USD Million) Analysis and Forecast By Delivery Format, 2026 to 2036
- Flavored Scoop Pre-Workout Powders
- Compressed Thermogenic Tablets and Capsules
- Ready-to-Drink Liquid Energy Shots
- Effervescent Metabolic Sticks and Gummies
- Y-o-Y Growth Trend Analysis By Delivery Format, 2021 to 2025
- Absolute $ Opportunity Analysis By Delivery Format, 2026 to 2036
- Global Market Analysis and Forecast, By Sales Channel, 2021 to 2036
- Introduction / Key Findings
- Historical Market Size Value (USD Million) Analysis By Sales Channel, 2021 to 2025
- Current and Future Market Size Value (USD Million) Analysis and Forecast By Sales Channel, 2026 to 2036
- Direct to Sports Nutrition and Supplement Contract Manufacturers
- Botanical and Nutraceutical Ingredient Distributors
- Pharmaceutical Fine-Chemical Supply
- Online B2B Bulk Ingredient Marketplaces
- Y-o-Y Growth Trend Analysis By Sales Channel, 2021 to 2025
- Absolute $ Opportunity Analysis By Sales Channel, 2026 to 2036
- Global Market Analysis and Forecast, By Region, 2021 to 2036
- Introduction
- Historical Market Size Value (USD Million) Analysis By Region, 2021 to 2025
- Current Market Size Value (USD Million) Analysis and Forecast By Region, 2026 to 2036
- North America
- Latin America
- Western Europe
- Eastern Europe
- East Asia
- South Asia and Pacific
- Middle East and Africa
- Market Attractiveness Analysis By Region
- North America Market Analysis and Forecast, By Country, 2021 to 2036
- Historical Market Size Value (USD Million) Trend Analysis By Market Taxonomy, 2021 to 2025
- Market Size Value (USD Million) Forecast By Market Taxonomy, 2026 to 2036
- By Country
- United States
- Canada
- By Extraction Source
- By Active Purity
- By Commercial Application
- By Delivery Format
- By Sales Channel
- By Country
- Market Attractiveness Analysis
- By Country
- By Extraction Source
- By Active Purity
- By Commercial Application
- By Delivery Format
- By Sales Channel
- Key Takeaways
- Latin America Market Analysis and Forecast, By Country
- Historical Market Size Value (USD Million) Trend Analysis By Market Taxonomy, 2021 to 2025
- Market Size Value (USD Million) Forecast By Market Taxonomy, 2026 to 2036
- By Country
- Brazil
- Mexico
- Argentina
- Chile
- By Extraction Source
- By Active Purity
- By Commercial Application
- By Delivery Format
- By Sales Channel
- By Country
- Market Attractiveness Analysis
- By Country
- By Extraction Source
- By Active Purity
- By Commercial Application
- By Delivery Format
- By Sales Channel
- Key Takeaways
- Western Europe Market Analysis and Forecast, By Country
- Historical Market Size Value (USD Million) Trend Analysis By Market Taxonomy, 2021 to 2025
- Market Size Value (USD Million) Forecast By Market Taxonomy, 2026 to 2036
- By Country
- Germany
- France
- United Kingdom
- Italy
- Spain
- Benelux
- Nordics
- By Extraction Source
- By Active Purity
- By Commercial Application
- By Delivery Format
- By Sales Channel
- By Country
- Market Attractiveness Analysis
- By Country
- By Extraction Source
- By Active Purity
- By Commercial Application
- By Delivery Format
- By Sales Channel
- Key Takeaways
- Eastern Europe Market Analysis and Forecast, By Country
- Historical Market Size Value (USD Million) Trend Analysis By Market Taxonomy, 2021 to 2025
- Market Size Value (USD Million) Forecast By Market Taxonomy, 2026 to 2036
- By Country
- Poland
- Czech Republic
- Romania
- Hungary
- By Extraction Source
- By Active Purity
- By Commercial Application
- By Delivery Format
- By Sales Channel
- By Country
- Market Attractiveness Analysis
- By Country
- By Extraction Source
- By Active Purity
- By Commercial Application
- By Delivery Format
- By Sales Channel
- Key Takeaways
- East Asia Market Analysis and Forecast, By Country
- Historical Market Size Value (USD Million) Trend Analysis By Market Taxonomy, 2021 to 2025
- Market Size Value (USD Million) Forecast By Market Taxonomy, 2026 to 2036
- By Country
- China
- Japan
- South Korea
- By Extraction Source
- By Active Purity
- By Commercial Application
- By Delivery Format
- By Sales Channel
- By Country
- Market Attractiveness Analysis
- By Country
- By Extraction Source
- By Active Purity
- By Commercial Application
- By Delivery Format
- By Sales Channel
- Key Takeaways
- South Asia and Pacific Market Analysis and Forecast, By Country
- Historical Market Size Value (USD Million) Trend Analysis By Market Taxonomy, 2021 to 2025
- Market Size Value (USD Million) Forecast By Market Taxonomy, 2026 to 2036
- By Country
- India
- ASEAN
- Australia and New Zealand
- By Extraction Source
- By Active Purity
- By Commercial Application
- By Delivery Format
- By Sales Channel
- By Country
- Market Attractiveness Analysis
- By Country
- By Extraction Source
- By Active Purity
- By Commercial Application
- By Delivery Format
- By Sales Channel
- Key Takeaways
- Middle East and Africa Market Analysis and Forecast, By Country
- Historical Market Size Value (USD Million) Trend Analysis By Market Taxonomy, 2021 to 2025
- Market Size Value (USD Million) Forecast By Market Taxonomy, 2026 to 2036
- By Country
- GCC Countries
- South Africa
- Türkiye
- Israel
- By Extraction Source
- By Active Purity
- By Commercial Application
- By Delivery Format
- By Sales Channel
- By Country
- Market Attractiveness Analysis
- By Country
- By Extraction Source
- By Active Purity
- By Commercial Application
- By Delivery Format
- By Sales Channel
- Key Takeaways
- Key Countries Market Analysis
- United States
- Pricing Analysis
- Market Share Analysis, 2025
- By Extraction Source
- By Active Purity
- By Commercial Application
- By Delivery Format
- By Sales Channel
- Canada
- Pricing Analysis
- Market Share Analysis, 2025
- By Extraction Source
- By Active Purity
- By Commercial Application
- By Delivery Format
- By Sales Channel
- Mexico
- Pricing Analysis
- Market Share Analysis, 2025
- By Extraction Source
- By Active Purity
- By Commercial Application
- By Delivery Format
- By Sales Channel
- Brazil
- Pricing Analysis
- Market Share Analysis, 2025
- By Extraction Source
- By Active Purity
- By Commercial Application
- By Delivery Format
- By Sales Channel
- Chile
- Pricing Analysis
- Market Share Analysis, 2025
- By Extraction Source
- By Active Purity
- By Commercial Application
- By Delivery Format
- By Sales Channel
- Germany
- Pricing Analysis
- Market Share Analysis, 2025
- By Extraction Source
- By Active Purity
- By Commercial Application
- By Delivery Format
- By Sales Channel
- United Kingdom
- Pricing Analysis
- Market Share Analysis, 2025
- By Extraction Source
- By Active Purity
- By Commercial Application
- By Delivery Format
- By Sales Channel
- Italy
- Pricing Analysis
- Market Share Analysis, 2025
- By Extraction Source
- By Active Purity
- By Commercial Application
- By Delivery Format
- By Sales Channel
- Spain
- Pricing Analysis
- Market Share Analysis, 2025
- By Extraction Source
- By Active Purity
- By Commercial Application
- By Delivery Format
- By Sales Channel
- France
- Pricing Analysis
- Market Share Analysis, 2025
- By Extraction Source
- By Active Purity
- By Commercial Application
- By Delivery Format
- By Sales Channel
- India
- Pricing Analysis
- Market Share Analysis, 2025
- By Extraction Source
- By Active Purity
- By Commercial Application
- By Delivery Format
- By Sales Channel
- ASEAN
- Pricing Analysis
- Market Share Analysis, 2025
- By Extraction Source
- By Active Purity
- By Commercial Application
- By Delivery Format
- By Sales Channel
- Australia and New Zealand
- Pricing Analysis
- Market Share Analysis, 2025
- By Extraction Source
- By Active Purity
- By Commercial Application
- By Delivery Format
- By Sales Channel
- China
- Pricing Analysis
- Market Share Analysis, 2025
- By Extraction Source
- By Active Purity
- By Commercial Application
- By Delivery Format
- By Sales Channel
- Japan
- Pricing Analysis
- Market Share Analysis, 2025
- By Extraction Source
- By Active Purity
- By Commercial Application
- By Delivery Format
- By Sales Channel
- South Korea
- Pricing Analysis
- Market Share Analysis, 2025
- By Extraction Source
- By Active Purity
- By Commercial Application
- By Delivery Format
- By Sales Channel
- Poland
- Pricing Analysis
- Market Share Analysis, 2025
- By Extraction Source
- By Active Purity
- By Commercial Application
- By Delivery Format
- By Sales Channel
- Hungary
- Pricing Analysis
- Market Share Analysis, 2025
- By Extraction Source
- By Active Purity
- By Commercial Application
- By Delivery Format
- By Sales Channel
- Türkiye
- Pricing Analysis
- Market Share Analysis, 2025
- By Extraction Source
- By Active Purity
- By Commercial Application
- By Delivery Format
- By Sales Channel
- South Africa
- Pricing Analysis
- Market Share Analysis, 2025
- By Extraction Source
- By Active Purity
- By Commercial Application
- By Delivery Format
- By Sales Channel
- Netherlands
- Pricing Analysis
- Market Share Analysis, 2025
- By Extraction Source
- By Active Purity
- By Commercial Application
- By Delivery Format
- By Sales Channel
- United States
- Market Structure Analysis
- Competition Dashboard
- Competition Benchmarking
- Market Share Analysis of Top Players
- By Regional
- By Extraction Source
- By Active Purity
- By Commercial Application
- By Delivery Format
- By Sales Channel
- Emerging Startups
- Innovation Benchmarking
- Competition Analysis
- Competition Deep Dive
- Cargill Incorporated
- Overview
- Product Portfolio
- Profitability by Market Segments
- Sales Footprint
- Strategy Overview
- Marketing Strategy
- Product Strategy
- Channel Strategy
- International Flavors and Fragrances Inc.
- Kerry Group plc
- Ingredion Incorporated
- Tate and Lyle plc
- Roquette Freres SA
- Novonesis
- dsm-firmenich AG
- Archer Daniels Midland Company
- Corbion N.V.
- Bitterness-Control and Pre-Workout Matrix Formulators
- Tablet Compression and Biosolution Specialists
- Cargill Incorporated
- Case Studies
- Success Stories
- Recent Developments
- Competition Deep Dive
- Assumptions & Acronyms Used
List of Tables
- Table 1: Global Market Value (USD Million) Forecast by Region, 2021 to 2036
- Table 2: Global Market Value (USD Million) Forecast by Extraction Source, 2021 to 2036
- Table 3: Global Market Value (USD Million) Forecast by Active Purity, 2021 to 2036
- Table 4: Global Market Value (USD Million) Forecast by Commercial Application, 2021 to 2036
- Table 5: Global Market Value (USD Million) Forecast by Delivery Format, 2021 to 2036
- Table 6: Global Market Value (USD Million) Forecast by Sales Channel, 2021 to 2036
- Table 7: North America Market Value (USD Million) Forecast by Country, 2021 to 2036
- Table 8: North America Market Value (USD Million) Forecast by Extraction Source, 2021 to 2036
- Table 9: North America Market Value (USD Million) Forecast by Active Purity, 2021 to 2036
- Table 10: North America Market Value (USD Million) Forecast by Commercial Application, 2021 to 2036
- Table 11: North America Market Value (USD Million) Forecast by Delivery Format, 2021 to 2036
- Table 12: North America Market Value (USD Million) Forecast by Sales Channel, 2021 to 2036
- Table 13: Latin America Market Value (USD Million) Forecast by Country, 2021 to 2036
- Table 14: Latin America Market Value (USD Million) Forecast by Extraction Source, 2021 to 2036
- Table 15: Latin America Market Value (USD Million) Forecast by Active Purity, 2021 to 2036
- Table 16: Latin America Market Value (USD Million) Forecast by Commercial Application, 2021 to 2036
- Table 17: Latin America Market Value (USD Million) Forecast by Delivery Format, 2021 to 2036
- Table 18: Latin America Market Value (USD Million) Forecast by Sales Channel, 2021 to 2036
- Table 19: Western Europe Market Value (USD Million) Forecast by Country, 2021 to 2036
- Table 20: Western Europe Market Value (USD Million) Forecast by Extraction Source, 2021 to 2036
- Table 21: Western Europe Market Value (USD Million) Forecast by Active Purity, 2021 to 2036
- Table 22: Western Europe Market Value (USD Million) Forecast by Commercial Application, 2021 to 2036
- Table 23: Western Europe Market Value (USD Million) Forecast by Delivery Format, 2021 to 2036
- Table 24: Western Europe Market Value (USD Million) Forecast by Sales Channel, 2021 to 2036
- Table 25: Eastern Europe Market Value (USD Million) Forecast by Country, 2021 to 2036
- Table 26: Eastern Europe Market Value (USD Million) Forecast by Extraction Source, 2021 to 2036
- Table 27: Eastern Europe Market Value (USD Million) Forecast by Active Purity, 2021 to 2036
- Table 28: Eastern Europe Market Value (USD Million) Forecast by Commercial Application, 2021 to 2036
- Table 29: Eastern Europe Market Value (USD Million) Forecast by Delivery Format, 2021 to 2036
- Table 30: Eastern Europe Market Value (USD Million) Forecast by Sales Channel, 2021 to 2036
- Table 31: East Asia Market Value (USD Million) Forecast by Country, 2021 to 2036
- Table 32: East Asia Market Value (USD Million) Forecast by Extraction Source, 2021 to 2036
- Table 33: East Asia Market Value (USD Million) Forecast by Active Purity, 2021 to 2036
- Table 34: East Asia Market Value (USD Million) Forecast by Commercial Application, 2021 to 2036
- Table 35: East Asia Market Value (USD Million) Forecast by Delivery Format, 2021 to 2036
- Table 36: East Asia Market Value (USD Million) Forecast by Sales Channel, 2021 to 2036
- Table 37: South Asia and Pacific Market Value (USD Million) Forecast by Country, 2021 to 2036
- Table 38: South Asia and Pacific Market Value (USD Million) Forecast by Extraction Source, 2021 to 2036
- Table 39: South Asia and Pacific Market Value (USD Million) Forecast by Active Purity, 2021 to 2036
- Table 40: South Asia and Pacific Market Value (USD Million) Forecast by Commercial Application, 2021 to 2036
- Table 41: South Asia and Pacific Market Value (USD Million) Forecast by Delivery Format, 2021 to 2036
- Table 42: South Asia and Pacific Market Value (USD Million) Forecast by Sales Channel, 2021 to 2036
- Table 43: Middle East and Africa Market Value (USD Million) Forecast by Country, 2021 to 2036
- Table 44: Middle East and Africa Market Value (USD Million) Forecast by Extraction Source, 2021 to 2036
- Table 45: Middle East and Africa Market Value (USD Million) Forecast by Active Purity, 2021 to 2036
- Table 46: Middle East and Africa Market Value (USD Million) Forecast by Commercial Application, 2021 to 2036
- Table 47: Middle East and Africa Market Value (USD Million) Forecast by Delivery Format, 2021 to 2036
- Table 48: Middle East and Africa Market Value (USD Million) Forecast by Sales Channel, 2021 to 2036
List of Figures
- Figure 1: Global Market Pricing Analysis
- Figure 2: Global Market Value (USD Million) Forecast 2021-2036
- Figure 3: Global Market Value Share and BPS Analysis by Extraction Source, 2026 and 2036
- Figure 4: Global Market Y-o-Y Growth Comparison by Extraction Source, 2026-2036
- Figure 5: Global Market Attractiveness Analysis by Extraction Source
- Figure 6: Global Market Value Share and BPS Analysis by Active Purity, 2026 and 2036
- Figure 7: Global Market Y-o-Y Growth Comparison by Active Purity, 2026-2036
- Figure 8: Global Market Attractiveness Analysis by Active Purity
- Figure 9: Global Market Value Share and BPS Analysis by Commercial Application, 2026 and 2036
- Figure 10: Global Market Y-o-Y Growth Comparison by Commercial Application, 2026-2036
- Figure 11: Global Market Attractiveness Analysis by Commercial Application
- Figure 12: Global Market Value Share and BPS Analysis by Delivery Format, 2026 and 2036
- Figure 13: Global Market Y-o-Y Growth Comparison by Delivery Format, 2026-2036
- Figure 14: Global Market Attractiveness Analysis by Delivery Format
- Figure 15: Global Market Value Share and BPS Analysis by Sales Channel, 2026 and 2036
- Figure 16: Global Market Y-o-Y Growth Comparison by Sales Channel, 2026-2036
- Figure 17: Global Market Attractiveness Analysis by Sales Channel
- Figure 18: Global Market Value (USD Million) Share and BPS Analysis by Region, 2026 and 2036
- Figure 19: Global Market Y-o-Y Growth Comparison by Region, 2026-2036
- Figure 20: Global Market Attractiveness Analysis by Region
- Figure 21: North America Market Incremental Dollar Opportunity, 2026-2036
- Figure 22: Latin America Market Incremental Dollar Opportunity, 2026-2036
- Figure 23: Western Europe Market Incremental Dollar Opportunity, 2026-2036
- Figure 24: Eastern Europe Market Incremental Dollar Opportunity, 2026-2036
- Figure 25: East Asia Market Incremental Dollar Opportunity, 2026-2036
- Figure 26: South Asia and Pacific Market Incremental Dollar Opportunity, 2026-2036
- Figure 27: Middle East and Africa Market Incremental Dollar Opportunity, 2026-2036
- Figure 28: North America Market Value Share and BPS Analysis by Country, 2026 and 2036
- Figure 29: North America Market Value Share and BPS Analysis by Extraction Source, 2026 and 2036
- Figure 30: North America Market Y-o-Y Growth Comparison by Extraction Source, 2026-2036
- Figure 31: North America Market Attractiveness Analysis by Extraction Source
- Figure 32: North America Market Value Share and BPS Analysis by Active Purity, 2026 and 2036
- Figure 33: North America Market Y-o-Y Growth Comparison by Active Purity, 2026-2036
- Figure 34: North America Market Attractiveness Analysis by Active Purity
- Figure 35: North America Market Value Share and BPS Analysis by Commercial Application, 2026 and 2036
- Figure 36: North America Market Y-o-Y Growth Comparison by Commercial Application, 2026-2036
- Figure 37: North America Market Attractiveness Analysis by Commercial Application
- Figure 38: North America Market Value Share and BPS Analysis by Delivery Format, 2026 and 2036
- Figure 39: North America Market Y-o-Y Growth Comparison by Delivery Format, 2026-2036
- Figure 40: North America Market Attractiveness Analysis by Delivery Format
- Figure 41: North America Market Value Share and BPS Analysis by Sales Channel, 2026 and 2036
- Figure 42: North America Market Y-o-Y Growth Comparison by Sales Channel, 2026-2036
- Figure 43: North America Market Attractiveness Analysis by Sales Channel
- Figure 44: Latin America Market Value Share and BPS Analysis by Country, 2026 and 2036
- Figure 45: Latin America Market Value Share and BPS Analysis by Extraction Source, 2026 and 2036
- Figure 46: Latin America Market Y-o-Y Growth Comparison by Extraction Source, 2026-2036
- Figure 47: Latin America Market Attractiveness Analysis by Extraction Source
- Figure 48: Latin America Market Value Share and BPS Analysis by Active Purity, 2026 and 2036
- Figure 49: Latin America Market Y-o-Y Growth Comparison by Active Purity, 2026-2036
- Figure 50: Latin America Market Attractiveness Analysis by Active Purity
- Figure 51: Latin America Market Value Share and BPS Analysis by Commercial Application, 2026 and 2036
- Figure 52: Latin America Market Y-o-Y Growth Comparison by Commercial Application, 2026-2036
- Figure 53: Latin America Market Attractiveness Analysis by Commercial Application
- Figure 54: Latin America Market Value Share and BPS Analysis by Delivery Format, 2026 and 2036
- Figure 55: Latin America Market Y-o-Y Growth Comparison by Delivery Format, 2026-2036
- Figure 56: Latin America Market Attractiveness Analysis by Delivery Format
- Figure 57: Latin America Market Value Share and BPS Analysis by Sales Channel, 2026 and 2036
- Figure 58: Latin America Market Y-o-Y Growth Comparison by Sales Channel, 2026-2036
- Figure 59: Latin America Market Attractiveness Analysis by Sales Channel
- Figure 60: Western Europe Market Value Share and BPS Analysis by Country, 2026 and 2036
- Figure 61: Western Europe Market Value Share and BPS Analysis by Extraction Source, 2026 and 2036
- Figure 62: Western Europe Market Y-o-Y Growth Comparison by Extraction Source, 2026-2036
- Figure 63: Western Europe Market Attractiveness Analysis by Extraction Source
- Figure 64: Western Europe Market Value Share and BPS Analysis by Active Purity, 2026 and 2036
- Figure 65: Western Europe Market Y-o-Y Growth Comparison by Active Purity, 2026-2036
- Figure 66: Western Europe Market Attractiveness Analysis by Active Purity
- Figure 67: Western Europe Market Value Share and BPS Analysis by Commercial Application, 2026 and 2036
- Figure 68: Western Europe Market Y-o-Y Growth Comparison by Commercial Application, 2026-2036
- Figure 69: Western Europe Market Attractiveness Analysis by Commercial Application
- Figure 70: Western Europe Market Value Share and BPS Analysis by Delivery Format, 2026 and 2036
- Figure 71: Western Europe Market Y-o-Y Growth Comparison by Delivery Format, 2026-2036
- Figure 72: Western Europe Market Attractiveness Analysis by Delivery Format
- Figure 73: Western Europe Market Value Share and BPS Analysis by Sales Channel, 2026 and 2036
- Figure 74: Western Europe Market Y-o-Y Growth Comparison by Sales Channel, 2026-2036
- Figure 75: Western Europe Market Attractiveness Analysis by Sales Channel
- Figure 76: Eastern Europe Market Value Share and BPS Analysis by Country, 2026 and 2036
- Figure 77: Eastern Europe Market Value Share and BPS Analysis by Extraction Source, 2026 and 2036
- Figure 78: Eastern Europe Market Y-o-Y Growth Comparison by Extraction Source, 2026-2036
- Figure 79: Eastern Europe Market Attractiveness Analysis by Extraction Source
- Figure 80: Eastern Europe Market Value Share and BPS Analysis by Active Purity, 2026 and 2036
- Figure 81: Eastern Europe Market Y-o-Y Growth Comparison by Active Purity, 2026-2036
- Figure 82: Eastern Europe Market Attractiveness Analysis by Active Purity
- Figure 83: Eastern Europe Market Value Share and BPS Analysis by Commercial Application, 2026 and 2036
- Figure 84: Eastern Europe Market Y-o-Y Growth Comparison by Commercial Application, 2026-2036
- Figure 85: Eastern Europe Market Attractiveness Analysis by Commercial Application
- Figure 86: Eastern Europe Market Value Share and BPS Analysis by Delivery Format, 2026 and 2036
- Figure 87: Eastern Europe Market Y-o-Y Growth Comparison by Delivery Format, 2026-2036
- Figure 88: Eastern Europe Market Attractiveness Analysis by Delivery Format
- Figure 89: Eastern Europe Market Value Share and BPS Analysis by Sales Channel, 2026 and 2036
- Figure 90: Eastern Europe Market Y-o-Y Growth Comparison by Sales Channel, 2026-2036
- Figure 91: Eastern Europe Market Attractiveness Analysis by Sales Channel
- Figure 92: East Asia Market Value Share and BPS Analysis by Country, 2026 and 2036
- Figure 93: East Asia Market Value Share and BPS Analysis by Extraction Source, 2026 and 2036
- Figure 94: East Asia Market Y-o-Y Growth Comparison by Extraction Source, 2026-2036
- Figure 95: East Asia Market Attractiveness Analysis by Extraction Source
- Figure 96: East Asia Market Value Share and BPS Analysis by Active Purity, 2026 and 2036
- Figure 97: East Asia Market Y-o-Y Growth Comparison by Active Purity, 2026-2036
- Figure 98: East Asia Market Attractiveness Analysis by Active Purity
- Figure 99: East Asia Market Value Share and BPS Analysis by Commercial Application, 2026 and 2036
- Figure 100: East Asia Market Y-o-Y Growth Comparison by Commercial Application, 2026-2036
- Figure 101: East Asia Market Attractiveness Analysis by Commercial Application
- Figure 102: East Asia Market Value Share and BPS Analysis by Delivery Format, 2026 and 2036
- Figure 103: East Asia Market Y-o-Y Growth Comparison by Delivery Format, 2026-2036
- Figure 104: East Asia Market Attractiveness Analysis by Delivery Format
- Figure 105: East Asia Market Value Share and BPS Analysis by Sales Channel, 2026 and 2036
- Figure 106: East Asia Market Y-o-Y Growth Comparison by Sales Channel, 2026-2036
- Figure 107: East Asia Market Attractiveness Analysis by Sales Channel
- Figure 108: South Asia and Pacific Market Value Share and BPS Analysis by Country, 2026 and 2036
- Figure 109: South Asia and Pacific Market Value Share and BPS Analysis by Extraction Source, 2026 and 2036
- Figure 110: South Asia and Pacific Market Y-o-Y Growth Comparison by Extraction Source, 2026-2036
- Figure 111: South Asia and Pacific Market Attractiveness Analysis by Extraction Source
- Figure 112: South Asia and Pacific Market Value Share and BPS Analysis by Active Purity, 2026 and 2036
- Figure 113: South Asia and Pacific Market Y-o-Y Growth Comparison by Active Purity, 2026-2036
- Figure 114: South Asia and Pacific Market Attractiveness Analysis by Active Purity
- Figure 115: South Asia and Pacific Market Value Share and BPS Analysis by Commercial Application, 2026 and 2036
- Figure 116: South Asia and Pacific Market Y-o-Y Growth Comparison by Commercial Application, 2026-2036
- Figure 117: South Asia and Pacific Market Attractiveness Analysis by Commercial Application
- Figure 118: South Asia and Pacific Market Value Share and BPS Analysis by Delivery Format, 2026 and 2036
- Figure 119: South Asia and Pacific Market Y-o-Y Growth Comparison by Delivery Format, 2026-2036
- Figure 120: South Asia and Pacific Market Attractiveness Analysis by Delivery Format
- Figure 121: South Asia and Pacific Market Value Share and BPS Analysis by Sales Channel, 2026 and 2036
- Figure 122: South Asia and Pacific Market Y-o-Y Growth Comparison by Sales Channel, 2026-2036
- Figure 123: South Asia and Pacific Market Attractiveness Analysis by Sales Channel
- Figure 124: Middle East and Africa Market Value Share and BPS Analysis by Country, 2026 and 2036
- Figure 125: Middle East and Africa Market Value Share and BPS Analysis by Extraction Source, 2026 and 2036
- Figure 126: Middle East and Africa Market Y-o-Y Growth Comparison by Extraction Source, 2026-2036
- Figure 127: Middle East and Africa Market Attractiveness Analysis by Extraction Source
- Figure 128: Middle East and Africa Market Value Share and BPS Analysis by Active Purity, 2026 and 2036
- Figure 129: Middle East and Africa Market Y-o-Y Growth Comparison by Active Purity, 2026-2036
- Figure 130: Middle East and Africa Market Attractiveness Analysis by Active Purity
- Figure 131: Middle East and Africa Market Value Share and BPS Analysis by Commercial Application, 2026 and 2036
- Figure 132: Middle East and Africa Market Y-o-Y Growth Comparison by Commercial Application, 2026-2036
- Figure 133: Middle East and Africa Market Attractiveness Analysis by Commercial Application
- Figure 134: Middle East and Africa Market Value Share and BPS Analysis by Delivery Format, 2026 and 2036
- Figure 135: Middle East and Africa Market Y-o-Y Growth Comparison by Delivery Format, 2026-2036
- Figure 136: Middle East and Africa Market Attractiveness Analysis by Delivery Format
- Figure 137: Middle East and Africa Market Value Share and BPS Analysis by Sales Channel, 2026 and 2036
- Figure 138: Middle East and Africa Market Y-o-Y Growth Comparison by Sales Channel, 2026-2036
- Figure 139: Middle East and Africa Market Attractiveness Analysis by Sales Channel
- Figure 140: Global Market - Tier Structure Analysis
- Figure 141: Global Market - Company Share Analysis
Frequently Asked Questions
How big is the synephrine market in 2026, and what is forecast for 2036?
Global synephrine market valuation stood at USD 641.5 million in 2025 and reached USD 675.0 million in 2026. Total industry size will reach USD 1,153.0 million by 2036 as sports nutrition and metabolic supplement brands scale compliant botanical thermogenic formulations.
What is the CAGR for the synephrine market from 2026 to 2036?
The synephrine sector will progress at a 5.5% CAGR from 2026 to 2036, creating USD 478.0 million in incremental value across pre-workout powders and thermogenic energy shots.
Which extraction source segment leads the synephrine market?
Bitter Orange Citrus aurantium Unripe Fruit Extract captures 59.0% of 2026 extraction source demand because dietary supplement laws in major markets require natural botanical origin rather than synthetic chemical salts.
Which active purity segment leads the synephrine market?
Standardized 6% to 30% Botanical p-Synephrine Powder represents 62.7% of active purity demand in 2026 as spray-dried carrier powders blend homogeneously into multi-gram pre-workout canisters.
Which country has a notable growth outlook during the assessment period?
The United States tops national growth forecasts at a 6.2% CAGR through 2036, driven by DSHEA-compliant pre-workout powder innovation and zero-sugar thermogenic energy beverages.
Who are the key players in the market?
Cargill Incorporated and Kerry Group plc lead commercial supply with International Flavors and Fragrances Inc. and Ingredion Incorporated. Tate and Lyle plc and Novonesis also compete with Roquette Freres SA, dsm-firmenich AG, Archer Daniels Midland Company and Corbion N.V.
Preview the report firsthand - request a free sample
Get SampleGet the brochure for pricing and purchase details.
Get PDF
