
- Market Size (2026)
- USD 1570.0 Mn
- Forecast (2036)
- USD 2680.0 Mn
- CAGR (2026 to 2036)
- 5.5%
How big is the Poultry Meal Market in 2026?
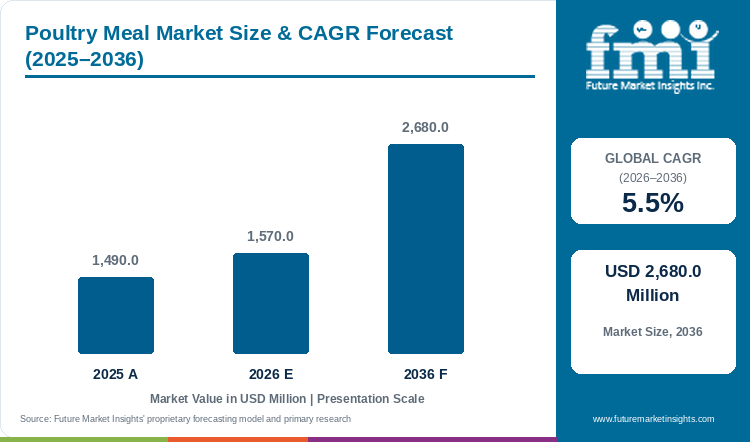
The Poultry Meal Market is projected to reach USD 2,680.0 million by 2036, growing at a 5.5% CAGR from 2026 to 2036. FMI estimates the market at USD 1,570.0 million in 2026, up from USD 1,490.0 million in 2025.
Poultry meal is a by-product of chicken slaughter, so supply follows broiler output. USDA's June 2026 outlook puts US broiler production at 49,146 million pounds for 2026, up 2.4% from 2025. First-quarter 2026 production rose 3.7% to 11,966 million pounds. Price depends on competing proteins, and tight fishmeal supply has kept US poultry meal near historic highs.
Four producers hold most of the raw material that poultry meal depends on. The United States, China, Brazil and the European Union produced 66.0 million tonnes of chicken meat in 2025. Worldwide output was 108.4 million tonnes in 2025. Brazil alone held 35% of world chicken meat exports and the United States held 21%. Rendering follows slaughter, so meal supply grows where integrated plants add capacity. USDA expects China to reach 18.0 million tonnes in 2026, which is 9% above 2025.
Key Market Trends & Insights
- Buyers are using more poultry by-product meal as fishmeal supply tightens. The price for pet-food-grade meal in the pet food market reached USD 975 per short ton on 9 September 2026.
- Rendered ingredients are being defended as part of pet food sourcing. The North American Renderers Association research arm released work with feed and pet food bodies on the role of rendered ingredients in pet food, and rendered poultry meal, part of the rendered poultry products market, is increasingly framed as a recycled and traceable protein.
- Raw material supply is growing, with total US poultry by-product production in 2025 at 8.7% above 2024. More supply usually caps prices for lower grades, while pet-grade lots keep a premium.
Regional Highlights
- In North America, large poultry integrators are the main raw material owners. Tyson guided fiscal 2026 chicken adjusted operating income at USD 1,250.0 million to USD 1,500.0 million in November 2025. It raised that range to USD 1,900.0 million to USD 2,050.0 million in August 2026. USDA's fiscal 2026 chicken production projection rose from about 1% to about 3% growth over that period.
- In Europe, poultry is the only meat expected to expand over the next decade, but prices face pressure. The EU Agricultural Outlook 2025 to 2035 expects poultry and eggs to grow in production and consumption, while the Commission has flagged downward pressure on poultry prices from slowing consumption and Brazilian and US competition.
- In Asia and South America, output is growing faster, led by China, a record export volume of Brazilian chicken and expected revenue growth of 4% to 6% in India's poultry sector in 2025-26.
Poultry Meal Market Size and Forecast
Table 1: Poultry Meal Market Size and Forecast
| Market size and forecast | Value |
|---|---|
| Market size in 2025 | USD 1,490.0 million |
| Estimated market size in 2026 | USD 1,570.0 million |
| Projected market size by 2036 | USD 2,680.0 million |
| CAGR from 2026 to 2036 | 5.5% |
Source: Future Market Insights analysis of the poultry meal market, 2026.
Analyst Perspective
“Poultry meal is a by-product, so supply follows chicken slaughter, and buyers decide on price per tonne of protein against fishmeal and soybean meal. Pet food buyers pay more for consistent, traceable lots, while feed buyers buy mainly on price. Renderers tied to large integrators can secure raw material, but disease outbreaks and trade bans can interrupt it quickly.”
- Nandini Roy Choudhury, Principal Analyst at Future Market Insights
How is the Poultry Meal Market segmented?
- By end use: Pet Food, Poultry Feed, Aquaculture Feed, Livestock Feed.
- By product type: Poultry By-product Meal, Poultry Meal (Clean Chicken Meal), Other Poultry Meals.
- By source: Chicken, Turkey, Duck and Other Poultry.
- By packaging: Bulk, Up to 1,000 kg Totes, Up to 50 kg Bags.
- By region: North America, Latin America, Europe, East Asia, South Asia, Oceania, Middle East and Africa.
Why does Pet Food lead by End Use in the Poultry Meal Market in 2026?
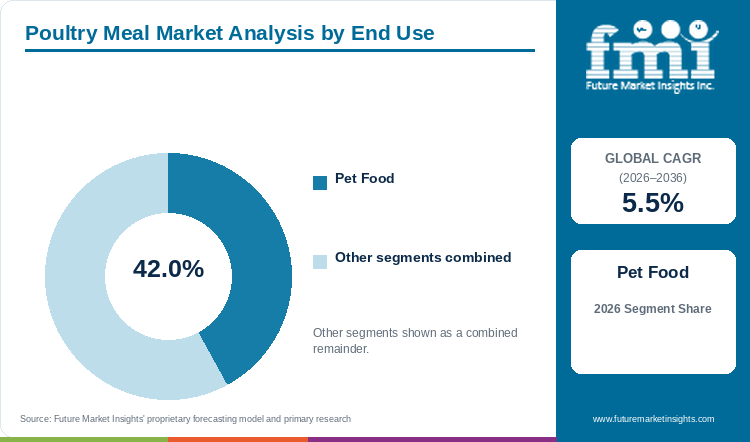
Pet food holds 42.0% of the Poultry Meal Market by end use in 2026.
Pet food manufacturers require consistent protein and ash levels and traceable lots, so they buy higher grades than feed mills. Fastmarkets assessed pet-food-grade poultry by-product meal at USD 975 per short ton on 9 September 2026. Poultry feed, aquaculture feed and livestock feed hold the remaining 58.0%. Aquaculture feed competes directly with fishmeal in the aquafeed market. Livestock and poultry feed use is more price-sensitive and varies by country rules on feeding animal protein.
Table 2: End Use, 2026 Share
| Leading Share | 2026 market share |
|---|---|
| Pet Food | 42.0% |
| All Other Segments Combined Share | 58.0% |
Source: Future Market Insights analysis of the poultry meal market, 2026.
Why does Poultry By-product Meal lead by Product Type in the Poultry Meal Market in 2026?
Poultry by-product meal holds 60.0% of the Poultry Meal Market by product type in 2026.
It is made from the inedible parts collected at slaughter plants, so its volume follows slaughter output directly. Trade press explains that poultry by-product meal and poultry meal are different products, with by-product meal allowed to include viscera and other parts. Poultry meal made mainly from clean meat and bone, and other meals, hold the remaining 40.0%. Clean poultry meal is sold at a premium to pet food makers who specify lower ash and higher protein, and its volume is limited by the share of carcasses that can be diverted to that grade.
Table 3: Product Type, 2026 Share
| Leading Share | 2026 market share |
|---|---|
| Poultry By-product Meal | 60.0% |
| All Other Segments Combined Share | 40.0% |
Source: Future Market Insights analysis of the poultry meal market, 2026.
Why does Chicken lead by Source in the Poultry Meal Market in 2026?
Chicken accounts for 85.0% of the Poultry Meal Market by source in 2026.
Chicken is the volume leader in poultry meat almost everywhere. In Germany, broiler chicken output was 1.1 million tonnes in 2025, up 3.6%, against 376,800 tonnes of turkey, down 7.7%. Turkey, duck and other poultry hold the remaining 15.0%. Turkey output is falling in Germany, and other species are regional and small.
Table 4: Source, 2026 Share
| Leading Share | 2026 market share |
|---|---|
| Chicken | 85.0% |
| All Other Segments Combined Share | 15.0% |
Source: Future Market Insights analysis of the poultry meal market, 2026.
Why does Bulk lead by Packaging in the Poultry Meal Market in 2026?
Bulk shipments hold 50.0% of the Poultry Meal Market by packaging in 2026.
Feed mills and large pet food plants buy by the truckload or in containers. Most volume moves between integrated producers and mills. Integrated producers run very large slaughter volumes, which creates large lots of meal. Totes and bags hold the remaining 50.0% combined. They suit smaller buyers, export lots and pet food makers that need labelled batches.
Table 5: Packaging, 2026 Share
| Leading Share | 2026 market share |
|---|---|
| Bulk | 50.0% |
| All Other Segments Combined Share | 50.0% |
Source: Future Market Insights analysis of the poultry meal market, 2026.
What are the key drivers, restraints and opportunities?
Driver
Rising poultry slaughter. More birds mean more by-product. USDA raised its 2026 broiler forecast to 49,146 million pounds. China's poultry output continued to rise in 2025. The EU Commission expects 2026 poultry output to grow.
Tight fishmeal and firm protein prices. Poultry meal gains when fishmeal is scarce, because buyers use more alternative proteins.
Restraint
Disease and trade bans. Avian influenza can interrupt exports and raw material flow, and meal supply follows the same disruption. Brazil confirmed its first commercial outbreak on 15 May 2025, and full trade resumed on 26 December 2025.
Weak poultry prices and margins. Lower bird prices cut integrator income and can reduce investment in rendering, as Venky's India reported poultry sales down 18.6% in the quarter to September 2025 on weak bird prices. The EU has flagged the same downward price pressure.
Opportunity
Premium pet-grade and clean meal. Traceable, consistent lots earn more per tonne, and renderers with food-grade controls can sell into the pet-grade segment.
Integrator-owned rendering capacity. Large integrators capture more value by processing their own by-products. Darling Ingredients reported 2025 Feed Ingredients net sales of USD 3,990.1 million, up from USD 3,675.6 million in 2024.
Poultry Meal Market by Country (2026 to 2036)
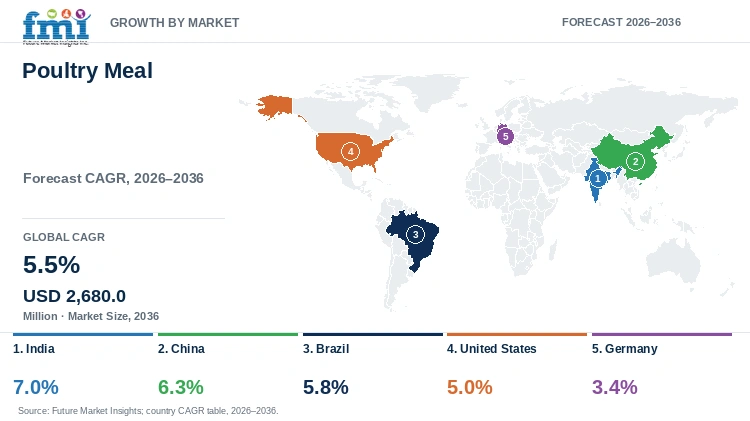
Table 6: Poultry Meal Market Country Growth Forecast
| Country | CAGR, 2026 to 2036 |
|---|---|
| India | 7.0% |
| China | 6.3% |
| Brazil | 5.8% |
| United States | 5.0% |
| Germany | 3.4% |
Source: Future Market Insights analysis of the poultry meal market, 2026.
India
India has the fastest growth of the profiled countries. The poultry sector is expected to grow revenue 4% to 6% in 2025-26, and integrated firms hold a rising share of organised production. Venky's India's oilseed business grew 33.6% in the quarter to September 2025 on steady feed ingredient demand, even as poultry sales fell, so a 7.0% CAGR for 2026 to 2036 reflects a low starting base and expanding feed and pet food demand.
Raw material supply, not demand, holds poultry meal growth in India below pet food growth. Pet food retail sales reached USD 769.7 million in 2025, with 11.7% yearly growth forecast to 2030. Brazil is the only other profiled country above 11%, at 12.5%. Dog food holds 70% of sales, and cat food grew 31.1% a year from 2020 to 2025. Chicken meat is among the leading ingredients in Indian pet food launches.
A 2024 Reserve Bank of India paper reports that wet markets sell 95% of broiler production. Birds are culled there and raw meat is sold to consumers. Only 5% of poultry meat is processed into value-added products. Organised processing is one constraint on how much offal and feathers renderers can collect. Integrators supply 65% to 70% of commercial broiler production under contract farming. A 100% basic customs duty on frozen cuts and offal limits imports. Exports were only about 3 tonnes in 2022-23, so domestic slaughter sets raw material supply. Pet food makers that need traceable meal therefore depend on plants in the 5% processed share.
China
China produced 28.37 million tonnes of poultry meat in 2025, up 6.7%. Poultry meat output rose 9.3% year on year in the first three quarters of 2026. The 6.3% CAGR for 2026 to 2036 assumes that growth slows from that pace.
Slaughter capacity, not pet food, drives the Chinese rate. USDA forecasts chicken meat output at 18.0 million tonnes in 2026 and 19.0 million tonnes in 2027. That is growth of 9% in 2026 and nearly 6% in 2027. USDA covers chicken meat only, so its totals sit below the national poultry meat figure. Large integrated producers are investing in breeding, hatching, slaughtering and further processing. Chicken exports are forecast to rise from 1.1 million tonnes in 2025 to 1.9 million tonnes in 2027. Exports leave from processing plants, so higher volumes add to by-products collected at large sites.
Pet food contributes less to the Chinese rate. Retail pet food sales reached USD 7.6 billion in 2025 after growing 2.0% a year since 2021. Agriculture and Agri-Food Canada reports a forecast of 3.9% a year to 2030 against 11.7% for India. China banned Canadian pet food containing poultry after the avian influenza outbreaks of late 2021 and early 2022. Canadian exports to China fell from USD 182.0 million in 2021 to USD 7.2 million in 2025. China's dog and cat food imports fell 4.9% a year over that period as domestic production rose. Local meal producers therefore capture pet food growth that imports no longer supply.
Brazil
Brazil exported a record 5.324 million tonnes of chicken in 2025, although export revenue fell 1.4% to USD 9.8 billion. A 5.8% CAGR for 2026 to 2036 reflects rising volume but exposure to disease-related bans. Exports to China rose 67.2% from January to August 2026 against the same period of 2025.
Pet food demand is growing faster than chicken output. Retail pet food sales are forecast to grow 12.5% a year to 2030. USDA expects chicken output to reach 16.3 million tonnes in 2027 from 15.45 million tonnes in 2025. The South produces 59% of national chicken meat and Paraná alone 36.1%. Renderers in Paraná and the South therefore have the shortest haul to most of the raw material.
Export exposure sets the downside for Brazilian meal suppliers. Shipments of 4.97 million tonnes in 2025 were 32% of output, against 14% in the United States. The European Union took 5% of Brazilian exports in 2025 and nearly 8% from January to September 2026. Brazil lost EU eligibility for poultry and other animal-origin products on 3 September 2026. USDA assumes the EU stays closed to Brazilian poultry through 2027. Brazil has 82 plants authorised to export poultry products to China, and 30 of them are in Paraná. Brazil opened 12 poultry-related markets from January to July 2026, covering products that include poultry meal. Exporters therefore depend on those new markets to offset lost EU access.
United States
US broiler production is forecast to reach 49,600 million pounds in 2027, up 0.9%. That would mark a 15th consecutive year of growth. A 5.0% CAGR for 2026 to 2036 reflects slow volume growth with pricing support from pet food.
Domestic demand absorbs most US output, which keeps by-products at home. USDA reports 2025 production of 21.8 million tonnes and domestic use of 18.8 million tonnes, or 86% of output. Exports were 3.0 million tonnes in 2025. The United States supplied 26% of world chicken exports in 2020 and 21% in 2025. USDA forecasts 19% for 2027 and cites weak price competitiveness and lingering avian influenza restrictions.
Pet food and pricing shape the US rate more than tonnage does. The United States leads global pet food retail sales at USD 60.3 billion in 2025. Growth of 4.9% a year is forecast to 2030. That is close to the 5.0% poultry meal CAGR. USDA expects chicken output to rise from 21.8 million tonnes in 2025 to 22.8 million tonnes in 2027. That is growth of 4.5% over two years, so price and mix must supply the remaining growth. The closest USDA price series is feather meal, a related poultry by-product. Asking prices averaged USD 512.50 per short ton in Arkansas in the last week of October 2026. A year earlier they averaged USD 337.50, so prices are up 51.9%. Feather meal sellers benefit from firmer prices while buyers face higher input costs.
Germany
German poultry meat output was flat at 1.6 million tonnes in 2025, with chicken up 3.6% and turkey down 7.7%. Because the EU expects slow poultry growth and price pressure, a 3.4% CAGR for 2026 to 2036 is the lowest of the profiled group.
Permitting and import competition limit German chicken output. USDA analysts expect chicken meat production to grow by less than 1.5% in 2026 and 2027. They name difficulty in obtaining permits for new sheds as a significant limit. The European Union as a whole is forecast to grow 3.4% in 2026 and 2% in 2027. German processors imported live chickens, mostly from the Netherlands, for up to 6% of slaughters in 2025. That practice ended in the first half of 2026, mainly for logistical reasons.
Price differences add pressure on processors, since German chicken costs EUR 2 per kilo more than Polish chicken on average. Polish shipments to other member states have even displaced Brazilian imports. The revised Industrial Emissions Directive covers broiler farms above 280 livestock units and adds permitting conditions. Pet food offers little offset, with sales of prepared pet food up only 0.3% to EUR 4.3 billion in 2025. Cat food grew 1.3% while wet and dry dog food both declined. German meal supply therefore depends on slaughter volumes that permits and Polish competition both hold down.
Who are the notable companies in the Poultry Meal Market?
Notable companies in the Poultry Meal Market include Darling Ingredients and Tyson Foods. MBRF Global Foods, Venky's and Baker Commodities are also profiled.
Raw material access separates poultry meal suppliers before grade or price does. Integrated producers own the birds, while renderers must contract for by-products from plants they do not own. Tyson Foods represents the integrated position in the United States. Its third-quarter fiscal 2026 sales were USD 13,868.0 million. Adjusted operating income rose 8% to USD 547.0 million. Its chief executive cited seven consecutive quarters of growth in Chicken.
Outside the United States, MBRF Global Foods and Venky's are integrated producers with different exposures. In the Gulf, MBRF operates three chicken processing plants, two in Saudi Arabia and one in the United Arab Emirates. In October 2025 it formed Sadia Halal with the Saudi Investment Fund in a venture valued at USD 2,070.0 million. It is also investing USD 160.0 million in a Jeddah plant for 40,000 tons per year. Venky's reported that poultry sales fell 18.6% in the quarter to September 2025 on weak bird prices, while oilseed sales grew 33.6%.
Renderers earn their return from by-products, not from live birds. Darling Ingredients reported 2025 Feed Ingredients net sales of USD 3,990.1 million, up from USD 3,675.6 million in 2024. It bought three Brazilian rendering facilities from the Patense Group in the second quarter of 2026. Baker Commodities agreed in a 2024 settlement to stop rendering at its Vernon, California plant, which had ceased operations in 2022. Pet-grade lots keep a premium over lower grades while by-product supply grows.
Key Developments in the Poultry Meal Market
- In August 2026, Tyson Foods Inc. raised its fiscal 2026 Chicken segment adjusted operating income outlook to USD 1,900.0 million to USD 2,050.0 million, reflecting performance across seven consecutive quarters of Chicken segment growth. The revised range was up from USD 1,250.0 million to USD 1,500.0 million guided in November 2025, with third-quarter fiscal 2026 Chicken segment adjusted operating income reaching USD 547.0 million [25].
- In the second quarter of 2026, Darling Ingredients Inc. completed the acquisition of three rendering facilities in Brazil from the Patense Group, extending its South American footprint in the poultry by-product rendering segment. The total purchase price was approximately USD 122.0 million, as stated in the company’s second-quarter 2026 earnings release [27].
Key Players in the Poultry Meal Market
- Darling Ingredients Inc.
- Tyson Foods, Inc.
- MBRF Global Foods Company
- Venky's (India) Limited
- Baker Commodities Inc.
Poultry Meal Market Report Scope
Table 7: Poultry Meal Market Report Scope
| Coverage field | Report scope |
|---|---|
| Market definition | Dry rendered meal made from poultry carcass parts and slaughter by-products, excluding feathers, sold for pet food, poultry feed, aquaculture feed and livestock feed, valued at manufacturer selling prices. |
| End Use | Pet Food; Poultry Feed; Aquaculture Feed; Livestock Feed |
| Product Type | Poultry By-product Meal; Poultry Meal (Clean Chicken Meal); Other Poultry Meals |
| Source | Chicken; Turkey; Duck and Other Poultry |
| Packaging | Bulk; Up to 1,000 kg Totes; Up to 50 kg Bags |
| Regions and profiled countries | North America, Latin America, Europe, East Asia, South Asia, Oceania, Middle East and Africa. Profiled countries: India, China, Brazil, United States, Germany |
| Companies covered | Darling Ingredients Inc.; Tyson Foods, Inc.; MBRF Global Foods Company; Venky's (India) Limited; Baker Commodities Inc. |
| Quantitative Units | USD million |
Poultry Meal Market by Segments
Poultry Meal Market segmented by End Use:
- Pet Food
- Poultry Feed
- Aquaculture Feed
- Livestock Feed
Poultry Meal Market segmented by Product Type:
- Poultry By-product Meal
- Poultry Meal (Clean Chicken Meal)
- Other Poultry Meals
Poultry Meal Market segmented by Source:
- Chicken
- Turkey
- Duck and Other Poultry
Poultry Meal Market segmented by Packaging:
- Bulk
- Up to 1,000 kg Totes
- Up to 50 kg Bags
Poultry Meal Market by Region
- North America
- Latin America
- Europe
- East Asia
- South Asia
- Oceania
- Middle East
- Africa
- India
- China
- Brazil
- United States
- Germany
Research Sources and Bibliography
- [1] Fastmarkets. US poultry meal prices trade near historic highs as fishmeal remains tight. https://www.fastmarkets.com/insights/us-poultry-meal-prices-trade-near-historic-highs-as-fishmeal-remains-tight/
- [2] Fastmarkets. (2026, March 18). Feed and Pet Food Webinar Master Deck. https://www.fastmarkets.com/uploads/2026/03/Feed-and-Pet-Food-Webinar-Master-Deck-18.3.26.pdf
- [3] Animal Health Digest. NARA research on the role of rendered ingredients in pet food. https://animalhealthdigest.com/tag/nara
- [4] Tyson Foods, Inc. (2025, November 10). Tyson Foods Reports Fourth Quarter and Fiscal 2025 Results. https://www.tysonfoods.com/news/news-releases/2025/11/tyson-foods-reports-fourth-quarter-2025-results
- [5] The Poultry Site. (2026, June). USDA forecast for broiler production raised for 2026. https://www.thepoultrysite.com/news/2026/06/usda-forecast-for-broiler-production-raised-for-2026
- [6] Zootecnica International. EU poultry sector outlook to 2035: production, consumption and trade trends. https://zootecnicainternational.com/featured/eu-poultry-egg-outlook-2025-2035/
- [7] Poultry News. EC issues warning of downward pressure on poultry meat prices. https://www.poultrynews.co.uk/business-politics/business/ec-issues-warning-of-downward-pressure-on-poultry-meat-prices.html
- [8] National Bureau of Statistics of China. (2026, February 28). Statistical Communique of the People's Republic of China on the 2025 National Economic and Social Development. https://www.stats.gov.cn/sj/zxfb/202602/t20260228_1962662.html
- [9] The Poultry Site. (2026, January). Brazil chicken exports hit record in 2025 - ABPA. https://www.thepoultrysite.com/news/2026/01/brazil-chicken-exports-hit-record-in-2025-abpa
- [10] IANS. (2025, November 11). India's poultry sector likely to record 4-6 per cent revenue growth in 2025-26 as demand rises. https://ianslive.in/poultry-sector-likely-to-record-4-6-per-cent-revenue-growth-in-2025-26-as-demand-rises-report--20251111130005
- [11] Pet Food Industry. Poultry by-product meal and poultry meal: is there a difference? https://www.petfoodindustry.com/articles/3817-poultry-by-product-meal-and-poultry-meal-is-there-a-difference
- [12] topagrar. (2026, February). Fleischproduktion im Jahr 2025 nahezu unveraendert (Destatis data). https://www.topagrar.com/markt/news/fleischproduktion-im-jahr-2025-nahezu-unverandert-b-20023304.html
- [13] Food Business Africa and Middle East. Venky's India swings to a loss in second quarter on weak poultry pricing. https://www.foodbusinessmea.com/?p=2153759
- [14] Darling Ingredients Inc. (2026, February 11). Darling Ingredients Inc. Reports Fourth Quarter and Fiscal Year 2025 Results. https://www.darlingii.com/media/news/20260211-darling-ingredients-inc-reports-fourth-quarter-2025-results
- [15] South Coast Air Quality Management District. (2024, May 1). Baker Commodities settlement. https://srvwww.aqmd.gov/docs/default-source/news-archive/2024/baker-may1-2024.pdf
- [16] United States Department of Agriculture, Foreign Agricultural Service. (2026, October 9). Livestock and Poultry: World Markets and Trade. https://apps.fas.usda.gov/psdonline/circulars/livestock_poultry.pdf
- [17] Agriculture and Agri-Food Canada. (2026, May 13). Sector Trend Analysis: Pet food trends in India. https://agriculture.canada.ca/en/international-trade/reports-and-guides/sector-trend-analysis-pet-food-trends-india
- [18] Reserve Bank of India. (2024, October 3). Livestock and Poultry Inflation in India: A Study of Milk, Poultry Meat and Eggs (RBI Working Paper Series No. 05). https://rbi.org.in/scripts/PublicationsView.aspx?Id=22720
- [19] Agriculture and Agri-Food Canada. (2026, May 13). Sector Trend Analysis: Pet food in China. https://agriculture.canada.ca/en/international-trade/reports-and-guides/sector-trend-analysis-pet-food-china
- [20] United States Department of Agriculture, Foreign Agricultural Service. (2026, September 15). Poultry and Products Annual: Brazil (BR2026-0037). https://www.fas.usda.gov/data/gain-report/2026/09/Poultry%20and%20Products%20Annual_Brasilia_Brazil_BR2026-0037.pdf
- [21] United States Department of Agriculture, Agricultural Marketing Service. (2026, October 30). National Animal By-Product Feedstuff Report. https://www.ams.usda.gov/mnreports/ams_3510.pdf
- [22] United States Department of Agriculture, Foreign Agricultural Service. (2026, September 14). Poultry and Products Annual: European Union (E42026-0072). https://www.fas.usda.gov/data/gain-report/2026/09/Poultry%20and%20Products%20Annual_Paris_European%20Union_E42026-0072.pdf
- [23] IVH and ZZF. (2026, April 27). Der deutsche Heimtiermarkt 2025. https://www.zzf.de/fileadmin/ZZF/Pressemeldungen/2026/2026_04_27_Marktdaten_der_Heimtierbranche/IVH_ZZF_PM_Der_Deutsche_Heimtiermarkt_2025.pdf
- [24] National Bureau of Statistics of China. (2026, October 19). Economic performance in the first three quarters of 2026. https://www.stats.gov.cn/sj/zxfb/202610/t20261019_1965618.html
- [25] Tyson Foods, Inc. (2026, August 3). Tyson Foods Reports Third Quarter 2026 Results. https://www.tysonfoods.com/news/news-releases/2026/8/tyson-foods-reports-third-quarter-2026-results
- [26] J-Six Enterprises. (2026, May 7). Fairview Mills expands service and ingredient offerings. https://www.facebook.com/jsixenterprises/posts/5-7-26for-immediate-release-fairview-mills-expands-service-and-ingredient-offeri/1402603261910380/[
- [27] Darling Ingredients Inc. (2026, July 30). Darling Ingredients Inc. Reports Second Quarter 2026 Results. https://www.darlingii.com/media/news/20260730-darling-ingredients-inc-reports-second-quarter-2026-resultsg Ingredients Inc. (2026, July 30). Darling Ingredients Inc. Reports Second Quarter 2026 Results. https://www.darlingii.com/media/news/20260730-darling-ingredients-inc-reports-second-quarter-2026-results
Table of Content
- Key Takeaways
- Market Size and CAGR
- Top Growth Driver
- Fastest Growing Segment
- Leading Region
- Key Companies
- Emerging Opportunities
- Executive Summary
- Global Market Outlook
- Demand-side Trends
- Supply-side Trends
- Technology Roadmap Analysis
- Analysis and Recommendations
- Analyst Perspective (What is happening? Why now? What should investors know?)
- Key Questions Answered
- How large is the market?
- What is the CAGR?
- What are key trends?
- Which region dominates?
- Who are the leaders?
Read More...
- Market Overview
- Market Coverage / Taxonomy
- Market Definition / Scope / Limitations
- Research Methodology
- Chapter Orientation
- Analytical Lens and Working Hypotheses
- Market Structure, Signals, and Trend Drivers
- Benchmarking and Cross-market Comparability
- Market Sizing, Forecasting, and Opportunity Mapping
- Research Design and Evidence Framework
- Desk Research Programme (Secondary Evidence)
- Expert Input and Fieldwork (Primary Evidence)
- Tooling, Models, and Reference Databases
- Data Engineering and Model Build
- Quality Assurance and Audit Trail
- Market Background
- Market Dynamics (Drivers, Restraints, Opportunity, Trends)
- Scenario Forecast (Optimistic, Likely, Conservative)
- Impact Analysis
- AI Impact
- Sustainability Impact
- Regulatory Impact
- Technology Impact
- Consumer / Buyer Analysis
- Purchase Drivers
- Adoption Barriers
- Buyer Journey
- Opportunity Map Analysis
- Product Life Cycle Analysis
- Supply Chain Analysis
- Investment Feasibility Matrix
- Value Chain Analysis
- PESTLE and Porter's Analysis
- Regulatory Landscape
- Regional Parent Market Outlook
- Production and Consumption Statistics
- Import and Export Statistics
- Global Market Analysis and Forecast, 2021 to 2036
- Historical Market Size Value (USD Million) Analysis, 2021 to 2025
- Current and Future Market Size Value (USD Million) Projections, 2026 to 2036
- Y-o-Y Growth Trend Analysis
- Absolute $ Opportunity Analysis
- Global Market Pricing Analysis, 2021 to 2036
- Global Market Analysis and Forecast, By End Use, 2021 to 2036
- Introduction / Key Findings
- Historical Market Size Value (USD Million) Analysis By End Use, 2021 to 2025
- Current and Future Market Size Value (USD Million) Analysis and Forecast By End Use, 2026 to 2036
- Pet Food
- Poultry Feed
- Aquaculture Feed
- Livestock Feed
- Y-o-Y Growth Trend Analysis By End Use, 2021 to 2025
- Absolute $ Opportunity Analysis By End Use, 2026 to 2036
- Global Market Analysis and Forecast, By Product Type, 2021 to 2036
- Introduction / Key Findings
- Historical Market Size Value (USD Million) Analysis By Product Type, 2021 to 2025
- Current and Future Market Size Value (USD Million) Analysis and Forecast By Product Type, 2026 to 2036
- Poultry By-product Meal
- Poultry Meal (Clean Chicken Meal)
- Other Poultry Meals
- Y-o-Y Growth Trend Analysis By Product Type, 2021 to 2025
- Absolute $ Opportunity Analysis By Product Type, 2026 to 2036
- Global Market Analysis and Forecast, By Source, 2021 to 2036
- Introduction / Key Findings
- Historical Market Size Value (USD Million) Analysis By Source, 2021 to 2025
- Current and Future Market Size Value (USD Million) Analysis and Forecast By Source, 2026 to 2036
- Chicken
- Turkey
- Duck and Other Poultry
- Y-o-Y Growth Trend Analysis By Source, 2021 to 2025
- Absolute $ Opportunity Analysis By Source, 2026 to 2036
- Global Market Analysis and Forecast, By Packaging, 2021 to 2036
- Introduction / Key Findings
- Historical Market Size Value (USD Million) Analysis By Packaging, 2021 to 2025
- Current and Future Market Size Value (USD Million) Analysis and Forecast By Packaging, 2026 to 2036
- Bulk
- Up to 1,000 kg Totes
- Up to 50 kg Bags
- Y-o-Y Growth Trend Analysis By Packaging, 2021 to 2025
- Absolute $ Opportunity Analysis By Packaging, 2026 to 2036
- Global Market Analysis and Forecast, By Region, 2021 to 2036
- Introduction
- Historical Market Size Value (USD Million) Analysis By Region, 2021 to 2025
- Current Market Size Value (USD Million) Analysis and Forecast By Region, 2026 to 2036
- North America
- Latin America
- Europe
- East Asia
- South Asia
- Oceania
- Middle East
- Africa
- Market Attractiveness Analysis By Region
- North America Market Analysis and Forecast, By Country, 2021 to 2036
- Historical Market Size Value (USD Million) Trend Analysis By Market Taxonomy, 2021 to 2025
- Market Size Value (USD Million) Forecast By Market Taxonomy, 2026 to 2036
- By Country
- By End Use
- By Product Type
- By Source
- By Packaging
- Market Attractiveness Analysis
- By Country
- By End Use
- By Product Type
- By Source
- By Packaging
- Key Takeaways
- Latin America Market Analysis and Forecast, By Country
- Historical Market Size Value (USD Million) Trend Analysis By Market Taxonomy, 2021 to 2025
- Market Size Value (USD Million) Forecast By Market Taxonomy, 2026 to 2036
- By Country
- By End Use
- By Product Type
- By Source
- By Packaging
- Market Attractiveness Analysis
- By Country
- By End Use
- By Product Type
- By Source
- By Packaging
- Key Takeaways
- Europe Market Analysis and Forecast, By Country
- Historical Market Size Value (USD Million) Trend Analysis By Market Taxonomy, 2021 to 2025
- Market Size Value (USD Million) Forecast By Market Taxonomy, 2026 to 2036
- By Country
- By End Use
- By Product Type
- By Source
- By Packaging
- Market Attractiveness Analysis
- By Country
- By End Use
- By Product Type
- By Source
- By Packaging
- Key Takeaways
- East Asia Market Analysis and Forecast, By Country
- Historical Market Size Value (USD Million) Trend Analysis By Market Taxonomy, 2021 to 2025
- Market Size Value (USD Million) Forecast By Market Taxonomy, 2026 to 2036
- By Country
- By End Use
- By Product Type
- By Source
- By Packaging
- Market Attractiveness Analysis
- By Country
- By End Use
- By Product Type
- By Source
- By Packaging
- Key Takeaways
- South Asia Market Analysis and Forecast, By Country
- Historical Market Size Value (USD Million) Trend Analysis By Market Taxonomy, 2021 to 2025
- Market Size Value (USD Million) Forecast By Market Taxonomy, 2026 to 2036
- By Country
- By End Use
- By Product Type
- By Source
- By Packaging
- Market Attractiveness Analysis
- By Country
- By End Use
- By Product Type
- By Source
- By Packaging
- Key Takeaways
- Oceania Market Analysis and Forecast, By Country
- Historical Market Size Value (USD Million) Trend Analysis By Market Taxonomy, 2021 to 2025
- Market Size Value (USD Million) Forecast By Market Taxonomy, 2026 to 2036
- By Country
- By End Use
- By Product Type
- By Source
- By Packaging
- Market Attractiveness Analysis
- By Country
- By End Use
- By Product Type
- By Source
- By Packaging
- Key Takeaways
- Middle East Market Analysis and Forecast, By Country
- Historical Market Size Value (USD Million) Trend Analysis By Market Taxonomy, 2021 to 2025
- Market Size Value (USD Million) Forecast By Market Taxonomy, 2026 to 2036
- By Country
- By End Use
- By Product Type
- By Source
- By Packaging
- Market Attractiveness Analysis
- By Country
- By End Use
- By Product Type
- By Source
- By Packaging
- Key Takeaways
- Africa Market Analysis and Forecast, By Country
- Historical Market Size Value (USD Million) Trend Analysis By Market Taxonomy, 2021 to 2025
- Market Size Value (USD Million) Forecast By Market Taxonomy, 2026 to 2036
- By Country
- India
- China
- Brazil
- United States
- Germany
- By End Use
- By Product Type
- By Source
- By Packaging
- By Country
- Market Attractiveness Analysis
- By Country
- By End Use
- By Product Type
- By Source
- By Packaging
- Key Takeaways
- Key Countries Market Analysis
- United States
- Pricing Analysis
- Market Share Analysis, 2025
- By End Use
- By Product Type
- By Source
- By Packaging
- Brazil
- Pricing Analysis
- Market Share Analysis, 2025
- By End Use
- By Product Type
- By Source
- By Packaging
- Germany
- Pricing Analysis
- Market Share Analysis, 2025
- By End Use
- By Product Type
- By Source
- By Packaging
- India
- Pricing Analysis
- Market Share Analysis, 2025
- By End Use
- By Product Type
- By Source
- By Packaging
- China
- Pricing Analysis
- Market Share Analysis, 2025
- By End Use
- By Product Type
- By Source
- By Packaging
- United States
- Market Structure Analysis
- Competition Dashboard
- Competition Benchmarking
- Market Share Analysis of Top Players
- By Regional
- By End Use
- By Product Type
- By Source
- By Packaging
- Emerging Startups
- Innovation Benchmarking
- Competition Analysis
- Competition Deep Dive
- Darling Ingredients Inc.
- Overview
- Product Portfolio
- Profitability by Market Segments
- Sales Footprint
- Strategy Overview
- Marketing Strategy
- Product Strategy
- Channel Strategy
- Tyson Foods, Inc.
- MBRF Global Foods Company
- Venky's (India) Limited
- Baker Commodities Inc.
- Darling Ingredients Inc.
- Case Studies
- Success Stories
- Recent Developments
- Competition Deep Dive
- Assumptions & Acronyms Used
List of Tables
- Table 1: Global Market Value (USD Million) Forecast by Region, 2021 to 2036
- Table 2: Global Market Value (USD Million) Forecast by End Use, 2021 to 2036
- Table 3: Global Market Value (USD Million) Forecast by Product Type, 2021 to 2036
- Table 4: Global Market Value (USD Million) Forecast by Source, 2021 to 2036
- Table 5: Global Market Value (USD Million) Forecast by Packaging, 2021 to 2036
- Table 6: North America Market Value (USD Million) Forecast by Country, 2021 to 2036
- Table 7: North America Market Value (USD Million) Forecast by End Use, 2021 to 2036
- Table 8: North America Market Value (USD Million) Forecast by Product Type, 2021 to 2036
- Table 9: North America Market Value (USD Million) Forecast by Source, 2021 to 2036
- Table 10: North America Market Value (USD Million) Forecast by Packaging, 2021 to 2036
- Table 11: Latin America Market Value (USD Million) Forecast by Country, 2021 to 2036
- Table 12: Latin America Market Value (USD Million) Forecast by End Use, 2021 to 2036
- Table 13: Latin America Market Value (USD Million) Forecast by Product Type, 2021 to 2036
- Table 14: Latin America Market Value (USD Million) Forecast by Source, 2021 to 2036
- Table 15: Latin America Market Value (USD Million) Forecast by Packaging, 2021 to 2036
- Table 16: Europe Market Value (USD Million) Forecast by Country, 2021 to 2036
- Table 17: Europe Market Value (USD Million) Forecast by End Use, 2021 to 2036
- Table 18: Europe Market Value (USD Million) Forecast by Product Type, 2021 to 2036
- Table 19: Europe Market Value (USD Million) Forecast by Source, 2021 to 2036
- Table 20: Europe Market Value (USD Million) Forecast by Packaging, 2021 to 2036
- Table 21: East Asia Market Value (USD Million) Forecast by Country, 2021 to 2036
- Table 22: East Asia Market Value (USD Million) Forecast by End Use, 2021 to 2036
- Table 23: East Asia Market Value (USD Million) Forecast by Product Type, 2021 to 2036
- Table 24: East Asia Market Value (USD Million) Forecast by Source, 2021 to 2036
- Table 25: East Asia Market Value (USD Million) Forecast by Packaging, 2021 to 2036
- Table 26: South Asia Market Value (USD Million) Forecast by Country, 2021 to 2036
- Table 27: South Asia Market Value (USD Million) Forecast by End Use, 2021 to 2036
- Table 28: South Asia Market Value (USD Million) Forecast by Product Type, 2021 to 2036
- Table 29: South Asia Market Value (USD Million) Forecast by Source, 2021 to 2036
- Table 30: South Asia Market Value (USD Million) Forecast by Packaging, 2021 to 2036
- Table 31: Oceania Market Value (USD Million) Forecast by Country, 2021 to 2036
- Table 32: Oceania Market Value (USD Million) Forecast by End Use, 2021 to 2036
- Table 33: Oceania Market Value (USD Million) Forecast by Product Type, 2021 to 2036
- Table 34: Oceania Market Value (USD Million) Forecast by Source, 2021 to 2036
- Table 35: Oceania Market Value (USD Million) Forecast by Packaging, 2021 to 2036
- Table 36: Middle East Market Value (USD Million) Forecast by Country, 2021 to 2036
- Table 37: Middle East Market Value (USD Million) Forecast by End Use, 2021 to 2036
- Table 38: Middle East Market Value (USD Million) Forecast by Product Type, 2021 to 2036
- Table 39: Middle East Market Value (USD Million) Forecast by Source, 2021 to 2036
- Table 40: Middle East Market Value (USD Million) Forecast by Packaging, 2021 to 2036
- Table 41: Africa Market Value (USD Million) Forecast by Country, 2021 to 2036
- Table 42: Africa Market Value (USD Million) Forecast by End Use, 2021 to 2036
- Table 43: Africa Market Value (USD Million) Forecast by Product Type, 2021 to 2036
- Table 44: Africa Market Value (USD Million) Forecast by Source, 2021 to 2036
- Table 45: Africa Market Value (USD Million) Forecast by Packaging, 2021 to 2036
List of Figures
- Figure 1: Global Market Pricing Analysis
- Figure 2: Global Market Value (USD Million) Forecast 2021-2036
- Figure 3: Global Market Value Share and BPS Analysis by End Use, 2026 and 2036
- Figure 4: Global Market Y-o-Y Growth Comparison by End Use, 2026-2036
- Figure 5: Global Market Attractiveness Analysis by End Use
- Figure 6: Global Market Value Share and BPS Analysis by Product Type, 2026 and 2036
- Figure 7: Global Market Y-o-Y Growth Comparison by Product Type, 2026-2036
- Figure 8: Global Market Attractiveness Analysis by Product Type
- Figure 9: Global Market Value Share and BPS Analysis by Source, 2026 and 2036
- Figure 10: Global Market Y-o-Y Growth Comparison by Source, 2026-2036
- Figure 11: Global Market Attractiveness Analysis by Source
- Figure 12: Global Market Value Share and BPS Analysis by Packaging, 2026 and 2036
- Figure 13: Global Market Y-o-Y Growth Comparison by Packaging, 2026-2036
- Figure 14: Global Market Attractiveness Analysis by Packaging
- Figure 15: Global Market Value (USD Million) Share and BPS Analysis by Region, 2026 and 2036
- Figure 16: Global Market Y-o-Y Growth Comparison by Region, 2026-2036
- Figure 17: Global Market Attractiveness Analysis by Region
- Figure 18: North America Market Incremental Dollar Opportunity, 2026-2036
- Figure 19: Latin America Market Incremental Dollar Opportunity, 2026-2036
- Figure 20: Europe Market Incremental Dollar Opportunity, 2026-2036
- Figure 21: East Asia Market Incremental Dollar Opportunity, 2026-2036
- Figure 22: South Asia Market Incremental Dollar Opportunity, 2026-2036
- Figure 23: Oceania Market Incremental Dollar Opportunity, 2026-2036
- Figure 24: Middle East Market Incremental Dollar Opportunity, 2026-2036
- Figure 25: Africa Market Incremental Dollar Opportunity, 2026-2036
- Figure 26: North America Market Value Share and BPS Analysis by Country, 2026 and 2036
- Figure 27: North America Market Value Share and BPS Analysis by End Use, 2026 and 2036
- Figure 28: North America Market Y-o-Y Growth Comparison by End Use, 2026-2036
- Figure 29: North America Market Attractiveness Analysis by End Use
- Figure 30: North America Market Value Share and BPS Analysis by Product Type, 2026 and 2036
- Figure 31: North America Market Y-o-Y Growth Comparison by Product Type, 2026-2036
- Figure 32: North America Market Attractiveness Analysis by Product Type
- Figure 33: North America Market Value Share and BPS Analysis by Source, 2026 and 2036
- Figure 34: North America Market Y-o-Y Growth Comparison by Source, 2026-2036
- Figure 35: North America Market Attractiveness Analysis by Source
- Figure 36: North America Market Value Share and BPS Analysis by Packaging, 2026 and 2036
- Figure 37: North America Market Y-o-Y Growth Comparison by Packaging, 2026-2036
- Figure 38: North America Market Attractiveness Analysis by Packaging
- Figure 39: Latin America Market Value Share and BPS Analysis by Country, 2026 and 2036
- Figure 40: Latin America Market Value Share and BPS Analysis by End Use, 2026 and 2036
- Figure 41: Latin America Market Y-o-Y Growth Comparison by End Use, 2026-2036
- Figure 42: Latin America Market Attractiveness Analysis by End Use
- Figure 43: Latin America Market Value Share and BPS Analysis by Product Type, 2026 and 2036
- Figure 44: Latin America Market Y-o-Y Growth Comparison by Product Type, 2026-2036
- Figure 45: Latin America Market Attractiveness Analysis by Product Type
- Figure 46: Latin America Market Value Share and BPS Analysis by Source, 2026 and 2036
- Figure 47: Latin America Market Y-o-Y Growth Comparison by Source, 2026-2036
- Figure 48: Latin America Market Attractiveness Analysis by Source
- Figure 49: Latin America Market Value Share and BPS Analysis by Packaging, 2026 and 2036
- Figure 50: Latin America Market Y-o-Y Growth Comparison by Packaging, 2026-2036
- Figure 51: Latin America Market Attractiveness Analysis by Packaging
- Figure 52: Europe Market Value Share and BPS Analysis by Country, 2026 and 2036
- Figure 53: Europe Market Value Share and BPS Analysis by End Use, 2026 and 2036
- Figure 54: Europe Market Y-o-Y Growth Comparison by End Use, 2026-2036
- Figure 55: Europe Market Attractiveness Analysis by End Use
- Figure 56: Europe Market Value Share and BPS Analysis by Product Type, 2026 and 2036
- Figure 57: Europe Market Y-o-Y Growth Comparison by Product Type, 2026-2036
- Figure 58: Europe Market Attractiveness Analysis by Product Type
- Figure 59: Europe Market Value Share and BPS Analysis by Source, 2026 and 2036
- Figure 60: Europe Market Y-o-Y Growth Comparison by Source, 2026-2036
- Figure 61: Europe Market Attractiveness Analysis by Source
- Figure 62: Europe Market Value Share and BPS Analysis by Packaging, 2026 and 2036
- Figure 63: Europe Market Y-o-Y Growth Comparison by Packaging, 2026-2036
- Figure 64: Europe Market Attractiveness Analysis by Packaging
- Figure 65: East Asia Market Value Share and BPS Analysis by Country, 2026 and 2036
- Figure 66: East Asia Market Value Share and BPS Analysis by End Use, 2026 and 2036
- Figure 67: East Asia Market Y-o-Y Growth Comparison by End Use, 2026-2036
- Figure 68: East Asia Market Attractiveness Analysis by End Use
- Figure 69: East Asia Market Value Share and BPS Analysis by Product Type, 2026 and 2036
- Figure 70: East Asia Market Y-o-Y Growth Comparison by Product Type, 2026-2036
- Figure 71: East Asia Market Attractiveness Analysis by Product Type
- Figure 72: East Asia Market Value Share and BPS Analysis by Source, 2026 and 2036
- Figure 73: East Asia Market Y-o-Y Growth Comparison by Source, 2026-2036
- Figure 74: East Asia Market Attractiveness Analysis by Source
- Figure 75: East Asia Market Value Share and BPS Analysis by Packaging, 2026 and 2036
- Figure 76: East Asia Market Y-o-Y Growth Comparison by Packaging, 2026-2036
- Figure 77: East Asia Market Attractiveness Analysis by Packaging
- Figure 78: South Asia Market Value Share and BPS Analysis by Country, 2026 and 2036
- Figure 79: South Asia Market Value Share and BPS Analysis by End Use, 2026 and 2036
- Figure 80: South Asia Market Y-o-Y Growth Comparison by End Use, 2026-2036
- Figure 81: South Asia Market Attractiveness Analysis by End Use
- Figure 82: South Asia Market Value Share and BPS Analysis by Product Type, 2026 and 2036
- Figure 83: South Asia Market Y-o-Y Growth Comparison by Product Type, 2026-2036
- Figure 84: South Asia Market Attractiveness Analysis by Product Type
- Figure 85: South Asia Market Value Share and BPS Analysis by Source, 2026 and 2036
- Figure 86: South Asia Market Y-o-Y Growth Comparison by Source, 2026-2036
- Figure 87: South Asia Market Attractiveness Analysis by Source
- Figure 88: South Asia Market Value Share and BPS Analysis by Packaging, 2026 and 2036
- Figure 89: South Asia Market Y-o-Y Growth Comparison by Packaging, 2026-2036
- Figure 90: South Asia Market Attractiveness Analysis by Packaging
- Figure 91: Oceania Market Value Share and BPS Analysis by Country, 2026 and 2036
- Figure 92: Oceania Market Value Share and BPS Analysis by End Use, 2026 and 2036
- Figure 93: Oceania Market Y-o-Y Growth Comparison by End Use, 2026-2036
- Figure 94: Oceania Market Attractiveness Analysis by End Use
- Figure 95: Oceania Market Value Share and BPS Analysis by Product Type, 2026 and 2036
- Figure 96: Oceania Market Y-o-Y Growth Comparison by Product Type, 2026-2036
- Figure 97: Oceania Market Attractiveness Analysis by Product Type
- Figure 98: Oceania Market Value Share and BPS Analysis by Source, 2026 and 2036
- Figure 99: Oceania Market Y-o-Y Growth Comparison by Source, 2026-2036
- Figure 100: Oceania Market Attractiveness Analysis by Source
- Figure 101: Oceania Market Value Share and BPS Analysis by Packaging, 2026 and 2036
- Figure 102: Oceania Market Y-o-Y Growth Comparison by Packaging, 2026-2036
- Figure 103: Oceania Market Attractiveness Analysis by Packaging
- Figure 104: Middle East Market Value Share and BPS Analysis by Country, 2026 and 2036
- Figure 105: Middle East Market Value Share and BPS Analysis by End Use, 2026 and 2036
- Figure 106: Middle East Market Y-o-Y Growth Comparison by End Use, 2026-2036
- Figure 107: Middle East Market Attractiveness Analysis by End Use
- Figure 108: Middle East Market Value Share and BPS Analysis by Product Type, 2026 and 2036
- Figure 109: Middle East Market Y-o-Y Growth Comparison by Product Type, 2026-2036
- Figure 110: Middle East Market Attractiveness Analysis by Product Type
- Figure 111: Middle East Market Value Share and BPS Analysis by Source, 2026 and 2036
- Figure 112: Middle East Market Y-o-Y Growth Comparison by Source, 2026-2036
- Figure 113: Middle East Market Attractiveness Analysis by Source
- Figure 114: Middle East Market Value Share and BPS Analysis by Packaging, 2026 and 2036
- Figure 115: Middle East Market Y-o-Y Growth Comparison by Packaging, 2026-2036
- Figure 116: Middle East Market Attractiveness Analysis by Packaging
- Figure 117: Africa Market Value Share and BPS Analysis by Country, 2026 and 2036
- Figure 118: Africa Market Value Share and BPS Analysis by End Use, 2026 and 2036
- Figure 119: Africa Market Y-o-Y Growth Comparison by End Use, 2026-2036
- Figure 120: Africa Market Attractiveness Analysis by End Use
- Figure 121: Africa Market Value Share and BPS Analysis by Product Type, 2026 and 2036
- Figure 122: Africa Market Y-o-Y Growth Comparison by Product Type, 2026-2036
- Figure 123: Africa Market Attractiveness Analysis by Product Type
- Figure 124: Africa Market Value Share and BPS Analysis by Source, 2026 and 2036
- Figure 125: Africa Market Y-o-Y Growth Comparison by Source, 2026-2036
- Figure 126: Africa Market Attractiveness Analysis by Source
- Figure 127: Africa Market Value Share and BPS Analysis by Packaging, 2026 and 2036
- Figure 128: Africa Market Y-o-Y Growth Comparison by Packaging, 2026-2036
- Figure 129: Africa Market Attractiveness Analysis by Packaging
- Figure 130: Global Market - Tier Structure Analysis
- Figure 131: Global Market - Company Share Analysis
Frequently Asked Questions
How big is the Poultry Meal arket in 2026?
FMI estimates the market at USD 1,570.0 million in 2026, up from USD 1,490.0 million in 2025. It is forecast to reach USD 2,680.0 million by 2036 at a 5.5% CAGR.
Which end use leads the Poultry Meal Market?
Pet food leads by end use with 42.0% in 2026. Poultry, aquaculture and livestock feed together hold 58.0%.
Which product type leads?
Poultry by-product meal leads with 60.0% in 2026, and clean poultry meal and other meals hold 40.0%.
Which country is forecast to grow fastest through 2036?
India has the highest forecast CAGR among the profiled countries at 7.0% during 2026 to 2036, followed by China at 6.3%. These are FMI forecasts and are not rates reported by the cited public bodies.
What is the difference between poultry meal and poultry by-product meal?
Poultry meal is made mainly from clean meat and bone, while by-product meal is made from other slaughter parts such as viscera [11].
What risks affect supply?
Avian influenza and trade bans can interrupt flock and export flows, as seen in Brazil in 2025 [20].
Preview the report firsthand - request a free sample
Get SampleGet the brochure for pricing and purchase details.
Get PDF
