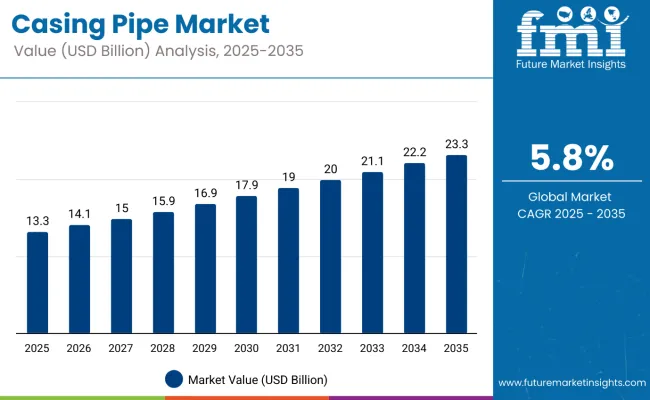
The global casing pipe market is projected to grow from USD 13.3 billion in 2025 to USD 23.3 billion by 2035, reflecting an absolute increase of USD 10 billion, or 75.2% over the decade. This expansion is expected to represent a compound annual growth rate (CAGR) of 5.8%, with the market poised to grow 1.75X by the end of the forecast period.
| Metric | Value |
|---|---|
| Industry Size (2025E) | USD 13.3 billion |
| Industry Size (2035F) | USD 23.3 billion |
| CAGR (2025-2035) | 5.8% |
Between 2025 and 2030, the market is expected to increase from USD 13.3 billion to USD 17.9 billion, marking an addition of USD 4.6 billion in value. This phase of growth will likely be driven by rising oilfield development activities across North America and the Middle East, alongside expanding drilling operations in offshore reserves. Efforts by national oil companies (NOCs) to improve upstream efficiency and maintain production targets are anticipated to boost demand for both standard and premium-grade casing pipes.
From 2030 to 2035, the market is forecast to expand from USD 17.9 billion to USD 23.3 billion, gaining USD 5.4 billion during the latter half of the decade. Growth in this phase will be supported by deeper and horizontal well designs, increasing reliance on high-collapse and corrosion-resistant casing variants, and greater adoption of digital well monitoring solutions that require enhanced mechanical integrity in casing systems.
Between 2020 and 2025, the global casing pipe market grew from USD 10.1 billion to USD 13.3 billion, representing an absolute increase of USD 3.2 billion or a growth of 31.7%, at a CAGR of 5.6%. This period marked a significant rebound for the market following pandemic-induced slowdowns in 2020, as upstream capital expenditures gradually resumed and rig activity normalized.
The recovery phase was largely driven by a resurgence in onshore drilling across the United States, China, and Russia. Government stimulus-backed infrastructure and energy programs supported field redevelopment activities, while shale operators in North America revisited paused drilling contracts. This contributed to increasing demand for API-grade and semi-premium casing pipes, particularly in unconventional resource plays.
Several oilfield service providers expanded their supply chain capabilities during this time. Companies like Tenaris and Vallourec ramped up production output in response to restocking initiatives by major drillers. There was a noticeable uptick in demand for L80 and P110 grades, supporting mid-depth and high-pressure wells.
A shift towards localized sourcing and regional OCTG hubs was observed, especially across the Middle East and South Asia, where governments emphasized energy independence. Also, major upstream firms initiated collaborations with casing pipe manufacturers to ensure supply reliability and technical customization, especially in high H2S and CO2 environments.
By the end of 2025, the industry had nearly surpassed pre-pandemic levels, setting the stage for accelerated adoption of enhanced metallurgy, anti-corrosion coatings, and flush joint designs to support deeper, longer, and more complex well architectures across both greenfield and brownfield operations.
The global casing pipe market is witnessing expansion due to the convergence of three core growth factors: increasing upstream investment in oil & gas exploration, growing complexity in well design, and a resurgence in unconventional drilling activities.
Energy security concerns have pushed both national oil companies (NOCs) and international oil companies (IOCs) to increase budgets for field development, brownfield expansion, and tight reservoir extraction. This is fueling demand for casing pipes that can withstand higher downhole pressures, corrosive media, and deeper formations. As a result, API premium-grade and custom alloy casing solutions are gaining traction, particularly across the Middle East, North America, and offshore West Africa.
The push for longer lateral wells in shale plays is leading to a rise in casing string requirements, with more emphasis on high-collapse resistance and connection integrity. With lateral lengths exceeding 10,000 feet in many USA basins, operators are turning to advanced casing pipe geometries and seamless threading technologies to ensure mechanical stability.
Gas-focused drilling programs in Qatar, Turkmenistan, and Argentina are also accelerating, driving the need for specialized casing solutions resistant to high-pressure and sour service conditions. Simultaneously, mature oil basins across China, Russia, and the Gulf of Mexico are undergoing redevelopment, requiring casing strings with enhanced fatigue resistance for extended life cycles.
Global efforts to maximize extraction from marginal and offshore reservoirs are leading to greater reliance on flush joint, high-strength, and corrosion-resistant casing types, especially in high-salinity and high-H2S environments. Technological collaboration between OCTG manufacturers and oilfield service providers is becoming central to fulfilling these evolving requirements.
The casing pipe market is segmented by material type into steel, plastic, fiberglass, and composite variants. Steel remains dominant due to its strength and durability in high-pressure drilling environments. Based on the manufacturing process, the market is categorized into seamless and welded pipes, with seamless types preferred for their structural integrity in deep and offshore drilling. The end-use segmentation includes oil and gas exploration, water well drilling, construction and infrastructure, and others such as geothermal and mining.
Oil and gas exploration continues to be the primary application segment, supported by rising global energy demand and drilling activities in new basins. Regionally, the market covers North America, Latin America, Europe, East Asia, South Asia & Pacific, and the Middle East & Africa, enabling evaluation of drilling activity trends and casing material preferences across geographies.
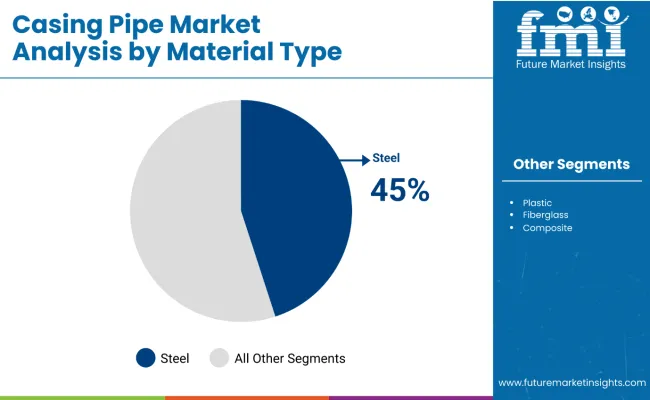
Steel pipes are estimated to account for 45% of the casing pipe market in 2025 and are projected to grow at a CAGR of 5.9% through 2035. Their superior tensile strength, corrosion resistance, and capacity to withstand extreme pressures make them indispensable in oil and gas drilling operations. The ability to support deeper drilling and provide structural integrity under harsh subsurface conditions has reinforced their use across offshore and onshore sites. Increasing investments in shale and deepwater projects in the USA, Canada, and the Middle East have further accelerated demand for steel casing pipes in recent years.
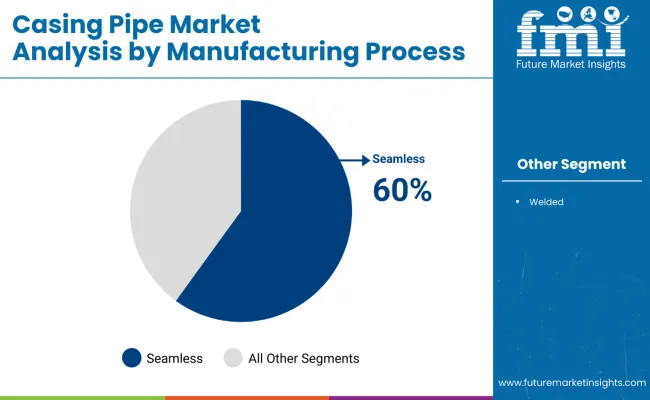
Seamless casing pipes are expected to hold 60% of the market in 2025, driven by their robust pressure resistance and uniform structure. This segment is anticipated to expand at a CAGR of 6.1% through 2035. These pipes are widely used in high-pressure applications such as oil exploration wells and geothermal drilling, where uniformity and strength are critical. The absence of weld seams minimizes the risk of failure in high-stress zones, making seamless variants ideal for demanding offshore and deep well operations. Manufacturers continue to focus on improving the dimensional precision and material quality of seamless pipes to meet API and ISO standards.
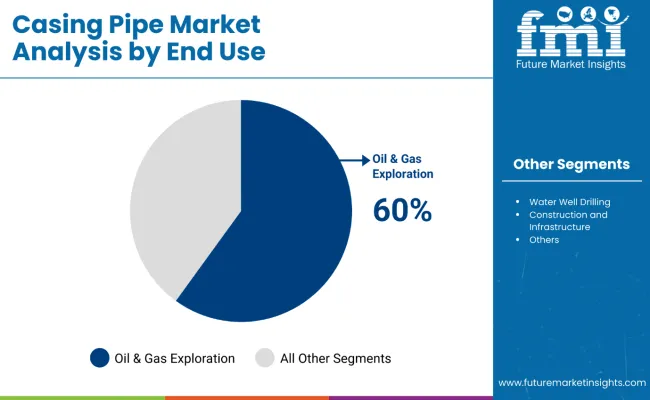
Oil and gas exploration is projected to contribute 60% to overall casing pipe demand in 2025 and is set to expand at a CAGR of 6.0% through 2035. This demand is sustained by rising upstream activity in the USA, Middle East, and Latin America. As new reserves are tapped and drilling depths increase, the requirement for advanced casing pipe solutions that ensure wellbore stability and isolation of pressure zones is growing. Exploration and production companies are also adopting premium casing solutions with better resistance to sour gas and thermal stress, particularly in unconventional reservoirs.
The casing pipe market is being propelled by increasing oilfield complexity, regulatory emphasis on well integrity, and greater material innovation. The following key trends are shaping how casing pipe consumption is evolving across geographies and well profiles.
Complex Well Designs Require Multi-Grade and High-Collapse Casing Strings
With an increasing number of wells being drilled deeper and more directionally, operators are demanding casing solutions that combine axial load capacity with collapse and burst resistance. Ultra-deepwater and horizontal wells now require multiple casing layers across varying formation pressures, driving adoption of hybrid-grade casing programs that utilize both API and proprietary steel grades.
Shift Toward Corrosion-Resistant Alloys and Coated Casing Solutions
The rise of sour gas and high-salinity operations has made corrosion resistance a critical procurement criterion for casing pipe buyers. Asset life extension programs, particularly in offshore and mature fields, are also boosting demand for casing pipes with advanced coatings and internal lining.
| Countries | 2025 |
|---|---|
| Germany | 23% |
| Italy | 13% |
| France | 18% |
| UK | 16% |
| Spain | 8% |
| BENELUX | 9% |
| Russia | 7% |
| Rest of Europe | 6% |
| Countries | 2035 |
|---|---|
| Germany | 24% |
| Italy | 15% |
| France | 17% |
| UK | 15% |
| Spain | 8% |
| BENELUX | 9% |
| Russia | 8% |
| Rest of Europe | 6% |
Europe’s casing pipe market is projected to grow from USD 2.9 billion in 2025 to USD 4.4 billion by 2035, reflecting a CAGR of 4.2%. The region’s demand is largely tied to the redevelopment of mature oil and gas fields, geothermal well expansion, and sustained exploratory efforts in the North Sea and Eastern Europe. Despite a generally declining trend in new hydrocarbon projects, targeted investments in energy security and underground storage are helping maintain demand for advanced casing pipe technologies.
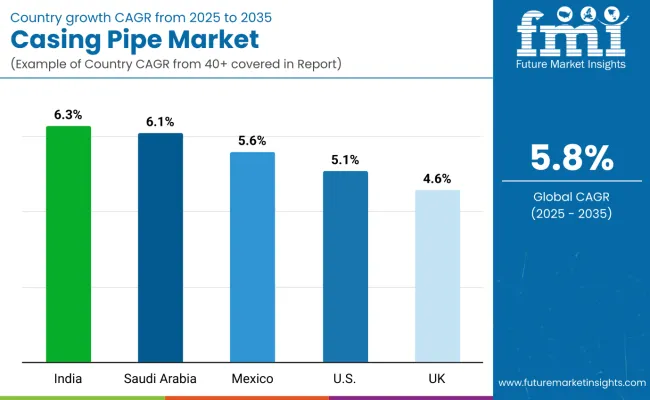
India is projected to register the fastest CAGR of 6.3% through 2035, outpacing global average growth. The surge in demand is being driven by aggressive domestic oil and gas production goals, supported by new licensing rounds and private operator participation. Growing activity in CBM, shale gas, and offshore wells is propelling demand for advanced casing materials.
Saudi Arabia is forecast to expand at a 6.1% CAGR, fueled by ongoing investments in natural gas capacity and exploration of unconventional resources like tight gas and shale. Saudi Aramco’s drilling plans under Vision 2030 continue to prioritize horizontal and high-pressure well architectures that require premium-grade casing.
Mexico’s casing pipe market is expected to grow at 5.6% CAGR, primarily supported by PEMEX’s strategy to rejuvenate brownfield sites and the entry of foreign investors in deepwater regions. Regulatory backing and enhanced recovery programs are expanding demand across both conventional and unconventional fields.
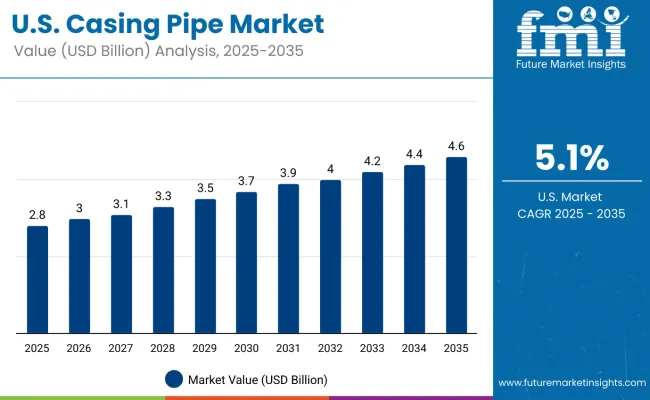
The USA is set to grow at a 5.1% CAGR, supported by consistent drilling activity in the Permian, Haynesville, and Appalachian basins. Emerging applications in carbon capture and geothermal wells are increasing the use of specialty casing products in addition to standard horizontal well strings.
The UK is projected to grow at a 4.6% CAGR, reflecting stable demand from North Sea redevelopments and early-stage CCS field development. Regulatory incentives and re-use of idle oilfield infrastructure are encouraging investment in casing pipe retrofits and reinforcement programs.
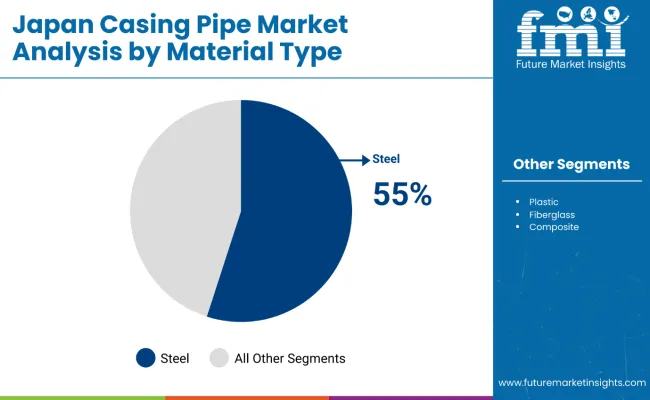
In Japan, steel casing pipes continue to dominate with a 55% share in 2025, attributed to their unmatched mechanical strength and compatibility with both offshore and onshore oilfield applications. Steel pipes are heavily utilized in geothermal projects and legacy oil wells where high-pressure resistance is critical. Plastic and fiberglass casings are gaining ground in shallow applications and environmental monitoring due to their corrosion resistance and lower weight.
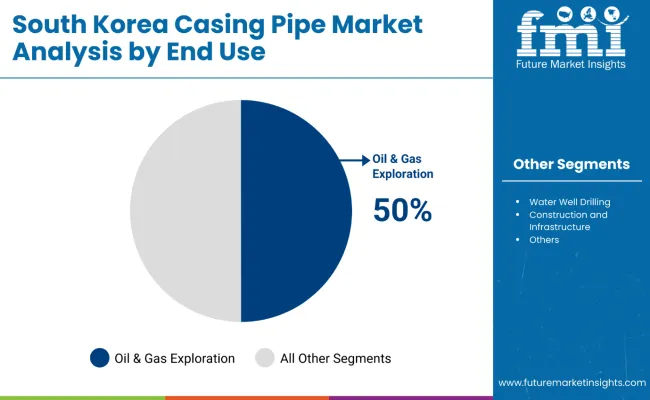
South Korea’s casing pipe market is led by oil and gas exploration, accounting for a 50% share in 2025, largely due to deepwater offshore developments and joint ventures in hydrocarbon fields abroad. Domestic consumption is also rising in the construction and infrastructure sector, which holds a 22% share and relies on casings for foundational piling and tunnel boring operations. Water well drilling comprises 18%, while geothermal and mining segments form the remaining 10%.
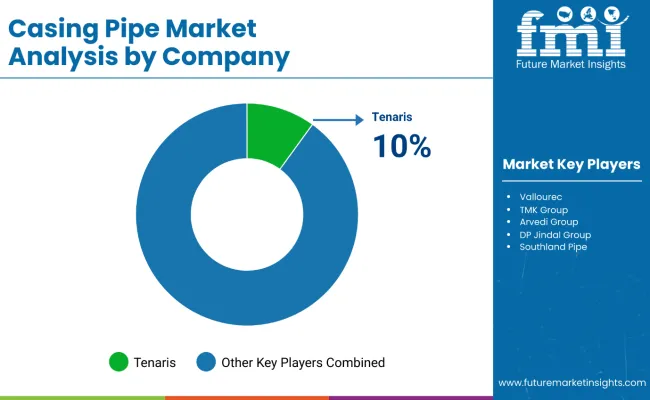
Competition in the casing pipes market is being driven by strategic project-based contracts and capacity expansions. Industry players are securing large-scale orders for offshore oil and gas operations, emphasizing high-quality, premium casing and tubing solutions capable of withstanding demanding deepwater conditions. Simultaneously, manufacturers are investing in production facility enhancements to improve output and ensure timely delivery for energy infrastructure projects, including district heating and urban utility networks.
| Item | Value |
|---|---|
| Quantitative Units | Volume (Tons), Value (USD Billion) |
| By Material Type | Steel, Plastic, Fiberglass, Composite |
| By Manufacturing Process | Seamless, Welded |
| By End Use | Oil & Gas Exploration, Water Well Drilling, Construction and Infrastructure, Others (e.g., Geothermal, Mining) |
| By Region | North America, Latin America, Eastern Europe, Western Europe, East Aisa, South Asia & Pacific, Middle East & Africa |
| Countries Covered | USA, Canada, Mexico, Brazil, Germany, Italy, France, UK, Spain, BENELUX, Russia, Hungary, Poland, India, China, Japan, South Korea, Turkiye, South Africa |
The global casing pipe market is projected to be valued at USD 13.3 billion in 2025, supported by steady growth across energy and construction sectors.
The market is forecast to grow at a CAGR of 5.8% during the period from 2025 to 2035.
Steel continues to dominate due to its high strength and pressure resistance, especially in oil & gas applications.
Seamless casing pipes are widely preferred in high-pressure oilfield environments, while welded variants are more common in water wells and civil applications.
Rising oil & gas exploration, infrastructure expansion, and increasing demand for water well drilling in developing regions are major contributors.
Asia Pacific, particularly India and Southeast Asia, is expected to register the highest growth owing to rising energy demand and infrastructure investment.
The adoption of corrosion-resistant composites, premium thread connections, and advancements in pipe inspection technologies are influencing product development.


Full Research Suite comprises of:
Market outlook & trends analysis
Interviews & case studies
Strategic recommendations
Vendor profiles & capabilities analysis
5-year forecasts
8 regions and 60+ country-level data splits
Market segment data splits
12 months of continuous data updates
DELIVERED AS:
PDF EXCEL ONLINE
Well Casing Market Size and Share Forecast Outlook 2025 to 2035
Vegan Casing Market Size and Share Forecast Outlook 2025 to 2035
Split Casing Pumps Market
Coated Casing Market Size and Share Forecast Outlook 2025 to 2035
Sausage Casing Market Size and Share Forecast Outlook 2025 to 2035
Market Share Insights of Leading Sausage Casing Providers
Aluminum Casing of the Blade Battery Market Size and Share Forecast Outlook 2025 to 2035
Examining Market Share Trends in the Collagen Casings Industry
Collagen Casings Market Analysis - Product Type & End Use Trends
UK Collagen Casings Market Insights – Demand, Size & Industry Trends 2025–2035
Spice Coated Casing Market Analysis - Size, Share & Forecast 2025 to 2035
USA Collagen Casings Market Analysis – Size, Share & Forecast 2025–2035
ASEAN Collagen Casings Market Report – Trends, Demand & Outlook 2025–2035
Edible Collagen Casing Market Size and Share Forecast Outlook 2025 to 2035
Europe Collagen Casings Market Report – Demand, Growth & Industry Forecast 2025–2035
Competitive Overview of Edible Collagen Casing Market Share
Australia Collagen Casings Market Outlook – Share, Growth & Forecast 2025–2035
Latin America Collagen Casings Market Trends – Size, Demand & Forecast 2025–2035
Demand for Spice Coated Casing in EU Size and Share Forecast Outlook 2025 to 2035
Pipeline Integrity Market Size and Share Forecast Outlook 2025 to 2035

Thank you!
You will receive an email from our Business Development Manager. Please be sure to check your SPAM/JUNK folder too.
Chat With
MaRIA