
- Market Size (2026)
- USD 440.0 Mn
- Forecast (2036)
- USD 1283.5 Mn
- CAGR (2026 to 2036)
- 11.3%
How big is Cheese Straws & Twists Market in 2026?
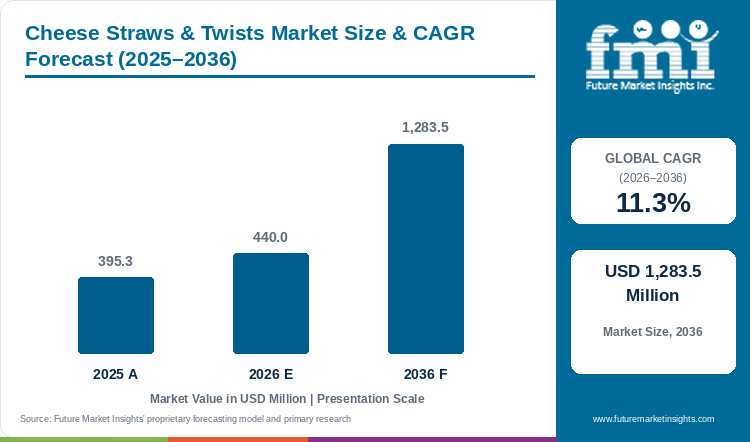
The market was valued at USD 395.3 Million in 2025 and is expected to reach USD 440.0 Million in 2026, with growth at an 11.3% CAGR from 2026 to 2036 taking its value to USD 1,283.5 Million by 2036.
Cheese straws and twists depend on a crisp bite and recognizable cheese flavor, although a fresh laminated twist sold warm at a café needs different handling from a dry straw stored on a retail shelf. Manufacturers need to choose the dough and package around the intended occasion, since a coffee accompaniment may be served as an individual piece while an entertaining pack has to protect several servings after opening. Buyers compare the number of intact pieces available for sale and allow for stale stock or unsold fresh units when assessing price. Country conditions shape that calculation: German suppliers compete with established bakery snacks, Dubai hospitality offers occasions for oven-finished products, and South Korean and Japanese channels require neatly protected portions. British freshly packed bakery products also need applicable allergen information. The forecast covers finished cheese-containing straws and twisted pastries, with repeat business depending on whether an outlet can store and serve them with acceptable waste. [5]
Key Market Trends & Insights
- Classic / original holds 40.0% of product type in 2026, with a recognizable cheese flavor and crisp bite giving buyers a clear basis for repeat comparison.
- Conventional holds 51.0% of claim / nature in 2026, while specialist recipes need ingredient and cross-contact controls that preserve the snack’s expected texture.
- Fresh holds 39.0% of format in 2026, offering warm bakery presentation within a selling period that requires careful replenishment to limit leftovers.
- Multipack holds 30.0% of packaging format in 2026, with value depending on pieces arriving intact and the remaining snack staying crisp after opening.
Regional Highlights
- UAE has the highest profiled CAGR at 12.6% during 2026–2036.
- The next two profiled growth rates are Saudi Arabia at 12.3% and USA at 11.9% over the same period.
Market Size & Forecast
| Metric | Value |
|---|---|
| 2025 market value | USD 395.3 Million |
| 2026 market estimate | USD 440.0 Million |
| 2036 market forecast | USD 1,283.5 Million |
| Forecast CAGR, 2026-2036 | 11.3% |
The market covers finished cheese-containing straws and twisted pastries across the stated product, claim, storage, packaging and sales-channel categories. Plain pastry dough, unrelated savory biscuits, filled pies and additional meal-service revenue are excluded.
Cheese straws and twists sit within bakery products, but dry packaged straws and fresh laminated twists require different texture and shelf-life expectations.
Bakery buying and handling
| Documented operating context | Source |
|---|---|
| FSANZ reviewed the first year of mandatory plain-English allergen labelling in March 2025. | [1] |
| Australian authorities reminded food importers about plain-English allergen labelling in October 2025. | [2] |
| USDA’s February 2025 analysis separates spending on food at home from food away from home. | [3] |
| AMF and Puratos announced a joint pilot bakery in June 2025 for commercial baking development. | [4] |
Analyst Perspective
Retail and hospitality buyers need to know how many intact, appealing cheese snacks remain after delivery and the intended holding period. Suppliers can make the serving cost clearer by matching dough, packaging and preparation guidance to the difference between a dry straw and a fresh laminated twist.
- Nandini Roy Choudhury, Principal Analyst at Future Market Insights
How is the cheese straws & twists market segmented?
Product Type covers Classic / original, Whole grain & seeded, Flavored & filled, Mini & snacking formats and Premium / artisan. Claim / Nature covers Conventional, Clean label, Organic, Gluten-free and High-protein / fortified. Format covers Fresh, Frozen, Ambient packaged, Chilled and Par-baked / thaw-and-serve. Packaging Format covers Multipack, Single-serve, Family / loaf pack and Bulk foodservice. Sales Channel covers Supermarkets & hypermarkets, Artisan & specialty bakeries, Convenience & forecourt, Online & DTC and Foodservice distributors.
Serving patterns in ready-to-eat food create opportunities for savory bakery snacks that can be offered without assembling a full meal.
Why does Classic / original lead product type demand?
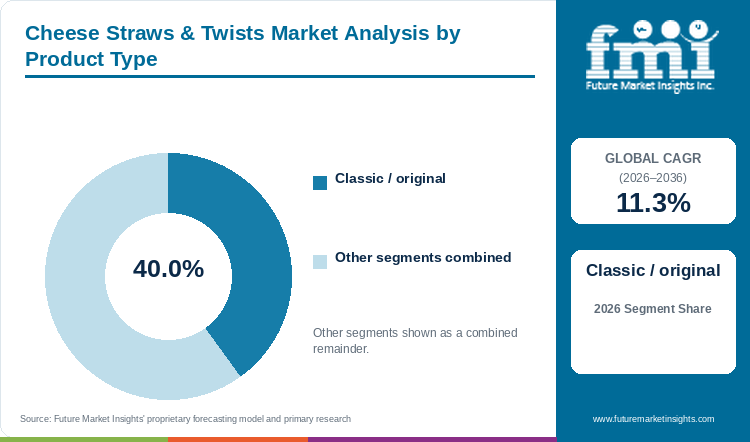
Classic / original: 40.0% of product type in 2026.
An original cheese-led recipe gives buyers a clear basis for assessing flavor consistency, since simple seasoning leaves differences between batches easier to notice. Crispness should extend across the whole straw or twist, with even cheese distribution allowing the final bite to resemble the first. Seeded and filled variants can broaden the assortment, while the classic line supplies a familiar price and taste against which retailers can test those additions. Keeping the core product dependable helps avoid replacing an everyday seller with a wider range that is harder to replenish.
- The Classic / original segment accounts for 40.0% of product type in 2026.
- Keeping seasoning simple makes changes in cheese intensity and baking consistency easier to identify during product trials.
Why does Conventional lead claim / nature demand?
Conventional: 51.0% of claim / nature in 2026.
Conventional recipes let producers adjust dairy cheese and wheat-based dough to the intended format, including the different moisture requirements of a dry straw and a fresh laminated twist. Ingredient cost needs to be weighed against the number of pieces that remain saleable after delivery, because fragile products can produce a poor return despite an attractive factory price. Gluten-free or clean-label versions may suit particular buyers, with their own formulation work, ingredient records and cross-contact controls, while both ranges still need a recognizable cheese taste and an intact serving.
- The Conventional segment accounts for 51.0% of claim / nature in 2026.
- The cost per intact serving gives buyers a better comparison than ingredient cost when products differ in fragility.
What are the drivers, restraints, and opportunities in the cheese straws & twists market?
Savory snacks broaden bakery occasions
Cheese twists can give cafés a savory accompaniment to beverages and supermarkets a warm item for shoppers between meals. Packaged straws serve a different purpose in sharing bowls or entertaining assortments. Each occasion changes the useful piece size and quantity prepared. Outlets need holding instructions that help staff replenish around demand rather than leave a large batch to lose texture. Suppliers can develop those formats without assuming that a premium cheese name alone will secure a higher price. The snack must be convenient to serve and remain appealing until it is sold.
Humidity and breakage erode the selling price
Humidity and handling can reduce saleable cheese snacks through softening or breakage before the stated shelf life ends, making a joint recipe and packaging trial necessary. Larger bags need protection after repeated opening, while fresh counters must preserve texture during a shorter display period. Allergen labeling and cross-contact controls remain necessary alongside realistic transport and holding tests that establish how many pieces can still be sold at full price.
Channel-specific packs protect crisp texture
Small-batch bake-off gives outlets without a full bakery team a way to offer warm cheese twists. The instructions need to suit the available oven and a quantity staff can sell before texture declines. Packaged ranges have a separate opportunity in portions that retain crunch after opening. Individual protection can reduce breakage and service losses in hospitality. In both cases suppliers should establish how many usable servings a case delivers. That gives buyers a more concrete reason to choose the product than an untested premium positioning.
The frozen baked goods route is relevant to bake-off cheese twists, where final preparation can be scheduled around the outlet’s busiest periods.
Which country and market CAGRs are profiled for cheese straws & twists?
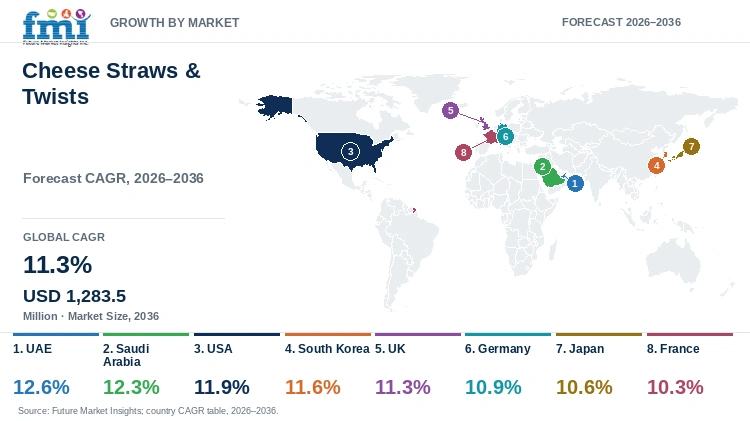
| Country | CAGR |
|---|---|
| UAE | 12.6% |
| Saudi Arabia | 12.3% |
| USA | 11.9% |
| South Korea | 11.6% |
| UK | 11.3% |
| Germany | 10.9% |
| Japan | 10.6% |
| France | 10.3% |
Country-wise Analysis
UAE
- UAE hotels and cafés can time the final bake of frozen twists around guest arrivals and busy service periods. The forecast is 12.6% CAGR during 2026–2036. Exporters need to agree cheese composition and labeling with local distributors as well as delivery conditions. A dry packaged straw should be offered separately from a fresh twist because the intended texture and shelf life differ. Repeat hotel orders depend on those distinctions being clear enough for staff to store and serve the product correctly.
Saudi Arabia
- Saudi cafés and catering outlets can use consistent oven-finished cheese snacks, with a 12.3% CAGR forecast from 2026 to 2036 accompanying demand from tourism-related service. Local labeling, applicable halal suitability and temperature exposure need to be addressed before supply begins. Opening cases after the intended journey and counting display-quality pieces makes the cost of fragile shapes visible before the factory price becomes a recurring delivery expense.
USA
- A sharing bag and an individual cheese accompaniment serve different customers in American grocery and specialty accounts. The USA forecast CAGR is 11.9% from 2026 to 2036. A common recipe may work for both but the packaging and portion cost need to match the occasion. Milk and wheat allergen information must remain accurate. Buyers also need holding trials that show whether cheese flavor and crispness persist. Transport protection should prevent broken pieces without packing the product so tightly that it loses the texture customers expect.
South Korea
- Small protected portions can fit South Korean convenience purchases and online assortments, although packaging support needs to protect fragile pieces without forcing an oversized serving. The country’s forecast is an 11.6% CAGR from 2026 to 2036, with local trials helping establish cheese intensity and portion size. Clear translated labels and resistance to softening support repeat buying after the imported product has passed its initial trial.
UK
- British retailers can distinguish an everyday savory accompaniment from a sharing snack through portion size and seasoning. The UK is forecast to grow at an 11.3% CAGR from 2026 to 2036. The same bag will not necessarily work in grocery and hospitality. Fresh counters also need to adjust packing and labeling to how the item is sold. Suppliers should assess how much stock remains unsold after a normal service rather than judge the listing by shelf space alone. Consistent crispness makes both the price and repeat purchase easier to sustain.
Germany
- German cheese snacks compete with an established assortment of salty pastries and savory biscuits, so buyers need a clear serving occasion and a dependable product before adding another line. Germany is forecast to grow at a 10.9% CAGR from 2026 to 2036. A distinctive cheese taste can help but the product must arrive with enough intact pieces to justify its price. Fresh counters may prefer a ready item while bakery networks may use freezer-to-oven twists. Each format has to fit available labor and preparation space without increasing waste from fragile shapes.
Japan
- Japanese stores need cheese snacks that remain presentable inside the pack, with single sealed pieces making replenishment more straightforward than an open bakery display. Japan is expected to progress at a 10.6% CAGR from 2026 to 2036. Trials should also examine how much customers eat in one sitting before choosing a larger resealable format. Long straws and decorative twists need adequate transit protection. Frozen versions bring a further requirement for dependable oven instructions so that staff can achieve the intended texture without improvising.
France
- French foodservice kitchens may serve cheese straws alongside another item, which changes the useful size and number of pieces per case compared with a standalone snack. France has a 10.3% CAGR from 2026 to 2036, the lowest rate among the profiled countries. The finished snack still needs enough cheese flavor and crispness to justify purchasing it instead of making a simple alternative in-house. Frozen twists can serve chains with limited production space while fresh specialist products compete more directly on pastry finish.
Who are the notable companies in the cheese straws & twists market?
John Wm. Macy’s; Mississippi Cheese Straw Factory; The Fine Cheese Co.; Vandemoortele; Mama Geraldine’s
Competition separates into packaged snack specialists and suppliers of fresh or bake-off savory pastry. A dry straw manufacturer must protect crispness over distribution, while a twist supplier is judged by the result after finishing at the outlet.
Competitive Benchmarking: Cheese Straws & Twists Market
| Participant | Commercial focus | Buyer qualification priority |
|---|---|---|
| John Wm. Macy’s | Packaged cheese snacks | Crispness and transit breakage |
| Mississippi Cheese Straw Factory | Cheese straws | Flavor consistency and protective packing |
| The Fine Cheese Co. | Savory cheese accompaniments | Occasion fit and pack presentation |
| Vandemoortele | Bake-off savory pastries | Oven finishing and counter turnover |
| Mama Geraldine’s | Packaged cheese straws | Texture retention and portion value |
Key Developments in the Cheese Straws & Twists Market
- FSANZ reviewed the first year of mandatory plain-English allergen labelling in March 2025. [1]
- Australian authorities reminded food importers about plain-English allergen labelling in October 2025. [2]
Key Players in the Cheese Straws & Twists Market
- John Wm. Macy’s
- Mississippi Cheese Straw Factory
- The Fine Cheese Co.
- Vandemoortele
- Mama Geraldine’s
Cheese Straws & Twists Market - Report Scope
| Coverage field | Report scope |
|---|---|
| Market breakdown | Product Type; Claim / Nature; Format; Packaging Format; Sales Channel; Region |
| Quantitative unit | USD Million |
| Market definition | The market covers finished cheese-containing straws and twisted pastries across the stated product, claim, storage, packaging and sales-channel categories. Plain pastry dough, unrelated savory biscuits, filled pies and additional meal-service revenue are excluded. |
| Regions covered | North America; Latin America; Western Europe; Eastern Europe; East Asia; South Asia and Pacific; Middle East and Africa |
| Countries / markets profiled | UAE; Saudi Arabia; USA; South Korea; UK; Germany; Japan; France |
| Key companies profiled | John Wm. Macy’s; Mississippi Cheese Straw Factory; The Fine Cheese Co.; Vandemoortele; Mama Geraldine’s |
| Base year / forecast period | 2026 / 2026–2036 |
| Estimate coverage | 2025 and 2026 market estimates; 2036 forecast; segment shares and country / market CAGRs. |
Cheese Straws & Twists Market - Research Methodology
| Method | Application |
|---|---|
| Market definition | The analysis follows the stated product or service boundary and distinguishes direct category revenue from adjacent activities. |
| Secondary research | Official technical, regulatory, research and company publications provide the documented operating context and recent developments cited in this report. |
| Forecast and segmentation | Market estimates, segment shares and geographic forecasts are presented as analytical estimates within the stated commercial scope. |
| Competitive assessment | Participants are compared by their relevant products or services, commercial role and buyer qualification requirements. |
| Interpretation | The assessment considers purchasing conditions and the scope of the documented product, service or performance claim. |
Cheese Straws & Twists Market by Segments
Product Type
- Classic / original
- Whole grain & seeded
- Flavored & filled
- Mini & snacking formats
- Premium / artisan
Claim / Nature
- Conventional
- Clean label
- Organic
- Gluten-free
- High-protein / fortified
Format
- Fresh
- Frozen
- Ambient packaged
- Chilled
- Par-baked / thaw-and-serve
Packaging Format
- Multipack
- Single-serve
- Family / loaf pack
- Bulk foodservice
Sales Channel
- Supermarkets & hypermarkets
- Artisan & specialty bakeries
- Convenience & forecourt
- Online & DTC
- Foodservice distributors
Cheese Straws & Twists Market by Region
- North America
- United States
- Canada
- Latin America
- Brazil
- Mexico
- Argentina
- Chile
- Western Europe
- Germany
- France
- United Kingdom
- Italy
- Spain
- Benelux
- Nordics
- Eastern Europe
- Poland
- Czech Republic
- Romania
- Hungary
- East Asia
- China
- Japan
- South Korea
- South Asia and Pacific
- India
- ASEAN
- Australia and New Zealand
- Middle East and Africa
- GCC Countries
- South Africa
- Türkiye
- Israel
Research Sources and Bibliography
- [1] Food Standards Australia New Zealand. (2025, March 5). Plain English Allergen Labelling: One year of clearer, safer food labels.
- [2] Australian Government, Department of Agriculture, Fisheries and Forestry. (2025, October 14). Reminder for importers about plain English allergen labelling.
- [3] U.S. Department of Agriculture, Economic Research Service. (2025, February 24). Food spending in the United States.
- [4] AMF Bakery Systems. (2025, June 9). AMF and Puratos launch joint pilot bakery facility to accelerate commercial baking innovation.
- [5] Future Market Insights. (2026). Cheese Straws & Twists Market: Global industry analysis and opportunity assessment, 2026–2036.
This Report Answers
- How large is the cheese straws & twists market in 2026?
- What value and CAGR are forecast through 2036?
- Which product type segment leads in 2026?
- Which claim / nature segment has the largest share?
- Which profiled country or market has the fastest forecast growth?
- Which participants are covered in the competitive assessment?
Table of Content
- Key Takeaways
- Market Size and CAGR
- Top Growth Driver
- Fastest Growing Segment
- Leading Region
- Key Companies
- Emerging Opportunities
- Executive Summary
- Global Market Outlook
- Demand-side Trends
- Supply-side Trends
- Technology Roadmap Analysis
- Analysis and Recommendations
- Analyst Perspective (What is happening? Why now? What should investors know?)
- Key Questions Answered
- How large is the market?
- What is the CAGR?
- What are key trends?
- Which region dominates?
- Who are the leaders?
Read More...
- Market Overview
- Market Coverage / Taxonomy
- Market Definition / Scope / Limitations
- Research Methodology
- Chapter Orientation
- Analytical Lens and Working Hypotheses
- Market Structure, Signals, and Trend Drivers
- Benchmarking and Cross-market Comparability
- Market Sizing, Forecasting, and Opportunity Mapping
- Research Design and Evidence Framework
- Desk Research Programme (Secondary Evidence)
- Expert Input and Fieldwork (Primary Evidence)
- Tooling, Models, and Reference Databases
- Data Engineering and Model Build
- Quality Assurance and Audit Trail
- Market Background
- Market Dynamics (Drivers, Restraints, Opportunity, Trends)
- Scenario Forecast (Optimistic, Likely, Conservative)
- Impact Analysis
- AI Impact
- Sustainability Impact
- Regulatory Impact
- Technology Impact
- Consumer / Buyer Analysis
- Purchase Drivers
- Adoption Barriers
- Buyer Journey
- Opportunity Map Analysis
- Product Life Cycle Analysis
- Supply Chain Analysis
- Investment Feasibility Matrix
- Value Chain Analysis
- PESTLE and Porter's Analysis
- Regulatory Landscape
- Regional Parent Market Outlook
- Production and Consumption Statistics
- Import and Export Statistics
- Global Market Analysis and Forecast, 2021 to 2036
- Historical Market Size Value (USD Million) Analysis, 2021 to 2025
- Current and Future Market Size Value (USD Million) Projections, 2026 to 2036
- Y-o-Y Growth Trend Analysis
- Absolute $ Opportunity Analysis
- Global Market Pricing Analysis, 2021 to 2036
- Global Market Analysis and Forecast, By Product Type, 2021 to 2036
- Introduction / Key Findings
- Historical Market Size Value (USD Million) Analysis By Product Type, 2021 to 2025
- Current and Future Market Size Value (USD Million) Analysis and Forecast By Product Type, 2026 to 2036
- Classic / original
- Whole grain & seeded
- Flavored & filled
- Mini & snacking formats
- Premium / artisan
- Y-o-Y Growth Trend Analysis By Product Type, 2021 to 2025
- Absolute $ Opportunity Analysis By Product Type, 2026 to 2036
- Global Market Analysis and Forecast, By Claim / Nature, 2021 to 2036
- Introduction / Key Findings
- Historical Market Size Value (USD Million) Analysis By Claim / Nature, 2021 to 2025
- Current and Future Market Size Value (USD Million) Analysis and Forecast By Claim / Nature, 2026 to 2036
- Conventional
- Clean label
- Organic
- Gluten-free
- High-protein / fortified
- Y-o-Y Growth Trend Analysis By Claim / Nature, 2021 to 2025
- Absolute $ Opportunity Analysis By Claim / Nature, 2026 to 2036
- Global Market Analysis and Forecast, By Format, 2021 to 2036
- Introduction / Key Findings
- Historical Market Size Value (USD Million) Analysis By Format, 2021 to 2025
- Current and Future Market Size Value (USD Million) Analysis and Forecast By Format, 2026 to 2036
- Fresh
- Frozen
- Ambient packaged
- Chilled
- Par-baked / thaw-and-serve
- Y-o-Y Growth Trend Analysis By Format, 2021 to 2025
- Absolute $ Opportunity Analysis By Format, 2026 to 2036
- Global Market Analysis and Forecast, By Packaging Format, 2021 to 2036
- Introduction / Key Findings
- Historical Market Size Value (USD Million) Analysis By Packaging Format, 2021 to 2025
- Current and Future Market Size Value (USD Million) Analysis and Forecast By Packaging Format, 2026 to 2036
- Multipack
- Single-serve
- Family / loaf pack
- Bulk foodservice
- Y-o-Y Growth Trend Analysis By Packaging Format, 2021 to 2025
- Absolute $ Opportunity Analysis By Packaging Format, 2026 to 2036
- Global Market Analysis and Forecast, By Sales Channel, 2021 to 2036
- Introduction / Key Findings
- Historical Market Size Value (USD Million) Analysis By Sales Channel, 2021 to 2025
- Current and Future Market Size Value (USD Million) Analysis and Forecast By Sales Channel, 2026 to 2036
- Supermarkets & hypermarkets
- Artisan & specialty bakeries
- Convenience & forecourt
- Online & DTC
- Foodservice distributors
- Y-o-Y Growth Trend Analysis By Sales Channel, 2021 to 2025
- Absolute $ Opportunity Analysis By Sales Channel, 2026 to 2036
- Global Market Analysis and Forecast, By Region, 2021 to 2036
- Introduction
- Historical Market Size Value (USD Million) Analysis By Region, 2021 to 2025
- Current Market Size Value (USD Million) Analysis and Forecast By Region, 2026 to 2036
- North America
- Latin America
- Western Europe
- Eastern Europe
- East Asia
- South Asia and Pacific
- Middle East and Africa
- Market Attractiveness Analysis By Region
- North America Market Analysis and Forecast, By Country, 2021 to 2036
- Historical Market Size Value (USD Million) Trend Analysis By Market Taxonomy, 2021 to 2025
- Market Size Value (USD Million) Forecast By Market Taxonomy, 2026 to 2036
- By Country
- United States
- Canada
- By Product Type
- By Claim / Nature
- By Format
- By Packaging Format
- By Sales Channel
- By Country
- Market Attractiveness Analysis
- By Country
- By Product Type
- By Claim / Nature
- By Format
- By Packaging Format
- By Sales Channel
- Key Takeaways
- Latin America Market Analysis and Forecast, By Country
- Historical Market Size Value (USD Million) Trend Analysis By Market Taxonomy, 2021 to 2025
- Market Size Value (USD Million) Forecast By Market Taxonomy, 2026 to 2036
- By Country
- Brazil
- Mexico
- Argentina
- Chile
- By Product Type
- By Claim / Nature
- By Format
- By Packaging Format
- By Sales Channel
- By Country
- Market Attractiveness Analysis
- By Country
- By Product Type
- By Claim / Nature
- By Format
- By Packaging Format
- By Sales Channel
- Key Takeaways
- Western Europe Market Analysis and Forecast, By Country
- Historical Market Size Value (USD Million) Trend Analysis By Market Taxonomy, 2021 to 2025
- Market Size Value (USD Million) Forecast By Market Taxonomy, 2026 to 2036
- By Country
- Germany
- France
- United Kingdom
- Italy
- Spain
- Benelux
- Nordics
- By Product Type
- By Claim / Nature
- By Format
- By Packaging Format
- By Sales Channel
- By Country
- Market Attractiveness Analysis
- By Country
- By Product Type
- By Claim / Nature
- By Format
- By Packaging Format
- By Sales Channel
- Key Takeaways
- Eastern Europe Market Analysis and Forecast, By Country
- Historical Market Size Value (USD Million) Trend Analysis By Market Taxonomy, 2021 to 2025
- Market Size Value (USD Million) Forecast By Market Taxonomy, 2026 to 2036
- By Country
- Poland
- Czech Republic
- Romania
- Hungary
- By Product Type
- By Claim / Nature
- By Format
- By Packaging Format
- By Sales Channel
- By Country
- Market Attractiveness Analysis
- By Country
- By Product Type
- By Claim / Nature
- By Format
- By Packaging Format
- By Sales Channel
- Key Takeaways
- East Asia Market Analysis and Forecast, By Country
- Historical Market Size Value (USD Million) Trend Analysis By Market Taxonomy, 2021 to 2025
- Market Size Value (USD Million) Forecast By Market Taxonomy, 2026 to 2036
- By Country
- China
- Japan
- South Korea
- By Product Type
- By Claim / Nature
- By Format
- By Packaging Format
- By Sales Channel
- By Country
- Market Attractiveness Analysis
- By Country
- By Product Type
- By Claim / Nature
- By Format
- By Packaging Format
- By Sales Channel
- Key Takeaways
- South Asia and Pacific Market Analysis and Forecast, By Country
- Historical Market Size Value (USD Million) Trend Analysis By Market Taxonomy, 2021 to 2025
- Market Size Value (USD Million) Forecast By Market Taxonomy, 2026 to 2036
- By Country
- India
- ASEAN
- Australia and New Zealand
- By Product Type
- By Claim / Nature
- By Format
- By Packaging Format
- By Sales Channel
- By Country
- Market Attractiveness Analysis
- By Country
- By Product Type
- By Claim / Nature
- By Format
- By Packaging Format
- By Sales Channel
- Key Takeaways
- Middle East and Africa Market Analysis and Forecast, By Country
- Historical Market Size Value (USD Million) Trend Analysis By Market Taxonomy, 2021 to 2025
- Market Size Value (USD Million) Forecast By Market Taxonomy, 2026 to 2036
- By Country
- GCC Countries
- South Africa
- Türkiye
- Israel
- By Product Type
- By Claim / Nature
- By Format
- By Packaging Format
- By Sales Channel
- By Country
- Market Attractiveness Analysis
- By Country
- By Product Type
- By Claim / Nature
- By Format
- By Packaging Format
- By Sales Channel
- Key Takeaways
- Key Countries Market Analysis
- United States
- Pricing Analysis
- Market Share Analysis, 2025
- By Product Type
- By Claim / Nature
- By Format
- By Packaging Format
- By Sales Channel
- Canada
- Pricing Analysis
- Market Share Analysis, 2025
- By Product Type
- By Claim / Nature
- By Format
- By Packaging Format
- By Sales Channel
- Mexico
- Pricing Analysis
- Market Share Analysis, 2025
- By Product Type
- By Claim / Nature
- By Format
- By Packaging Format
- By Sales Channel
- Brazil
- Pricing Analysis
- Market Share Analysis, 2025
- By Product Type
- By Claim / Nature
- By Format
- By Packaging Format
- By Sales Channel
- Chile
- Pricing Analysis
- Market Share Analysis, 2025
- By Product Type
- By Claim / Nature
- By Format
- By Packaging Format
- By Sales Channel
- Germany
- Pricing Analysis
- Market Share Analysis, 2025
- By Product Type
- By Claim / Nature
- By Format
- By Packaging Format
- By Sales Channel
- United Kingdom
- Pricing Analysis
- Market Share Analysis, 2025
- By Product Type
- By Claim / Nature
- By Format
- By Packaging Format
- By Sales Channel
- Italy
- Pricing Analysis
- Market Share Analysis, 2025
- By Product Type
- By Claim / Nature
- By Format
- By Packaging Format
- By Sales Channel
- Spain
- Pricing Analysis
- Market Share Analysis, 2025
- By Product Type
- By Claim / Nature
- By Format
- By Packaging Format
- By Sales Channel
- France
- Pricing Analysis
- Market Share Analysis, 2025
- By Product Type
- By Claim / Nature
- By Format
- By Packaging Format
- By Sales Channel
- India
- Pricing Analysis
- Market Share Analysis, 2025
- By Product Type
- By Claim / Nature
- By Format
- By Packaging Format
- By Sales Channel
- ASEAN
- Pricing Analysis
- Market Share Analysis, 2025
- By Product Type
- By Claim / Nature
- By Format
- By Packaging Format
- By Sales Channel
- Australia and New Zealand
- Pricing Analysis
- Market Share Analysis, 2025
- By Product Type
- By Claim / Nature
- By Format
- By Packaging Format
- By Sales Channel
- China
- Pricing Analysis
- Market Share Analysis, 2025
- By Product Type
- By Claim / Nature
- By Format
- By Packaging Format
- By Sales Channel
- Japan
- Pricing Analysis
- Market Share Analysis, 2025
- By Product Type
- By Claim / Nature
- By Format
- By Packaging Format
- By Sales Channel
- South Korea
- Pricing Analysis
- Market Share Analysis, 2025
- By Product Type
- By Claim / Nature
- By Format
- By Packaging Format
- By Sales Channel
- Poland
- Pricing Analysis
- Market Share Analysis, 2025
- By Product Type
- By Claim / Nature
- By Format
- By Packaging Format
- By Sales Channel
- Hungary
- Pricing Analysis
- Market Share Analysis, 2025
- By Product Type
- By Claim / Nature
- By Format
- By Packaging Format
- By Sales Channel
- Türkiye
- Pricing Analysis
- Market Share Analysis, 2025
- By Product Type
- By Claim / Nature
- By Format
- By Packaging Format
- By Sales Channel
- South Africa
- Pricing Analysis
- Market Share Analysis, 2025
- By Product Type
- By Claim / Nature
- By Format
- By Packaging Format
- By Sales Channel
- UAE
- Pricing Analysis
- Market Share Analysis, 2025
- By Product Type
- By Claim / Nature
- By Format
- By Packaging Format
- By Sales Channel
- Saudi Arabia
- Pricing Analysis
- Market Share Analysis, 2025
- By Product Type
- By Claim / Nature
- By Format
- By Packaging Format
- By Sales Channel
- United States
- Market Structure Analysis
- Competition Dashboard
- Competition Benchmarking
- Market Share Analysis of Top Players
- By Regional
- By Product Type
- By Claim / Nature
- By Format
- By Packaging Format
- By Sales Channel
- Emerging Startups
- Innovation Benchmarking
- Competition Analysis
- Competition Deep Dive
- John Wm. Macy’s
- Overview
- Product Portfolio
- Profitability by Market Segments
- Sales Footprint
- Strategy Overview
- Marketing Strategy
- Product Strategy
- Channel Strategy
- Mississippi Cheese Straw Factory
- The Fine Cheese Co.
- Vandemoortele
- Mama Geraldine’s
- John Wm. Macy’s
- Case Studies
- Success Stories
- Recent Developments
- Competition Deep Dive
- Assumptions & Acronyms Used
List of Tables
- Table 1: Global Market Value (USD Million) Forecast by Region, 2021 to 2036
- Table 2: Global Market Value (USD Million) Forecast by Product Type, 2021 to 2036
- Table 3: Global Market Value (USD Million) Forecast by Claim / Nature, 2021 to 2036
- Table 4: Global Market Value (USD Million) Forecast by Format, 2021 to 2036
- Table 5: Global Market Value (USD Million) Forecast by Packaging Format, 2021 to 2036
- Table 6: Global Market Value (USD Million) Forecast by Sales Channel, 2021 to 2036
- Table 7: North America Market Value (USD Million) Forecast by Country, 2021 to 2036
- Table 8: North America Market Value (USD Million) Forecast by Product Type, 2021 to 2036
- Table 9: North America Market Value (USD Million) Forecast by Claim / Nature, 2021 to 2036
- Table 10: North America Market Value (USD Million) Forecast by Format, 2021 to 2036
- Table 11: North America Market Value (USD Million) Forecast by Packaging Format, 2021 to 2036
- Table 12: North America Market Value (USD Million) Forecast by Sales Channel, 2021 to 2036
- Table 13: Latin America Market Value (USD Million) Forecast by Country, 2021 to 2036
- Table 14: Latin America Market Value (USD Million) Forecast by Product Type, 2021 to 2036
- Table 15: Latin America Market Value (USD Million) Forecast by Claim / Nature, 2021 to 2036
- Table 16: Latin America Market Value (USD Million) Forecast by Format, 2021 to 2036
- Table 17: Latin America Market Value (USD Million) Forecast by Packaging Format, 2021 to 2036
- Table 18: Latin America Market Value (USD Million) Forecast by Sales Channel, 2021 to 2036
- Table 19: Western Europe Market Value (USD Million) Forecast by Country, 2021 to 2036
- Table 20: Western Europe Market Value (USD Million) Forecast by Product Type, 2021 to 2036
- Table 21: Western Europe Market Value (USD Million) Forecast by Claim / Nature, 2021 to 2036
- Table 22: Western Europe Market Value (USD Million) Forecast by Format, 2021 to 2036
- Table 23: Western Europe Market Value (USD Million) Forecast by Packaging Format, 2021 to 2036
- Table 24: Western Europe Market Value (USD Million) Forecast by Sales Channel, 2021 to 2036
- Table 25: Eastern Europe Market Value (USD Million) Forecast by Country, 2021 to 2036
- Table 26: Eastern Europe Market Value (USD Million) Forecast by Product Type, 2021 to 2036
- Table 27: Eastern Europe Market Value (USD Million) Forecast by Claim / Nature, 2021 to 2036
- Table 28: Eastern Europe Market Value (USD Million) Forecast by Format, 2021 to 2036
- Table 29: Eastern Europe Market Value (USD Million) Forecast by Packaging Format, 2021 to 2036
- Table 30: Eastern Europe Market Value (USD Million) Forecast by Sales Channel, 2021 to 2036
- Table 31: East Asia Market Value (USD Million) Forecast by Country, 2021 to 2036
- Table 32: East Asia Market Value (USD Million) Forecast by Product Type, 2021 to 2036
- Table 33: East Asia Market Value (USD Million) Forecast by Claim / Nature, 2021 to 2036
- Table 34: East Asia Market Value (USD Million) Forecast by Format, 2021 to 2036
- Table 35: East Asia Market Value (USD Million) Forecast by Packaging Format, 2021 to 2036
- Table 36: East Asia Market Value (USD Million) Forecast by Sales Channel, 2021 to 2036
- Table 37: South Asia and Pacific Market Value (USD Million) Forecast by Country, 2021 to 2036
- Table 38: South Asia and Pacific Market Value (USD Million) Forecast by Product Type, 2021 to 2036
- Table 39: South Asia and Pacific Market Value (USD Million) Forecast by Claim / Nature, 2021 to 2036
- Table 40: South Asia and Pacific Market Value (USD Million) Forecast by Format, 2021 to 2036
- Table 41: South Asia and Pacific Market Value (USD Million) Forecast by Packaging Format, 2021 to 2036
- Table 42: South Asia and Pacific Market Value (USD Million) Forecast by Sales Channel, 2021 to 2036
- Table 43: Middle East and Africa Market Value (USD Million) Forecast by Country, 2021 to 2036
- Table 44: Middle East and Africa Market Value (USD Million) Forecast by Product Type, 2021 to 2036
- Table 45: Middle East and Africa Market Value (USD Million) Forecast by Claim / Nature, 2021 to 2036
- Table 46: Middle East and Africa Market Value (USD Million) Forecast by Format, 2021 to 2036
- Table 47: Middle East and Africa Market Value (USD Million) Forecast by Packaging Format, 2021 to 2036
- Table 48: Middle East and Africa Market Value (USD Million) Forecast by Sales Channel, 2021 to 2036
List of Figures
- Figure 1: Global Market Pricing Analysis
- Figure 2: Global Market Value (USD Million) Forecast 2021-2036
- Figure 3: Global Market Value Share and BPS Analysis by Product Type, 2026 and 2036
- Figure 4: Global Market Y-o-Y Growth Comparison by Product Type, 2026-2036
- Figure 5: Global Market Attractiveness Analysis by Product Type
- Figure 6: Global Market Value Share and BPS Analysis by Claim / Nature, 2026 and 2036
- Figure 7: Global Market Y-o-Y Growth Comparison by Claim / Nature, 2026-2036
- Figure 8: Global Market Attractiveness Analysis by Claim / Nature
- Figure 9: Global Market Value Share and BPS Analysis by Format, 2026 and 2036
- Figure 10: Global Market Y-o-Y Growth Comparison by Format, 2026-2036
- Figure 11: Global Market Attractiveness Analysis by Format
- Figure 12: Global Market Value Share and BPS Analysis by Packaging Format, 2026 and 2036
- Figure 13: Global Market Y-o-Y Growth Comparison by Packaging Format, 2026-2036
- Figure 14: Global Market Attractiveness Analysis by Packaging Format
- Figure 15: Global Market Value Share and BPS Analysis by Sales Channel, 2026 and 2036
- Figure 16: Global Market Y-o-Y Growth Comparison by Sales Channel, 2026-2036
- Figure 17: Global Market Attractiveness Analysis by Sales Channel
- Figure 18: Global Market Value (USD Million) Share and BPS Analysis by Region, 2026 and 2036
- Figure 19: Global Market Y-o-Y Growth Comparison by Region, 2026-2036
- Figure 20: Global Market Attractiveness Analysis by Region
- Figure 21: North America Market Incremental Dollar Opportunity, 2026-2036
- Figure 22: Latin America Market Incremental Dollar Opportunity, 2026-2036
- Figure 23: Western Europe Market Incremental Dollar Opportunity, 2026-2036
- Figure 24: Eastern Europe Market Incremental Dollar Opportunity, 2026-2036
- Figure 25: East Asia Market Incremental Dollar Opportunity, 2026-2036
- Figure 26: South Asia and Pacific Market Incremental Dollar Opportunity, 2026-2036
- Figure 27: Middle East and Africa Market Incremental Dollar Opportunity, 2026-2036
- Figure 28: North America Market Value Share and BPS Analysis by Country, 2026 and 2036
- Figure 29: North America Market Value Share and BPS Analysis by Product Type, 2026 and 2036
- Figure 30: North America Market Y-o-Y Growth Comparison by Product Type, 2026-2036
- Figure 31: North America Market Attractiveness Analysis by Product Type
- Figure 32: North America Market Value Share and BPS Analysis by Claim / Nature, 2026 and 2036
- Figure 33: North America Market Y-o-Y Growth Comparison by Claim / Nature, 2026-2036
- Figure 34: North America Market Attractiveness Analysis by Claim / Nature
- Figure 35: North America Market Value Share and BPS Analysis by Format, 2026 and 2036
- Figure 36: North America Market Y-o-Y Growth Comparison by Format, 2026-2036
- Figure 37: North America Market Attractiveness Analysis by Format
- Figure 38: North America Market Value Share and BPS Analysis by Packaging Format, 2026 and 2036
- Figure 39: North America Market Y-o-Y Growth Comparison by Packaging Format, 2026-2036
- Figure 40: North America Market Attractiveness Analysis by Packaging Format
- Figure 41: North America Market Value Share and BPS Analysis by Sales Channel, 2026 and 2036
- Figure 42: North America Market Y-o-Y Growth Comparison by Sales Channel, 2026-2036
- Figure 43: North America Market Attractiveness Analysis by Sales Channel
- Figure 44: Latin America Market Value Share and BPS Analysis by Country, 2026 and 2036
- Figure 45: Latin America Market Value Share and BPS Analysis by Product Type, 2026 and 2036
- Figure 46: Latin America Market Y-o-Y Growth Comparison by Product Type, 2026-2036
- Figure 47: Latin America Market Attractiveness Analysis by Product Type
- Figure 48: Latin America Market Value Share and BPS Analysis by Claim / Nature, 2026 and 2036
- Figure 49: Latin America Market Y-o-Y Growth Comparison by Claim / Nature, 2026-2036
- Figure 50: Latin America Market Attractiveness Analysis by Claim / Nature
- Figure 51: Latin America Market Value Share and BPS Analysis by Format, 2026 and 2036
- Figure 52: Latin America Market Y-o-Y Growth Comparison by Format, 2026-2036
- Figure 53: Latin America Market Attractiveness Analysis by Format
- Figure 54: Latin America Market Value Share and BPS Analysis by Packaging Format, 2026 and 2036
- Figure 55: Latin America Market Y-o-Y Growth Comparison by Packaging Format, 2026-2036
- Figure 56: Latin America Market Attractiveness Analysis by Packaging Format
- Figure 57: Latin America Market Value Share and BPS Analysis by Sales Channel, 2026 and 2036
- Figure 58: Latin America Market Y-o-Y Growth Comparison by Sales Channel, 2026-2036
- Figure 59: Latin America Market Attractiveness Analysis by Sales Channel
- Figure 60: Western Europe Market Value Share and BPS Analysis by Country, 2026 and 2036
- Figure 61: Western Europe Market Value Share and BPS Analysis by Product Type, 2026 and 2036
- Figure 62: Western Europe Market Y-o-Y Growth Comparison by Product Type, 2026-2036
- Figure 63: Western Europe Market Attractiveness Analysis by Product Type
- Figure 64: Western Europe Market Value Share and BPS Analysis by Claim / Nature, 2026 and 2036
- Figure 65: Western Europe Market Y-o-Y Growth Comparison by Claim / Nature, 2026-2036
- Figure 66: Western Europe Market Attractiveness Analysis by Claim / Nature
- Figure 67: Western Europe Market Value Share and BPS Analysis by Format, 2026 and 2036
- Figure 68: Western Europe Market Y-o-Y Growth Comparison by Format, 2026-2036
- Figure 69: Western Europe Market Attractiveness Analysis by Format
- Figure 70: Western Europe Market Value Share and BPS Analysis by Packaging Format, 2026 and 2036
- Figure 71: Western Europe Market Y-o-Y Growth Comparison by Packaging Format, 2026-2036
- Figure 72: Western Europe Market Attractiveness Analysis by Packaging Format
- Figure 73: Western Europe Market Value Share and BPS Analysis by Sales Channel, 2026 and 2036
- Figure 74: Western Europe Market Y-o-Y Growth Comparison by Sales Channel, 2026-2036
- Figure 75: Western Europe Market Attractiveness Analysis by Sales Channel
- Figure 76: Eastern Europe Market Value Share and BPS Analysis by Country, 2026 and 2036
- Figure 77: Eastern Europe Market Value Share and BPS Analysis by Product Type, 2026 and 2036
- Figure 78: Eastern Europe Market Y-o-Y Growth Comparison by Product Type, 2026-2036
- Figure 79: Eastern Europe Market Attractiveness Analysis by Product Type
- Figure 80: Eastern Europe Market Value Share and BPS Analysis by Claim / Nature, 2026 and 2036
- Figure 81: Eastern Europe Market Y-o-Y Growth Comparison by Claim / Nature, 2026-2036
- Figure 82: Eastern Europe Market Attractiveness Analysis by Claim / Nature
- Figure 83: Eastern Europe Market Value Share and BPS Analysis by Format, 2026 and 2036
- Figure 84: Eastern Europe Market Y-o-Y Growth Comparison by Format, 2026-2036
- Figure 85: Eastern Europe Market Attractiveness Analysis by Format
- Figure 86: Eastern Europe Market Value Share and BPS Analysis by Packaging Format, 2026 and 2036
- Figure 87: Eastern Europe Market Y-o-Y Growth Comparison by Packaging Format, 2026-2036
- Figure 88: Eastern Europe Market Attractiveness Analysis by Packaging Format
- Figure 89: Eastern Europe Market Value Share and BPS Analysis by Sales Channel, 2026 and 2036
- Figure 90: Eastern Europe Market Y-o-Y Growth Comparison by Sales Channel, 2026-2036
- Figure 91: Eastern Europe Market Attractiveness Analysis by Sales Channel
- Figure 92: East Asia Market Value Share and BPS Analysis by Country, 2026 and 2036
- Figure 93: East Asia Market Value Share and BPS Analysis by Product Type, 2026 and 2036
- Figure 94: East Asia Market Y-o-Y Growth Comparison by Product Type, 2026-2036
- Figure 95: East Asia Market Attractiveness Analysis by Product Type
- Figure 96: East Asia Market Value Share and BPS Analysis by Claim / Nature, 2026 and 2036
- Figure 97: East Asia Market Y-o-Y Growth Comparison by Claim / Nature, 2026-2036
- Figure 98: East Asia Market Attractiveness Analysis by Claim / Nature
- Figure 99: East Asia Market Value Share and BPS Analysis by Format, 2026 and 2036
- Figure 100: East Asia Market Y-o-Y Growth Comparison by Format, 2026-2036
- Figure 101: East Asia Market Attractiveness Analysis by Format
- Figure 102: East Asia Market Value Share and BPS Analysis by Packaging Format, 2026 and 2036
- Figure 103: East Asia Market Y-o-Y Growth Comparison by Packaging Format, 2026-2036
- Figure 104: East Asia Market Attractiveness Analysis by Packaging Format
- Figure 105: East Asia Market Value Share and BPS Analysis by Sales Channel, 2026 and 2036
- Figure 106: East Asia Market Y-o-Y Growth Comparison by Sales Channel, 2026-2036
- Figure 107: East Asia Market Attractiveness Analysis by Sales Channel
- Figure 108: South Asia and Pacific Market Value Share and BPS Analysis by Country, 2026 and 2036
- Figure 109: South Asia and Pacific Market Value Share and BPS Analysis by Product Type, 2026 and 2036
- Figure 110: South Asia and Pacific Market Y-o-Y Growth Comparison by Product Type, 2026-2036
- Figure 111: South Asia and Pacific Market Attractiveness Analysis by Product Type
- Figure 112: South Asia and Pacific Market Value Share and BPS Analysis by Claim / Nature, 2026 and 2036
- Figure 113: South Asia and Pacific Market Y-o-Y Growth Comparison by Claim / Nature, 2026-2036
- Figure 114: South Asia and Pacific Market Attractiveness Analysis by Claim / Nature
- Figure 115: South Asia and Pacific Market Value Share and BPS Analysis by Format, 2026 and 2036
- Figure 116: South Asia and Pacific Market Y-o-Y Growth Comparison by Format, 2026-2036
- Figure 117: South Asia and Pacific Market Attractiveness Analysis by Format
- Figure 118: South Asia and Pacific Market Value Share and BPS Analysis by Packaging Format, 2026 and 2036
- Figure 119: South Asia and Pacific Market Y-o-Y Growth Comparison by Packaging Format, 2026-2036
- Figure 120: South Asia and Pacific Market Attractiveness Analysis by Packaging Format
- Figure 121: South Asia and Pacific Market Value Share and BPS Analysis by Sales Channel, 2026 and 2036
- Figure 122: South Asia and Pacific Market Y-o-Y Growth Comparison by Sales Channel, 2026-2036
- Figure 123: South Asia and Pacific Market Attractiveness Analysis by Sales Channel
- Figure 124: Middle East and Africa Market Value Share and BPS Analysis by Country, 2026 and 2036
- Figure 125: Middle East and Africa Market Value Share and BPS Analysis by Product Type, 2026 and 2036
- Figure 126: Middle East and Africa Market Y-o-Y Growth Comparison by Product Type, 2026-2036
- Figure 127: Middle East and Africa Market Attractiveness Analysis by Product Type
- Figure 128: Middle East and Africa Market Value Share and BPS Analysis by Claim / Nature, 2026 and 2036
- Figure 129: Middle East and Africa Market Y-o-Y Growth Comparison by Claim / Nature, 2026-2036
- Figure 130: Middle East and Africa Market Attractiveness Analysis by Claim / Nature
- Figure 131: Middle East and Africa Market Value Share and BPS Analysis by Format, 2026 and 2036
- Figure 132: Middle East and Africa Market Y-o-Y Growth Comparison by Format, 2026-2036
- Figure 133: Middle East and Africa Market Attractiveness Analysis by Format
- Figure 134: Middle East and Africa Market Value Share and BPS Analysis by Packaging Format, 2026 and 2036
- Figure 135: Middle East and Africa Market Y-o-Y Growth Comparison by Packaging Format, 2026-2036
- Figure 136: Middle East and Africa Market Attractiveness Analysis by Packaging Format
- Figure 137: Middle East and Africa Market Value Share and BPS Analysis by Sales Channel, 2026 and 2036
- Figure 138: Middle East and Africa Market Y-o-Y Growth Comparison by Sales Channel, 2026-2036
- Figure 139: Middle East and Africa Market Attractiveness Analysis by Sales Channel
- Figure 140: Global Market - Tier Structure Analysis
- Figure 141: Global Market - Company Share Analysis
Frequently Asked Questions
How large is the cheese straws & twists market in 2026?
The market was valued at USD 395.3 Million in 2025 and is expected to reach USD 440.0 Million in 2026.
What value and CAGR are forecast through 2036?
The market is projected to reach USD 1,283.5 Million by 2036, with an 11.3% CAGR during 2026–2036.
Which product type segment leads in 2026?
The Classic / original segment accounts for 40.0% of product type in 2026.
Which claim / nature segment has the largest share?
The Conventional segment accounts for 51.0% of claim / nature in 2026.
Which profiled country or market has the fastest forecast growth?
UAE has the highest profiled CAGR at 12.6% during 2026–2036.
Which participants are covered in the competitive assessment?
The assessment covers John Wm. Macy’s, Mississippi Cheese Straw Factory, The Fine Cheese Co., Vandemoortele and Mama Geraldine’s.
Preview the report firsthand - request a free sample
Get SampleGet the brochure for pricing and purchase details.
Get PDF
