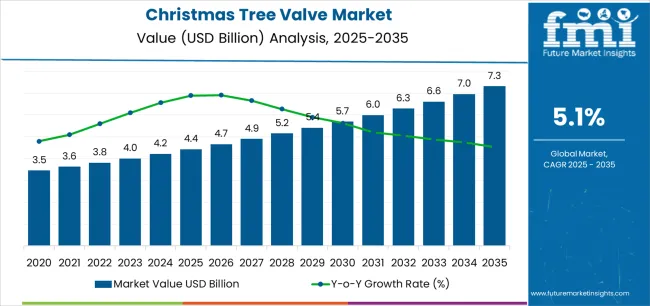
The Christmas Tree Valve Market is estimated to be valued at USD 4.4 billion in 2025 and is projected to reach USD 7.3 billion by 2035, registering a compound annual growth rate (CAGR) of 5.1% over the forecast period.
The Christmas Tree Valve market is experiencing robust growth driven by the increasing development of oil and gas extraction projects and the growing emphasis on operational safety and efficiency in upstream activities. The market outlook is largely influenced by rising global energy demand and the need for reliable wellhead equipment to manage complex drilling operations.
Advancements in automation technologies, along with the integration of real-time monitoring and control systems, have enhanced the performance and reliability of Christmas tree valves. Increasing investments in offshore and onshore exploration, coupled with stringent safety and regulatory standards, are supporting the adoption of advanced valve solutions.
Moreover, the focus on reducing operational downtime and improving asset longevity is contributing to higher demand for technologically advanced Christmas tree valves As oil and gas operators continue to prioritize safety, efficiency, and cost optimization, the market for these valves is anticipated to grow steadily in both mature and emerging energy markets.

| Metric | Value |
|---|---|
| Christmas Tree Valve Market Estimated Value in (2025 E) | USD 4.4 billion |
| Christmas Tree Valve Market Forecast Value in (2035 F) | USD 7.3 billion |
| Forecast CAGR (2025 to 2035) | 5.1% |
The market is segmented by Product Type and Application and region. By Product Type, the market is divided into Automatic and Manual. In terms of Application, the market is classified into Onshore and Offshore. Regionally, the market is classified into North America, Latin America, Western Europe, Eastern Europe, Balkan & Baltic Countries, Russia & Belarus, Central Asia, East Asia, South Asia & Pacific, and the Middle East & Africa.

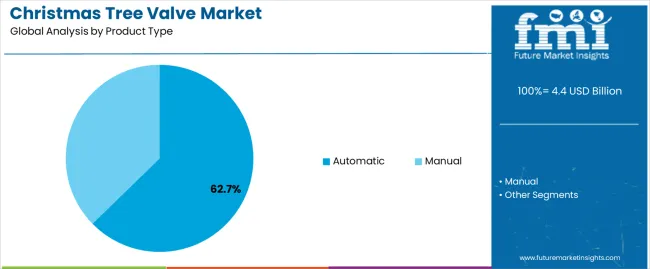
The automatic product type segment is projected to hold 62.70% of the Christmas Tree Valve market revenue share in 2025, making it the leading product type. The growth of this segment is driven by the increasing demand for automation in oil and gas wellhead operations, which enhances operational safety, efficiency, and precision.
Automatic valves allow for remote operation and real-time monitoring, reducing the risk of human error and improving response times in critical scenarios. The integration of intelligent control systems further supports predictive maintenance and operational optimization.
Additionally, the ability to handle high pressure and complex well conditions has made automatic valves the preferred choice for both onshore and offshore installations The segment’s growth is also reinforced by increasing investment in advanced oilfield technologies and the need for reliable, low-maintenance wellhead solutions.

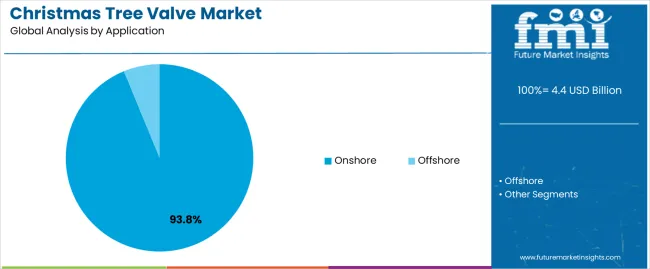
The onshore application segment is expected to account for 93.80% of the Christmas Tree Valve market revenue share in 2025, establishing it as the dominant application. The segment’s growth is largely driven by extensive onshore drilling activities, which require reliable and robust wellhead equipment to ensure operational safety and efficiency.
Onshore installations benefit from easier accessibility, enabling regular maintenance and monitoring, which increases the preference for advanced valve technologies. The rising development of shale gas and conventional oil projects has further contributed to the high adoption of Christmas tree valves in onshore settings.
Additionally, stringent regulatory standards and a focus on reducing environmental risks have encouraged operators to deploy high-performance valves capable of precise flow control and automated operation The combination of accessibility, regulatory compliance, and operational efficiency continues to drive the dominance of the onshore application segment in the market.
The annual growth rates of the global Christmas tree valve market from 2025 to 2035 are illustrated in the table below. Starting with the base year 2025 and going up to the present year 2025, the report examined how the growth trajectory changes from the first half of the year, i.e. January through June (H1) to the second half consisting of July through December (H2). This gives stakeholders a comprehensive picture of the growth performance over time and insights into potential future developments.
The table shows the growth rate for each half-year between 2025 and 2025. The market was projected to rise at a CAGR of 5.2% in the first half (H1) of 2025. However, in the second half (H2), there is a noticeable increase of 5.4% in the growth rate.
| Particular | Value CAGR |
|---|---|
| H1 | 5.2% (2025 to 2035) |
| H2 | 5.4% (2025 to 2035) |
| H1 | 5.3% (2025 to 2035) |
| H2 | 5.5% (2025 to 2035) |
Moving into the subsequent period, from H1 2025 to H2 2025, the CAGR is projected to be 5.3% in the first half and relatively increase to 5.5% in the second half. There was an increase of 10 BPS in the first half (H1) and another 10 BPS in the second half (H2).
Emergence of 3D Printing to Transform the Industry
3D printing is transforming Christmas tree valve manufacturing by enhancing customization and reducing production lead times. This technology allows for rapid prototyping and the creation of complex valve components with precision.
Recent developments include companies like Schlumberger and Baker Hughes leveraging 3D printing to produce intricate valve parts with high performance and reduced material waste. For example, Schlumberger's use of additive manufacturing has streamlined the production of customized valve components, offering tailored solutions for unique conditions. This innovation not only accelerates but also supports the shift toward more efficient and sustainable manufacturing practices.
Surging Global Energy Demand to Create New Growth Avenues
The increasing global energy demand is significantly driving sales of Christmas tree valves. As energy companies broaden their operations to meet rising needs, there is a surging demand for unique, reliable equipment to manage complex extraction processes. Recent developments highlight this shift.
TechnipFMC introduced robust valves designed to endure high pressures and harsh conditions, significant for large-scale energy projects. Meanwhile, Stream-Flo Industries integrated smart technology into its valve systems, incorporating sensors that provide real-time data and allow for precise adjustments.
The innovation helps manage the operational challenges posed by high energy demands. These not only help improve efficiency but also ensure that wellhead equipment can meet the rigorous requirements of modern energy projects, driving sales.
Safety and Sustainability Imperatives Propel Development of Eco-friendly Valves
The drive for improved safety and sustainability is rapidly pushing the adoption of unique Christmas tree valves. With strict regulatory standards and increased environmental awareness, energy companies are seeking innovative solutions to meet these demands.
Cameron, a Schlumberger company, introduced the Cameron E-Sub, featuring enhanced sealing technologies that reduce leak risks and emissions, addressing both safety and environmental concerns. ValvTechnologies also developed the V-Notch Valve, designed for superior flow control and minimal fugitive emissions, using sustainable materials to support green practices.
These developments propel the market toward more dependable and environmentally friendly valve solutions, reflecting the industry's dedication to improving operational safety and sustainable management.
Demand for Subsea Valves Rises with Increasing Offshore Activities
The expansion of subsea applications offers significant opportunities for Christmas tree valve manufacturers, pushed by the rising trend of deep-water drilling. As exploration moves into deeper waters, there is a rising demand for cutting-edge subsea valves capable of withstanding extreme pressures and harsh environmental conditions.
Recent developments include the launch of TechnipFMC’s new range of subsea valves, engineered to operate reliably at depths of over 3,000 meters and in temperatures as low as -20°C.
Worley has also been enhancing its subsea valve technology to improve durability and performance under severe conditions. It is mainly addressing the needs of deep water projects in regions like the Gulf of Mexico and offshore Brazil.
The innovations reflect a broad shift toward investing in more robust and high-performance equipment. It will likely create a growing demand for subsea Christmas tree valves as companies increasingly explore and develop offshore resources.
Postponement of Key Upstream Projects due to Price Volatility May Limit Demand
Economic vulnerability and investment uncertainty pose significant challenges to the growth of Christmas tree valves, mainly due to fluctuations in oil and gas prices. Price volatility creates a turbulent environment for investment and project planning, as energy companies grapple with unpredictable costs and financial risks.
For instance, the sharp decline in oil prices during the COVID-19 pandemic LED to significant upstream projects being postponed or canceled, further impacting demand for new valves. Recent instances include ExxonMobil’s decision to delay several key exploration projects due to low oil prices, which directly affected the demand for new wellhead equipment.
Aker Solutions noted that fluctuating oil prices complicate the firm’s ability to forecast and manage production, adding further uncertainty to growth. As energy companies navigate these financial instabilities and shifting priorities, growth remains constrained by these economic dynamics.
The Christmas tree valve industry recorded a CAGR of 2.2% during the historical period between 2020 and 2025. It reached a value of USD 4,020.3 million in 2025 from USD 3,679.4 million in 2020.
The industry experienced significant demand from 2020 to 2025, primarily driven by ongoing activities in the oil and gas industry, particularly in regions like Europe, the Middle East, and Asia Pacific.
The global pandemic in 2024 LED to widespread shutdowns, causing supply chain disruptions and workforce shortages, which slowed several economic activities. However, as restrictions eased, these activities gradually resumed, leading to a rebound in oil and gas exploration and production, subsequently boosting demand for Christmas tree valves.
The forecast indicates a growing demand for these valves across various weight categories and industries, such as oil and gas, offshore drilling, and energy infrastructure. Factors like the availability and price fluctuations of raw materials required for manufacturing these valves significantly impact demand.
The global push for sustainable solutions and strict emission regulations has augmented interest in environmentally friendly alternatives. This shift has prompted manufacturers to explore and develop more energy-efficient and low-emission valve technologies.
Leading companies, such as Schlumberger, Baker Hughes, and others, have recognized this trend and are investing in the development of advanced Christmas tree valves. These are likely to help meet stringent environmental standards. By focusing on innovation and sustainability, these companies aim to position themselves strategically in a competitive industry.

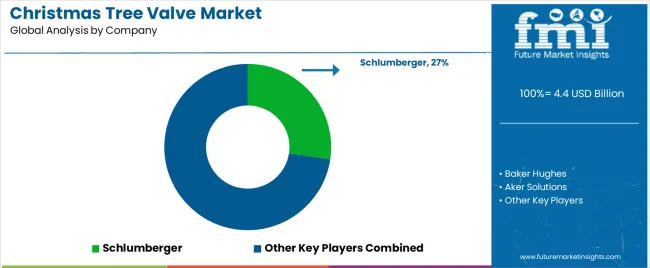
Tier 1 companies comprise players with a revenue of above USD 100 million. These companies are currently capturing a significant share of 40 to 45% of the global market. These players are characterized by high production capacity and a wide product portfolio.
The leaders are distinguished by their extensive expertise in manufacturing and a broad geographical reach, underpinned by a robust consumer base. Prominent companies within Tier 1 include Schlumberger, Baker Hughes, Aker Solutions, and TechnipFMC.
Tier 2 companies include mid-sized players with revenue of below USD 100 million. They have a considerable presence in specific regions and highly influence the local industry. These players have good technology and ensure regulatory compliance but may not have state-of-the-art technology and wide global reach. Prominent companies in Tier 2 include Shengji Group, Kingsa, and Weatherford International.
The section covers the demand analysis for different countries in various parts of the globe, including North America, Latin America, East Asia, South Asia, Western Europe, Eastern Europe, and the Middle East and Africa. In North America, the United States currently leads with a 70.6% value share due to significant investments in infrastructure and shale oil exploration. In East Asia, China holds a 52.9% value share owing to extensive offshore drilling projects supported by substantial government investments.
| Country | CAGR, 2025 to 2035 |
|---|---|
| India | 6.1% |
| Japan | 5% |
| Germany | 4.7% |
| China | 4.2% |
| United States | 3.1% |
Sales of Christmas tree valves in the United States are projected to reach USD 1,240.2 million and are estimated to rise at a 3.1% CAGR by 2035. The rapid expansion of shale oil and gas operations, particularly in Texas and North Dakota, has significantly increased the demand for unique wellhead equipment.
Recent developments underscore this trend, such as EOG Resources' substantial investment in new drilling technologies, including high-performance Christmas tree valves designed to handle extreme pressures and enhance operational efficiency. Government support for energy infrastructure and technological innovation further bolsters growth.
Companies like Schlumberger and Baker Hughes are at the forefront, offering cutting-edge valve solutions for the demanding conditions of the country’s oil fields. These combined factors position the United States as a leading consumer, further bolstering growth.
Germany’s Christmas tree valve market is projected to reach USD 211.2 million by 2035. Over the forecast period, demand in the country is predicted to rise at a 4.7% CAGR.
In Germany, sales are expanding due to significant technological innovations and ongoing industrial upgrades. The country’s commitment to modernizing its energy infrastructure has increased the demand for unique wellhead equipment.
Recent developments illustrate this trend, such as Wintershall Dea's substantial investment in sophisticated drilling technologies and high-performance valves to boost efficiency and safety. Germany's focus on integrating digital technologies into the energy sector, exemplified by Siemens' deployment of smart sensors and automation solutions, further enhances the need for modern valve systems. These technological improvements and infrastructure investments are pivotal in supporting the country’s ambitious energy goals and contribute to market expansion.
China is projected to reach USD 937.6 million and surge at a CAGR of 4.2% through 2035. Demand is anticipated to rise in the country due to surging domestic oil production and significant technological upgrades.
The country’s emphasis on enhancing energy self-sufficiency has LED to increased investments in unique wellhead technologies. Recent developments such as Sinopec's increased investment in drilling infrastructure and high-performance valves to support expanding onshore and offshore operations are projected to drive demand.
The introduction of new smart valve technologies by China National Petroleum Corporation (CNPC), which features cutting-edge monitoring and control systems, has further improved operational efficiency and reliability. These innovations and rising production efforts are augmenting the demand for high-quality Christmas tree valves in China.
The section explains the growth trajectories of the leading segments. In terms of product type, the automatic segment will likely dominate and generate a share of around 62.7% in 2025.
Based on application, the onshore segment is projected to hold a leading share of 93.8% in 2025. The analysis would enable potential clients to make effective business decisions for investment purposes.
| Segment | Automatic (Product Type) |
|---|---|
| Value Share (2025) | 62.7% |
The automatic segment is predicted to experience a decent CAGR of 5.7% from 2025 to 2035. It is poised to lead backed by growing demand for operational efficiency and safety in complex drilling environments.
As the oil and gas industry embraces digitization, valves offering precision control and seamless integration with automated systems are becoming increasingly popular. Baker Hughes' SureVIEW Subsea Monitoring System features automatic valves with unique analytics and real-time monitoring, thereby enhancing decision-making.
Aker Solutions’ Subsea Control Module includes automatic valves with predictive maintenance capabilities, reducing risks and extending equipment life. Halliburton’s SmartWell technology enables remote, real-time adjustments in offshore operations. It helps in optimizing production without manual intervention. These innovations prove the key role of automatic valves in modern energy production.
| Segment | Onshore (Application) |
|---|---|
| Value Share (2025) | 93.8% |
By application, the onshore segment is estimated to generate a share of around 93.8% in 2025. Onshore adoption of Christmas tree valves is accelerating due to strict safety regulations and environmental standards. In response to these demands, oil and gas companies are turning to innovative valve systems that ensure compliance and reduce environmental risks.
BP, for instance, recently introduced new valves for its Texas onshore operations, specifically designed to minimize emissions and enhance well integrity. TotalEnergies has also upgraded its onshore facilities in Argentina.
It has implemented valves with automated safety features to prevent leaks and ensure reliable performance under extreme conditions. These developments reflect the industry's shift toward safe and environmentally responsible practices, driving adoption in onshore drilling operations.
Key companies manufacturing Christmas tree valves moderately consolidate the market with about 45 to 50% share. They are prioritizing technological innovations, embracing sustainable practices, and broadening their footprints across the globe.
Customer satisfaction remains paramount, with a keen focus on tailoring products to meet the customer’s needs. These key players actively foster collaborations to stay at the forefront of innovation, ensuring their in-house Christmas tree valves align with the evolving demands and maintain high standards of quality and adaptability.
A few other key companies are focusing on partnerships and collaborations to stay at the forefront. They are acquiring small-scale players to co-develop innovative products and distribute them in specific areas. At the same time, they are investing huge sums in research and development activities to come up with unique products.
Industry Updates
Automatic and manual are the two types of products.
Offshore and onshore are the two key applications.
Regions considered in the study include North America, Latin America, Western Europe, Eastern Europe, East Asia, South Asia, and the Middle East and Africa.
The global christmas tree valve market is estimated to be valued at USD 4.4 billion in 2025.
The market size for the christmas tree valve market is projected to reach USD 7.3 billion by 2035.
The christmas tree valve market is expected to grow at a 5.1% CAGR between 2025 and 2035.
The key product types in christmas tree valve market are automatic and manual.
In terms of application, onshore segment to command 93.8% share in the christmas tree valve market in 2025.


Full Research Suite comprises of:
Market outlook & trends analysis
Interviews & case studies
Strategic recommendations
Vendor profiles & capabilities analysis
5-year forecasts
8 regions and 60+ country-level data splits
Market segment data splits
12 months of continuous data updates
DELIVERED AS:
PDF EXCEL ONLINE
Tree Milling Machine Market Size and Share Forecast Outlook 2025 to 2035
Tree Nuts Market
Street Vendors Market Size and Share Forecast Outlook 2025 to 2035
Street and Roadway Lighting Market Trend Analysis Based on Wattage, End-Use, and Region 2025 to 2035
Tea Tree Oil Treatments Market Size and Share Forecast Outlook 2025 to 2035
On Street Vehicle Parking Meter Market Growth - Trends & Forecast 2024 to 2034
Cat Trees & Towers Market
Solar Street Lighting Market Size and Share Forecast Outlook 2025 to 2035
Cat Scratchers and Trees Market - Trends & Forecast 2025 to 2035
Valve Grinder Market Size and Share Forecast Outlook 2025 to 2035
Valve Seat Inserts Market Size and Share Forecast Outlook 2025 to 2035
Valve Driver Market Size and Share Forecast Outlook 2025 to 2035
Valve Remote Control Systems Market Analysis by Type, Application and Region - Forecast for 2025 to 2035
Valve Positioner Market Growth – Trends & Forecast (2024-2034)
Valve Cover Gasket Market
Valve Sack Market
ESD Valve Market Size and Share Forecast Outlook 2025 to 2035
EGR Valve Market
HVAC Valve Market Size and Share Forecast Outlook 2025 to 2035
Flat Valve Caps And Closures Market Size and Share Forecast Outlook 2025 to 2035

Thank you!
You will receive an email from our Business Development Manager. Please be sure to check your SPAM/JUNK folder too.
Chat With
MaRIA