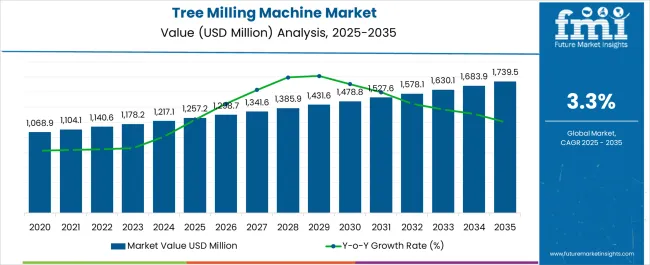
The tree milling machine market is estimated to be valued at USD 1257.2 million in 2025 and is projected to reach USD 1739.5 million by 2035, registering a compound annual growth rate (CAGR) of 3.3% over the forecast period.
Equipment operators evaluate tree milling specifications based on cutting capacity, mobility characteristics, and power delivery systems when selecting machinery for diverse applications including stump removal, tree trimming, and hazardous tree elimination operations. Machine procurement involves analyzing hydraulic flow rates, track configuration options, and attachment compatibility while considering site access limitations, transportation requirements, and operator certification levels necessary for safe equipment operation. Investment decisions balance initial purchase costs against operational efficiency gains including reduced labor requirements, improved cutting precision, and enhanced safety features that minimize worker exposure to hazardous working conditions.
Manufacturing processes concentrate on heavy-duty frame construction, hydraulic system integration, and cutting head development that withstand continuous operation in demanding outdoor environments. Production scheduling accommodates custom configuration requirements that vary between municipal fleet specifications and contractor-specific applications while managing component sourcing from specialized suppliers providing hydraulic pumps, cutting teeth, and track drive systems. Quality assurance protocols address structural integrity testing, hydraulic pressure validation, and safety system verification that ensure equipment reliability throughout extended operational lifecycles under varying terrain conditions and debris characteristics.
Cross-functional coordination involves design engineers, hydraulic specialists, and field service technicians collaborating to optimize machine performance that balances cutting efficiency with operator comfort and maintenance accessibility. Installation processes require dealer preparation, operator training, and warranty activation while establishing service support networks that provide parts availability and technical assistance throughout equipment ownership periods. Maintenance protocols establish inspection schedules, fluid replacement intervals, and component replacement procedures that maximize machine availability while minimizing unplanned downtime during peak operational seasons.
Technology advancement prioritizes remote control capabilities, automated cutting systems, and emission reduction features that improve operational efficiency while addressing environmental concerns and operator safety requirements. Manufacturers develop hybrid power systems, advanced hydraulic controls, and telematic monitoring capabilities that optimize fuel consumption while providing real-time performance data for fleet management and preventive maintenance scheduling. Cutting head designs incorporate wear-resistant materials, adjustable tooth configurations, and debris management systems that enhance productivity while reducing operating costs.
Service provider relationships involve coordination between equipment manufacturers, dealer networks, and parts distributors to establish comprehensive support systems that address emergency repair needs, scheduled maintenance requirements, and operator training programs. Contract negotiations address warranty coverage, service response times, and parts availability guarantees that protect equipment investments while ensuring operational continuity during critical work periods. Partnership development includes collaboration with hydraulic component suppliers, cutting tool manufacturers, and telematics providers to deliver integrated solutions that enhance machine performance and reliability.
| Metric | Value |
|---|---|
| Tree Milling Machine Market Estimated Value in (2025 E) | USD 1257.2 million |
| Tree Milling Machine Market Forecast Value in (2035 F) | USD 1739.5 million |
| Forecast CAGR (2025 to 2035) | 3.3% |
The tree milling machine market is experiencing consistent momentum supported by the expanding bakery industry, rising flour consumption, and the increasing demand for efficient production machinery. Growing emphasis on productivity, automation, and high precision operations has encouraged manufacturers to integrate advanced control systems and digital monitoring capabilities in milling machines.
Sustainability trends and energy efficiency requirements are also influencing product development. The surge in small and medium scale enterprises, particularly in emerging economies, is contributing to increased adoption of cost effective yet high performing equipment.
With bakeries, packaged food manufacturers, and direct-to-consumer channels seeking reliable production solutions, the market outlook remains positive. Technological innovations coupled with demand from online sales platforms are expected to provide further opportunities for market growth.
The market is segmented by Production, Application, and Sales Channel and region. By Production, the market is divided into Flour, Animal Feed, and Food Products. In terms of Application, the market is classified into Bakeries, Restaurants, and Household use. Based on Sales Channel, the market is segmented into Online and Offline. Regionally, the market is classified into North America, Latin America, Western Europe, Eastern Europe, Balkan & Baltic Countries, Russia & Belarus, Central Asia, East Asia, South Asia & Pacific, and the Middle East & Africa.
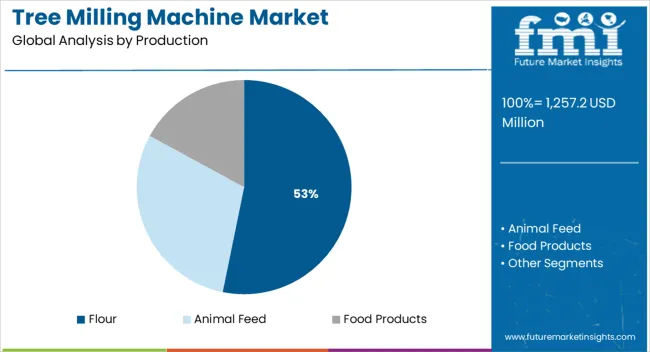
The flour production segment is projected to account for 53.20% of total market revenue by 2025, making it the leading category under production. This dominance is attributed to the central role of flour in bakery and food processing applications, as well as the continuous requirement for precise and large scale milling.
The demand for consistent texture, quality, and volume has reinforced reliance on tree milling machines in flour production.
Increasing consumption of baked products and packaged foods has further strengthened the growth of this segment, making flour production the cornerstone of the market.
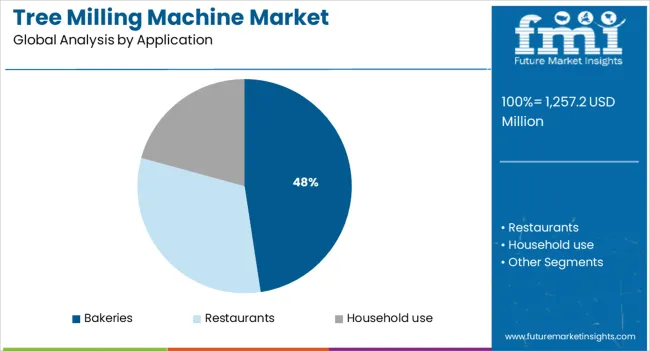
The bakeries application segment is expected to capture 47.60% of overall market revenue by 2025, positioning it as the leading application. Rising consumer preference for bakery products, coupled with innovations in artisanal and packaged offerings, is driving demand for reliable milling machines.
Bakeries require consistent flour quality to ensure uniformity in texture and taste, which tree milling machines deliver efficiently.
Growing urbanization and the popularity of ready-to-eat food have accelerated bakery expansion, ensuring bakeries remain a dominant application area.
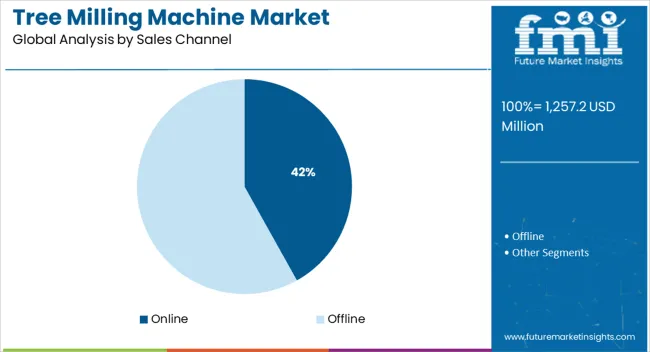
The online sales channel segment is forecasted to hold 41.90% of the total market share by 2025, making it the leading sales channel. The shift toward e-commerce platforms, driven by convenience, cost efficiency, and a wider reach, has accelerated online adoption.
Manufacturers and distributors are leveraging digital platforms to connect directly with end users, bypassing traditional intermediaries. Increased customer access to product specifications, competitive pricing, and doorstep delivery options has made online sales a preferred channel.
This growth trend continues to strengthen as more enterprises embrace digital transformation in procurement.
The value of the market for tree milling machines increased from USD 1068.9 million in 2020 to USD 1,140.6 million in 2025. The observed CAGR from 2020 to 2025 was a steady 4.8%.
The food & beverage industry is one of the predominant end users of tree milling machines. The increasing demand for processed and packaged foods is driving the need for efficient tree milling machines that can produce a variety of food products.
Tree milling machines offer several benefits over traditional milling machines, including higher output, more versatility, and lower operating costs. These factors are expected to continue to drive robust acceleration in the tree milling machine market between 2025 and 2035.
FMI’s analysts have leveraged their expertise and experience to identify factors that are anticipated to drive, restrain, threaten, and provide opportunities in the tree milling machine market.
The Drivers, Restraints, Opportunities, and Threats identified are as follows:
DRIVERS
RESTRAINTS
OPPORTUNITIES
THREATS
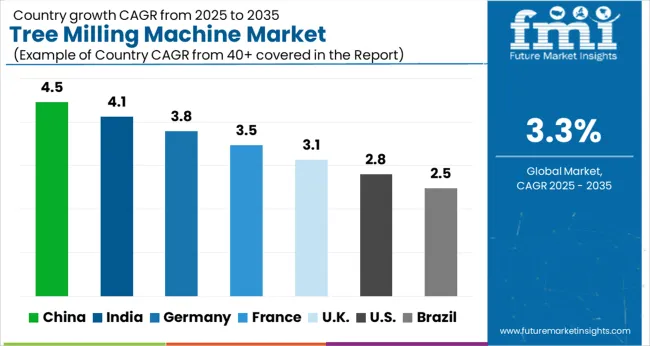
Presence of Numerous Food & Beverage Manufacturers to Ensure High Demand for Tree Milling Machines in North America
The United States is expected to be the dominant market for tree milling machines in North America, due to the presence numerous of food & beverage manufacturers in the country. The growing demand for processed food is also fueling the expansion of this market in the United States.
Canada is another key market for tree milling machines in the North America due to the increasing demand being experienced by country’s food processing industry. The growing population and changing lifestyles are the factors fueling market expansion in Canada. The United States has a share of 32.8% in the global market for tree milling machines.
Versatility of Tree Milling Machines to Contribute To Greater Demand From 2025 to 2035.
The food and beverage industry in Europe is a growing market for tree milling machines. Tree milling machines are versatile and can be used for a variety of applications, from grinding flour to producing juices and other food and beverage products.
Europe market for tree milling machines is expected to accelerate at a steady pace in the next few years. This acceleration is poised to be driven by the increasing demand for healthy and nutritious food products, as well as the need for efficient and cost-effective production methods.
German market accounts for around 26.1% of the market for tree milling machines, while the anticipated CAGR in the United Kingdom is a steady 5.9% from 2025 to 2035.
Climbing Demand for Processed Food Products to Expand Market In Asia Pacific
Asia Pacific is one of the leading markets for processed food and beverages. Rising income levels and changing lifestyle patterns are the key factors driving the growth of the processed food and beverage industry in the region. These factors are projected to have a positive impact on the demand for tree milling machines in Europe between 2025 and 2035.
India and China are the market leaders in Asia Pacific, and a healthy 6.0% CAGR is predicted for both markets. Japan is estimated to have a 5.7% share in of the global market for tree milling machines.
Higher Efficiency and Reduced Wastage To Make Tree Milling Machines More Popular than Conventional Milling Machines
Tree milling machines offer several advantages over traditional milling methods. For starters, they offer greater efficiency, which makes them perfect for mass production purposes. They also consume lesser energy, which is helpful in keeping operational costs in check.
Limited wastage is also one of the advantages that tree milling machines provide compared to conventional milling machines. As the world is anticipated to take steps to limit wastage for the environment’s sake in the years ahead, adoption of tree milling machines is poised to be encouraged by governments. Tree milling machines also offer ease-of-use and their maintenance costs tend to be lower due to greater durability.
Increasing Adoption of Tree Milling Machines in Bakeries to Generate More Market Revenue
Tree milling machines are used in bakeries to grind wheat flour. The machine consists of a cylinder with rotating blades that grind the wheat grains into flour. The flour is then sifted and packaged for sale. Tree milling machines are versatile and can be used for a variety of flour grinding applications.
Bakeries can enjoy complete control over the quality of flour products through the use of tree milling machines. For luxury bakery and confectionery brands, flour products with minimal impurities are priorities. To produce these impurity-free products, tree milling machine use is mandatory. Tree milling machine use is also set to grow among bakeries and confectioneries catering to middle and low-income groups as the machines can also efficiently produce affordable flour products.
Anticipated Increase in Penetration of Online Sales Channels to Connect More Buyers and Manufacturers
Online sales channels are already putting offline channels to shame and FMI expects the gap between the two to grow larger from 2025 to 2035. While tree milling machines have conventionally been traded offline, the changing times indicate that online sales are likely to be boosted in the near future.
Manufacturers are expected to go all out in terms of their marketing efforts for showcasing their products to audiences worldwide. Attractive offers and discount deals across online sales channels are anticipated to skyrocket as manufacturers make profitability their focus.
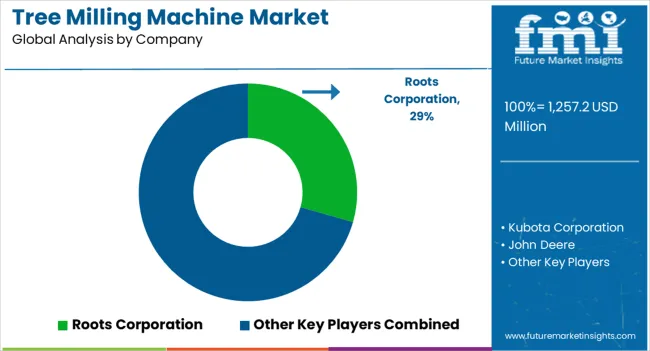
The tree milling machine market is expanding, driven by the demand for precision woodworking equipment used in forestry, furniture production, and construction. Key players in the market include Kubota Corporation, John Deere, Caterpillar Inc., Holzmann Maschinen GmbH, Mecanumeric Group, InfoTEC CNC, CNC-STEP GmbH & Co. KG, HoPa-Maschinenbau GmbH, Grünwelt Maschinen GmbH, imes-icore GmbH, and Roots Corporation. These companies provide a variety of solutions to meet the needs of both large-scale industrial and smaller-scale woodworking applications.
Kubota Corporation and John Deere offer high-performance tree milling machines used in large forestry and agricultural operations, focusing on durability and high productivity. Caterpillar Inc. also caters to the forestry industry, providing robust, heavy-duty milling machines for timber processing. Holzmann Maschinen GmbH and Mecanumeric Group specialize in versatile, compact machines suitable for small to medium-sized woodworking operations, offering precision and ease of use. CNC-STEP GmbH & Co. KG and InfoTEC CNC focus on advanced CNC technology, enabling highly detailed milling for specialized wood products.
| Attribute | Details |
|---|---|
| Estimated Market Size (2025) | USD 1257.2 million |
| Projected Market Valuation (2035) | USD 1739.5 million |
| Value-based CAGR (2025 to 2035) | 3.3% |
| Forecast Period | 2025 to 2035 |
| Historical Data Available for | 2020 to 2025 |
| Market Analysis | Value (USD million) |
| Key Regions Covered | North America; Europe; Asia Pacific; Latin America; Middle East and Africa; Rest of the World |
| Key Countries Covered | USA, Canada, Mexico, Germany, United Kingdom, France, Russia, Brazil, Argentina, Japan, Australia, China, India, Indonesia, South Korea |
| Key Segments Covered | Production, Application, Sales Channel, Region |
| Key Companies Profiled |
Kubota Corporation, John Deere, Caterpillar Inc., Holzmann Maschinen GmbH, Mecanumeric Group, InfoTEC CNC, CNC-STEP GmbH & Co. KG, HoPa-Maschinenbau GmbH, Grünwelt Maschinen GmbH, imes-icore GmbH, Roots Corporation |
| Report Coverage | Strategic Growth Initiatives, DROT Analysis, Market Forecast, Company Share Analysis, Market Dynamics and Challenges, and Competitive Landscape. |
The global tree milling machine market is estimated to be valued at USD 1,257.2 million in 2025.
The market size for the tree milling machine market is projected to reach USD 1,739.5 million by 2035.
The tree milling machine market is expected to grow at a 3.3% CAGR between 2025 and 2035.
The key product types in tree milling machine market are flour, animal feed and food products.
In terms of application, bakeries segment to command 47.6% share in the tree milling machine market in 2025.


Our Research Products

The "Full Research Suite" delivers actionable market intel, deep dives on markets or technologies, so clients act faster, cut risk, and unlock growth.

The Leaderboard benchmarks and ranks top vendors, classifying them as Established Leaders, Leading Challengers, or Disruptors & Challengers.

Locates where complements amplify value and substitutes erode it, forecasting net impact by horizon

We deliver granular, decision-grade intel: market sizing, 5-year forecasts, pricing, adoption, usage, revenue, and operational KPIs—plus competitor tracking, regulation, and value chains—across 60 countries broadly.

Spot the shifts before they hit your P&L. We track inflection points, adoption curves, pricing moves, and ecosystem plays to show where demand is heading, why it is changing, and what to do next across high-growth markets and disruptive tech

Real-time reads of user behavior. We track shifting priorities, perceptions of today’s and next-gen services, and provider experience, then pace how fast tech moves from trial to adoption, blending buyer, consumer, and channel inputs with social signals (#WhySwitch, #UX).

Partner with our analyst team to build a custom report designed around your business priorities. From analysing market trends to assessing competitors or crafting bespoke datasets, we tailor insights to your needs.
Supplier Intelligence
Discovery & Profiling
Capacity & Footprint
Performance & Risk
Compliance & Governance
Commercial Readiness
Who Supplies Whom
Scorecards & Shortlists
Playbooks & Docs
Category Intelligence
Definition & Scope
Demand & Use Cases
Cost Drivers
Market Structure
Supply Chain Map
Trade & Policy
Operating Norms
Deliverables
Buyer Intelligence
Account Basics
Spend & Scope
Procurement Model
Vendor Requirements
Terms & Policies
Entry Strategy
Pain Points & Triggers
Outputs
Pricing Analysis
Benchmarks
Trends
Should-Cost
Indexation
Landed Cost
Commercial Terms
Deliverables
Brand Analysis
Positioning & Value Prop
Share & Presence
Customer Evidence
Go-to-Market
Digital & Reputation
Compliance & Trust
KPIs & Gaps
Outputs
Full Research Suite comprises of:
Market outlook & trends analysis
Interviews & case studies
Strategic recommendations
Vendor profiles & capabilities analysis
5-year forecasts
8 regions and 60+ country-level data splits
Market segment data splits
12 months of continuous data updates
DELIVERED AS:
PDF EXCEL ONLINE
Milling Machine Market Growth – Trends & Forecast 2025 to 2035
End Milling Machine Market Report - Demand, Growth & Industry Outlook 2025 to 2035
Road Milling Machine Market Analysis and Opportunity Assessment in India Size and Share Forecast Outlook 2025 to 2035
Rice Milling Machine Market Size and Share Forecast Outlook 2025 to 2035
Corn Milling Machine Market Size and Share Forecast Outlook 2025 to 2035
Maize Milling Machine Market Size and Share Forecast Outlook 2025 to 2035
Wheat Milling Machine Market Size and Share Forecast Outlook 2025 to 2035
Thread Milling Machine Market Size and Share Forecast Outlook 2025 to 2035
Portable Milling Machine Market Size and Share Forecast Outlook 2025 to 2035
Universal Milling Machine Market Size and Share Forecast Outlook 2025 to 2035
Horizontal Milling Machine Market Size and Share Forecast Outlook 2025 to 2035
Desktop CNC Milling Machines Market Size and Share Forecast Outlook 2025 to 2035
Tabletop CNC Milling Machines Market Analysis - Size, Share, and Forecast Outlook 2025 to 2035
Industrial Food Milling Machine Market Size and Share Forecast Outlook 2025 to 2035
Machine Glazed Paper Market Size and Share Forecast Outlook 2025 to 2035
Machine Glazed Kraft Paper Market Forecast and Outlook 2025 to 2035
Machine Condition Monitoring Market Size and Share Forecast Outlook 2025 to 2035
Machine Glazed Paper Industry Analysis in Asia Pacific Forecast Outlook 2025 to 2035
Machine Vision Camera Market Size and Share Forecast Outlook 2025 to 2035
Machine Tool Oils Market Size and Share Forecast Outlook 2025 to 2035

Thank you!
You will receive an email from our Business Development Manager. Please be sure to check your SPAM/JUNK folder too.
Chat With
MaRIA