Wheat Milling Machine Market
FMI Unveils how the Advancement of Structural Design and Processing Technologies by Manufacturers has given the Large-scale Operation of Wheat Milling Machines a Strong Technical Assurance.
Wheat Milling Machine Market by Type, Application, Sales Channel & Region – Forecast 2023–2033
Wheat Milling Machine Market Outlook
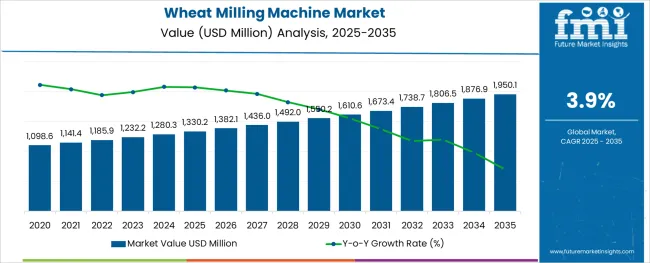
According to Future Market Insights research, during the forecast period, the wheat milling machine market is anticipated to grow at a CAGR of 3.9%. The market value is expected to increase from USD 1,232.2 million in 2023 to USD 1,806.5 million by 2033. At the end of 2022, the market had a value of USD 1,185.9 million, when the CAGR was 3.5%.
The wheat milling machine is an important part of the modern-day food industry. Wheat flour is used in many different types of foods such as tortillas, bread, pasta, cakes, and pastries. Without the wheat milling machine, these foods would not be able to be produced on a large scale. . The advantages of a wheat milling machine go beyond its portability. The market is driven by the following factors:
- With improved technology and rising demand, non-gelatinized flour is becoming more popular.
- In the food sector, there is a rise in demand, and consumption per person has gone up as well.
- The demand for flour is rising due to the proliferation of cafés and fast food outlets worldwide.
- Grain milling products are now in higher demand as a result of the growing demand for packaged/ready-to-eat food that is linked to changing lifestyles and rising per capita income.
- Wheat grinders remove all the impurities from the wheat flour which in turn reduces the labour intensity of operators.
- The manufacture of a variety of culinary products and industrial goods now uses modified starches and flours due to the rising need for binders.
- The demand for these machines has surged recently as a result of growing knowledge of the possible health benefits that wheat flour may provide.
- Manufacturers have recognized the rise in demand for these machines and have stepped up their global trade in the wheat flour industry.
- To combat nutritional deficiency, certain governments and groups are encouraging the use of flours like wheat that are nutrient-enriched.
Market Size Value in 2023 |
USD 1,232.2 Mn |
Market Forecast Value in 2033 |
USD 1,806.5 Mn |
Global Growth Rate (2023 to 2033) |
3.9% CAGR |
Forecast Period |
2023-2033 |
U.S. Market share of Wheat Milling Machine |
35.6% |
Let us know your requirement to get
100% FREE customization
Energy-saving Technologies Create Opportunities for Wheat Milling Machine Market
The rising demand for energy-efficient equipment from end users is one of the major factors propelling the global market. Manufacturers are introducing milling machines with energy-efficient features in response to the increased demand for machinery that performs more efficiently in terms of energy usage, capacity, and cost. Higher standards for the effectiveness of powder granulation machines are put up as people's awareness of energy saving increases. This kind of equipment must not only fulfil the functional specifications but also have energy efficiency, durability, usability, maintenance, and serviceability.
The benefits of large-scale manufacturing equipment have become apparent as science, technology, and other fields of research evolve. A strong technical assurance for the large-scale functioning of wheat flour grinding machines has been made possible by the advancement of mechanical structure design and processing technologies. Manufacturers are refining the construction of wheat milling equipment to make it more practical, ergonomic, and compact. This reduces production costs, frees up more space on the floor, and boosts worker productivity. The industry is utilizing modification methods more often, and flours are enriched with additives, micronutrients, and a range of components, which is increasing the demand for wheat flour globally. Download Report Brochure
Wheat Milling Machine Market Historical Outlook vs. Future Projections
The historical prognosis for the wheat milling machine market reveals that the market's value expanded from USD 1,033.5 million in 2018 to USD 1,185.9 million in 2022. During the historical timeframe (2018–2022), the market observed a CAGR of 3.5%.
The wheat milling machine has been around for centuries and has been used in many different parts of the world. The first known use of the wheat milling machine was in Ancient Egypt. The Egyptians used the wheat flour machine for commercial use to process wheat into flour for bread making. The science of wheat milling entails examining, combining, grinding, sifting, and blending once more different types of wheat. The wheat is analyzed by the miller before being blended to fulfil the needs of the final product.
The wheat milling machine market is expected to grow significantly in the coming years. As more people become aware of the advantages that wheat flour has for their health, a roadmap for wheat milling equipment becomes increasingly crucial.
- Short Term (2023 to 2026): The demand for wheat flour is rising, and more bakeries and pastry businesses are popping up all over the place. Some ancillary reasons that are propelling the flour industry are the rise in the consumption of bakery and ready-to-eat food goods, the change in the taste buds of millennials, and the greater propensity to explore new foods.
- Medium Term (2026-2029): Due to consumer desire for diets high in fibre, there is now a significant increase in the demand for whole wheat flour. The use of whole flour has significantly increased across a variety of food industry categories as a consequence of consumer awareness of the health advantages of fibre-rich meals.
- Long Term (2029-2033): The wheat milling machine industry is likely to become more competitive as a result of the rising demand for wheat products. The availability of effective technologies for the manufacturing of bread, noodles, other forms of pasta, and other flour-based items has assisted the growth of the market for wheat milling equipment, which in turn leads to the larger adoption of wheat milling machines by flour mills.
Wheat Milling Machine market value is expected to climb from USD 1,232.2 million in 2023 to USD 1,806.5 million in 2033 according to future projections. A CAGR of 3.9% is predicted to occur between 2023 and 2033.
Find your sweet spots for generating winning opportunities in this market.
Talk to AnalystComparative Analysis of Adjacent Markets
Wheat Milling Machine Market:
Differentiating Aspects |
Wheat Milling Machine Market |
CAGR |
3.9% |
Market Valuation in 2023 |
US$ 1,232.2 Million |
Projected Market Value in 2033 |
US$ 1,806.5 Million |
Driver |
Since more bakeries and pastry shops are opening up all around, there is a growing need for wheat flour. |
Trend |
Increase in consumer spending on high-end and reputable plant-based products. |
Opportunities |
In response to the rising need for equipment that operates more effectively in terms of energy use, capacity, and cost, manufacturers are producing milling machines with these energy-efficient features. |
Cultured Wheat Market:
Differentiating Aspects |
Cultured Wheat Market |
CAGR |
6.1% |
Market Valuation in 2023 |
US$ 367.10 Million |
Projected Market Value in 2033 |
US$ 663.66 Million |
Driver |
Cultured wheat starch is becoming even more common in many places as a result of the growing interest in organic and sustainable lifestyles. |
Trend |
As customers become increasingly informed about the food components they are ingesting and their corresponding nutritional benefits, public opinion has changed in favour of various types of organic and synthetic chemical-free products. |
Opportunities |
Since cultured wheat is primarily used as a preservative in the food industry to enhance the shelf life of packaged and ready-to-eat food items, cultured wheat sales are projected to grow dramatically. |
Wheat Protein Market:
Differentiating Aspects |
Wheat Protein Market |
CAGR |
4.8% |
Market Valuation in 2023 |
US$ 5.34 Billion |
Projected Market Value in 2033 |
US$ 3.46 Billion |
Driver |
Demand is expected to be driven by growing consumer health concerns given the excellent nutritional quality wheat protein adds to meals. |
Trend |
Given the fact that wheat protein is low in calories and promotes weight loss, people are highly including wheat protein in their diet. |
Opportunities |
The market is expected to thrive since sportsmen and body builders consume wheat protein to increase strength and build muscle. |
Category Wise Insights
How Bakeries & Confectioneries are propelling the growth of Wheat Milling Machine market?
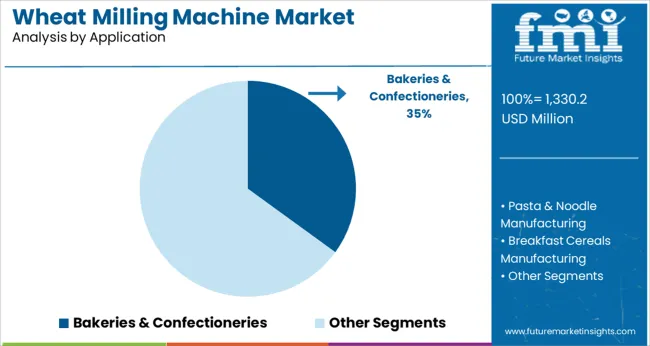
Since wheat flour is used in bakery goods like bread, cookies and pastries, the bakeries and confectioneries segment is expected to hold the largest market share. The market is expanding as a result of the increased demand for wheat flour used to make bakery & confectionery goods. For cakes and slices of bread, the majority of demand for bakery goods is driven by wheat and refined wheat flour. Almost everywhere in the globe, there is a growing demand for bread, which has a favourable effect on the price of wheat flour which directly generates revenue for wheat milling machines as well. Numerous bakeries and confectioneries are turning to machines because of their high performance and simplicity of use. Hence, increased demand for wheat flour from restaurants, cafés, and other businesses is anticipated to drive the expansion of the flour market and the wheat milling machine industry at the same time.
What is the use of Wheat Milling Machine in Animal feed manufacturing?
A wheat milling machine is used in animal feed manufacturing to process raw wheat kernels into a powder that can be fed to animals. Wheat processing machine separates wheat bran from wheat flour. The end product is a nutritious and healthy animal feed that is highly digestible and palatable for animals. Because it has a higher proportion of protein than other existing cereals and has a higher concentration of amino acids, wheat bran is a product designed for animal feed. Technically known as pericarp, this wheat bran is made up primarily of the outside of the processed wheat grain. Additionally, since it improves digestibility and raises the nutritional levels in the grains, roasted wheat is also utilized in animal feed, which increases milk production.
A unified Market Research Subscription Platform, built for today's disparate research needs.
Country Wise Analysis
How is the Wheat Milling Machine Market Developing in United States?
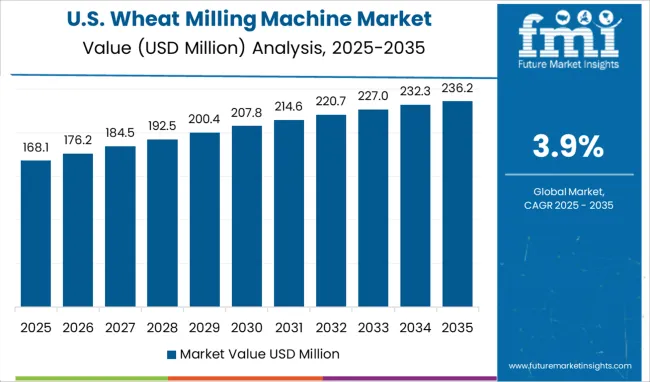
The wheat milling machine market in North America has been developing steadily in recent years. The United States dominate the wheat milling machine market in North America. Wheat from the United States offers diversity. For many citizens in the United States, whole-wheat flour is regarded as one of the most plentiful and essential resources. North America has a developed market for processed goods and is anticipated to expand steadily. The distinctive qualities needed to manufacture a range of baked items and noodles are brought to market by the flour made from each unique class of American wheat. The demand for wheat grinding machines has been driven by the growing popularity of wheat-based foods in the region.
There are several factors that have contributed to the steady development of the United States wheat milling machine market. One of the most important factors is the increasing health consciousness of consumers in the region. Wheat-based foods are generally considered to be healthier than their processed counterparts, and this has led to an increase in demand for them. Furthermore, due to the rising demand for organic wheat flour in goods like bread, pastries, confections, processed foods, and many other organic food items, North America has the largest per-capita use of organic wheat flour.
The Wheat Milling Machine Market receives 35.6% of its total income from the United States.
How is European Wheat Milling Machine Market Evolving?
Several factors are helping to drive the growth of the European wheat milling machine market. With the rise in the production of grains, notably wheat, the European region may see profitable opportunities in the market throughout the projection period. This demand is also being driven by the food industry, which is using more wheat flour in processed foods.
The rising demand for bakery products like bread, pasta, pizza, etc. is expected to boost profits in Europe for wheat milling machines. Government programs to boost agricultural output by offering subsidies help with this by incentivizing farmers to spend money on wheat cultivation. To meet the rising demand of the health-conscious population, major manufacturers are now concentrating on producing a wider variety of wheat with fewer negative health effects.
Germany makes for 22.4% of the Wheat Milling Machine market, while the CAGR in the UK is 6.7% over the projection period.
How is the market for Wheat Milling Machine Emerging in Asia Pacific?
The market for wheat milling machines is expanding in the Asia Pacific at a significant pace. The reason behind this expansion is the increasing demand for wheat products in the region. Moreover, the Asia Pacific region is the world’s largest wheat-producing region. This region also has the highest consumption rate of wheat. Therefore, the demand for wheat milling machines is also high in this region.
The expansion of the market for wheat milling machine is also due to the growing popularity of healthy and organic food products. Consumers in the Asia Pacific region are becoming more health conscious and are willing to pay more for healthy and organic food products. This trend is expected to continue in the future, which will drive up the demand for wheat grinding machines even further.
Japan represents a sizeable portion of the global market share, while China is the market leader in the Asia Pacific region.
Country | China |
CAGR | 6.3% |
Growth Factor |
China is the largest producer of wheat. A rising population base, increased fast food and bakery consumption, rising urbanization, and rising disposable income are all driving up demand for flour and related products. The fact that China has a well-established food and beverage industry and that businesses are investing more money in the creation of cutting-edge wheat flour products is partly to blame for the market's explosive growth. |
Country | Japan |
CAGR | 3.5% |
Growth Factor |
The ongoing efforts made by governments to increase the capacity for producing wheat as well as to increase the value of their exports by working with international firms. With rising disposable income, consumer lifestyles have significantly improved. The upscale goods that nowadays consumers like include cakes, biscuits, and premixes made of wheat flour which in turn increase the adoption of wheat milling machines. |
Start-up Ecosystem
Growing Companies to Improve the Wheat Milling Machine Market Strength
New players in the market for wheat milling machines are providing cutting-edge goods and gaining a competitive edge by leveraging technological advancements. To keep up with shifting consumer preferences and end-user industry demands, these businesses consistently invest in R&D. Initiatives to elevate its profile in the forum are assisting the wheat milling machine business.
Leading Startups to Watch out for
Start-up Company | Ghrats Fresh Atta |
Country | India |
Description | Three friends from Chandigarh founded Ghrats Fresh Atta with the goals of reviving an extinct custom, producing food responsibly, and creating jobs for others. |
Start-up Company | Ardent Mills |
Country | Canada |
Description | The business specialises in wheat flour, quinoa, pulses, and organic and gluten-free goods that promote new trends in plant-based nutrition. With a focus on the expanding demands of today's consumers, its comprehensive portfolio enables it to satisfy the complicated needs of customers today. |
Competitive Landscape
The competitive landscape of the wheat milling machine market is constantly changing. Companies are always looking for ways to improve their products and services to stay ahead of the competition. They invest heavily in research and development to bring new products to the market. The competition in the market is good for consumers as it leads to lower prices and better-quality products.
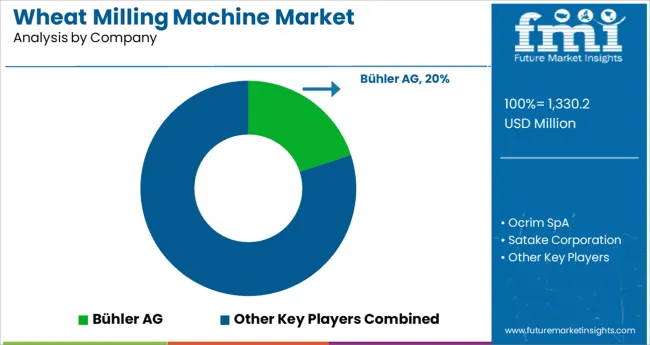
The market is highly fragmented with a large number of small and medium-sized manufacturers. The leading players in the market include Bühler AG, Ocrim SpA, Satake Corporation, Alapala Machine Industry & Trade Inc., and Henry Simon Group. These companies hold a significant share of the global market due to their strong brand presence and extensive product portfolios.
Pointing towards the Perfect Slice of Bread with the help of a Wheat Milling Machine, ft. Buhler AG, Ocrim SpA, and Henry Simon Group
Three business pillars support Bühler. Grains & Food Solutions guarantees wholesome, safe food and feed. Solutions from Consumer Foods provide delectable cuisine. Advanced Materials aid in the creation of structures and vehicles that are energy efficient. Its milling solutions include high-quality process technology for producing high-grade flour products from raw materials including wheat, oats, corn, and pulses.
Due to the enthusiasm of its creator, Guido Grassi, Ocrim has been active in the milling sector from its inception. The strength of everyone who believes in Ocrim and has always believed in it has allowed the company to specialise in the supply of wheat and corn milling plants, feed mills, and cereal processing systems in general, as well as and above all, starting in 1982, with the "turnkey" formula that has undoubtedly led it to be recognised as a great multinational company throughout the world.
A leading international supplier of goods and services for intelligent milling is Henry Simon. Today, Henry Simon provides the milling sector with a wide selection of dependable aftermarket parts and premium intelligent milling equipment. Grain milling equipment, a broad range of high-tech cleaning equipment, including optical sorters, high-performance grain and flour handling gear, accurate scale and packaging equipment, and products for servicing customers globally, are its core product lines.
Recent Developments
- In February 2022, Satake provided a more intelligent and cost-effective paddy husker. To reduce operational expenses, the new HR10DDF-T makes use of the Idler Switching System, Satake's most recent patented technology. To maintain the continuous optimal pressure required to remove the husk without damaging the kernel, the innovative Idler Switching System automatically modifies the speed and pressure of husking rollers.
- In December 2021, the first phase of Henry Simon's new grain cleaning equipment for the milling sector was unveiled. These have had a makeover in addition to some significant structural upgrades.
- In October 2019, the 100 T/24h organic mill was evaluated in Girolomoni. It enables the cooperative to make semolina using organically grown grains and cereals. A missing ring that the Cooperativa Gino Girolomoni members were able to complete with Ocrim's assistance. The machinery that makes up the mill is among Ocrim's finest and most cutting-edge. The traceability of all productions is guaranteed by the high level of automation.
- In August 2018, Alapala built the largest flour mill in Serbia. The daily manufacturing capacity of this factory will be 300 tonnes.
Wheat Milling Machine Market Report Scope
Attribute |
Details |
Forecast Period |
2023-2033 |
Historical Data Available for |
2018-2022 |
Market Analysis |
USD Mn for Value and Units for Volume |
Key Regions Covered |
|
Key Countries Covered |
|
Key Segments Covered |
|
Key Companies Profiled |
|
Report Coverage |
Strategic Growth Initiatives, DROT Analysis, Market Forecast, Company Share Analysis, Market Dynamics and Challenges, and Competitive Landscape. |
Customization & Pricing |
Available upon Request |
Segmentation of Wheat Milling Machine Market
Segmentation by Type:
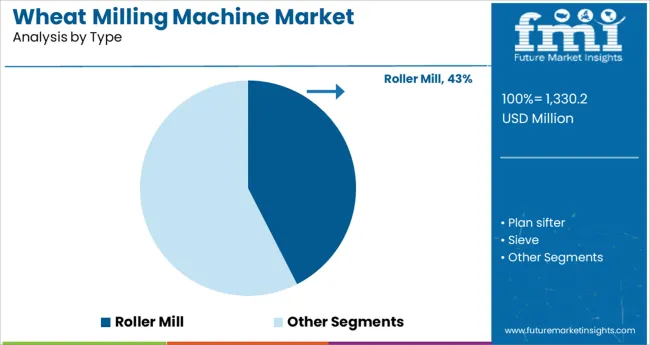
- Roller Mill
- Plan sifter
- Sieve
Segmentation by Application:
- Bakeries & Confectioneries
- Pasta & Noodle Manufacturing
- Breakfast Cereals Manufacturing
- Animal Feed Manufacturing
Segmentation by Sales Channel:
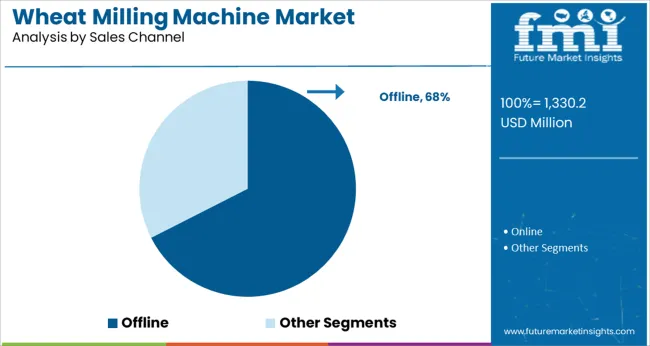
- Online
- Offline
Segmentation by Region:
- North America
- Europe
- Asia Pacific
- Latin America
- MEA
- RoW
Frequently Asked Questions
The global Wheat Milling Machine market will reach a valuation of USD 1,232.2 Mn by the end of 2023.
The U.S. Wheat Milling Machine Market is contributing 35.6% of total market share which values around USD 438.7 Mn.
U.S., Canada, Mexico, Argentina, Brazil, Germany, U.K., France, Italy, Russia, Spain China, Japan, India, Indonesia, South Korea, Australia are the major countries driving demand for Wheat Milling Machine Market.
The Germany Wheat Milling Machine Market is contributing 22.4% of total market share which values at USD 276.0 Mn.
• Bühler AG • Ocrim SpA • Satake Corporation • Alapala Machine Industry & Trade Inc. • Henry Simon Group Above are the top 5 market players in Wheat Milling Machine industry.
The Japan Wheat Milling Machine market contribution is 3.5% of total market share.
The India Wheat Milling Machine market will grow at 6.6% CAGR between 2023 and 2033.
The global Wheat Milling Machine market is forecasted to surpass USD 1,806.5 Mn by the end of 2033.
Table of Content
1. Executive Summary
1.1. Global Market Outlook
1.2. Demand-side Trends
1.3. Supply-side Trends
1.4. Technology Roadmap Analysis
1.5. Analysis and Recommendations
2. Market Overview
2.1. Market Coverage / Taxonomy
2.2. Market Definition / Scope / Limitations
3. Market Background
3.1. Market Dynamics
3.1.1. Drivers
3.1.2. Restraints
3.1.3. Opportunity
3.1.4. Trends
3.2. Scenario Forecast
3.2.1. Demand in Optimistic Scenario
3.2.2. Demand in Likely Scenario
3.2.3. Demand in Conservative Scenario
3.3. Product launches & Recent Developments
3.4. Product Life Cycle Analysis
3.5. Value Chain Analysis
3.5.1. Supply Side Participants and their Roles
3.5.1.1. Producers
3.5.1.2. Mid-Level Participants (Traders/ Agents/ Brokers)
3.5.1.3. Wholesalers and Distributors
3.5.2. % of Operating Margin Analysis
3.5.3. List of Raw Material Suppliers
3.5.4. List of Existing and Potential Buyer’s
3.6. Global Market - Pricing Analysis
3.6.1. Price Point Assessment by Region
3.6.2. Price Point Assessment by Product Type
3.6.3. Price Forecast till 2033
3.6.4. Factors affecting pricing
3.7. Forecast Factors - Relevance & Impact
3.8. PESTLE and Porter’s Analysis
3.9. Regulatory Landscape
3.9.1. Packaging & Labelling Regulations
3.9.2. Certifications and Certifying Agency Overview
3.9.3. Import/Export Policies
3.10. Regional Parent Market Outlook
3.11. Production and Consumption Statistics
3.12. Import and Export Statistics
3.13. Consumers Survey Analysis
3.14. Macro-Economic Factors
3.15. Product Claims & Nutritional Information Scan by Buyers
4. Global Market Analysis 2018-2022 and Forecast, 2023-2033
4.1. Historical Market Size Value (US$ Mn) & Volume (MT) Analysis, 2018-2022
4.2. Current and Future Market Size Value (US$ Mn) & Volume (MT) Projections, 2023-2033
4.2.1. Y-o-Y Growth Trend Analysis
4.2.2. Absolute $ Opportunity Analysis
5. Global Market Analysis 2018-2022 and Forecast 2023-2033, By Type
5.1. Introduction / Key Findings
5.2. Historical Market Size Value (US$ Mn) & Volume (MT) Analysis By Type, 2018-2022
5.3. Current and Future Market Size Value (US$ Mn) & Volume (MT) Analysis and Forecast By Type, 2023-2033
5.3.1. Roller Mill
5.3.2. Plan sifter
5.3.3. Sieve
5.4. Y-o-Y Growth Trend Analysis By Type, 2018-2022
5.5. Absolute $ Opportunity Analysis By Type, 2023-2033
6. Global Market Analysis 2018-2022 and Forecast 2023-2033, By Application
6.1. Introduction / Key Findings
6.2. Historical Market Size Value (US$ Mn) & Volume (MT) Analysis By Application, 2018-2022
6.3. Current and Future Market Size Value (US$ Mn) & Volume (MT) Analysis and Forecast By Application, 2023-2033
6.3.1. Bakeries & Confectioneries
6.3.2. Pasta & Noodle Manufacturing
6.3.3. Breakfast Cereals Manufacturing
6.3.4. Animal Feed Manufacturing
6.4. Y-o-Y Growth Trend Analysis By Application, 2018-2022
6.5. Absolute $ Opportunity Analysis By Application, 2023-2033
7. Global Market Analysis 2018-2022 and Forecast 2023-2033, By Region
7.1. Introduction
7.2. Historical Market Size Value (US$ Mn) & Volume (MT) Analysis By Region, 2018-2022
7.3. Current Market Size Value (US$ Mn) & Volume (MT) Analysis and Forecast By Region, 2023-2033
7.3.1. North America
7.3.2. Latin America
7.3.3. Europe
7.3.4. East Asia
7.3.5. South Asia
7.3.6. Oceania
7.3.7. MEA
7.4. Market Attractiveness Analysis By Region
8. North America Market Analysis 2018-2022 and Forecast 2023-2033, By Country
8.1. Historical Market Size Value (US$ Mn) & Volume (MT) Trend Analysis By Market Taxonomy, 2018-2022
8.2. Market Size Value (US$ Mn) & Volume (MT) Forecast By Market Taxonomy, 2023-2033
8.2.1. By Country
8.2.1.1. U.S.
8.2.1.2. Canada
8.2.2. By Type
8.2.3. By Application
8.3. Market Attractiveness Analysis
8.3.1. By Country
8.3.2. By Type
8.3.3. By Application
8.4. Key Takeaways
9. Latin America Market Analysis 2018-2022 and Forecast 2023-2033, By Country
9.1. Historical Market Size Value (US$ Mn) & Volume (MT) Trend Analysis By Market Taxonomy, 2018-2022
9.2. Market Size Value (US$ Mn) & Volume (MT) Forecast By Market Taxonomy, 2023-2033
9.2.1. By Country
9.2.1.1. Brazil
9.2.1.2. Mexico
9.2.1.3. Argentina
9.2.1.4. Chile
9.2.1.5. Peru
9.2.1.6. Rest of Latin America
9.2.2. By Type
9.2.3. By Application
9.3. Market Attractiveness Analysis
9.3.1. By Country
9.3.2. By Type
9.3.3. By Application
9.4. Key Takeaways
10. Europe Market Analysis 2018-2022 and Forecast 2023-2033, By Country
10.1. Historical Market Size Value (US$ Mn) & Volume (MT) Trend Analysis By Market Taxonomy, 2018-2022
10.2. Market Size Value (US$ Mn) & Volume (MT) Forecast By Market Taxonomy, 2023-2033
10.2.1. By Country
10.2.1.1. Germany
10.2.1.2. Italy
10.2.1.3. France
10.2.1.4. U.K.
10.2.1.5. Spain
10.2.1.6. Russia
10.2.1.7. BENELUX
10.2.1.8. Poland
10.2.1.9. Nordic Countries
10.2.1.10. Rest of Europe
10.2.2. By Type
10.2.3. By Application
10.3. Market Attractiveness Analysis
10.3.1. By Country
10.3.2. By Type
10.3.3. By Application
10.4. Key Takeaways
11. East Asia Market Analysis 2018-2022 and Forecast 2023-2033, By Country
11.1. Historical Market Size Value (US$ Mn) & Volume (MT) Trend Analysis By Market Taxonomy, 2018-2022
11.2. Market Size Value (US$ Mn) & Volume (MT) Forecast By Market Taxonomy, 2023-2033
11.2.1. By Country
11.2.1.1. China
11.2.1.2. Japan
11.2.1.3. South Korea
11.2.2. By Type
11.2.3. By Application
11.3. Market Attractiveness Analysis
11.3.1. By Country
11.3.2. By Type
11.3.3. By Application
11.4. Key Takeaways
12. South Asia Market Analysis 2018-2022 and Forecast 2023-2033, By Country
12.1. Historical Market Size Value (US$ Mn) & Volume (MT) Trend Analysis By Market Taxonomy, 2018-2022
12.2. Market Size Value (US$ Mn) & Volume (MT) Forecast By Market Taxonomy, 2023-2033
12.2.1. By Country
12.2.1.1. India
12.2.1.2. Thailand
12.2.1.3. Malaysia
12.2.1.4. Indonesia
12.2.1.5. Singapore
12.2.1.6. Rest of South Asia
12.2.2. By Type
12.2.3. By Application
12.3. Market Attractiveness Analysis
12.3.1. By Country
12.3.2. By Type
12.3.3. By Application
12.4. Key Takeaways
13. Oceania Market Analysis 2018-2022 and Forecast 2023-2033, By Country
13.1. Historical Market Size Value (US$ Mn) & Volume (MT) Trend Analysis By Market Taxonomy, 2018-2022
13.2. Market Size Value (US$ Mn) & Volume (MT) Forecast By Market Taxonomy, 2023-2033
13.2.1. By Country
13.2.1.1. Australia
13.2.1.2. New Zealand
13.2.2. By Type
13.2.3. By Application
13.3. Market Attractiveness Analysis
13.3.1. By Country
13.3.2. By Type
13.3.3. By Application
13.4. Key Takeaways
14. MEA Market Analysis 2018-2022 and Forecast 2023-2033, By Country
14.1. Historical Market Size Value (US$ Mn) & Volume (MT) Trend Analysis By Market Taxonomy, 2018-2022
14.2. Market Size Value (US$ Mn) & Volume (MT) Forecast By Market Taxonomy, 2023-2033
14.2.1. By Country
14.2.1.1. GCC Countries
14.2.1.2. South Africa
14.2.1.3. Central Africa
14.2.1.4. North Africa
14.2.2. By Type
14.2.3. By Application
14.3. Market Attractiveness Analysis
14.3.1. By Country
14.3.2. By Type
14.3.3. By Application
14.4. Key Takeaways
15. Key Countries Market Analysis
15.1. U.S.
15.1.1. Pricing Analysis
15.1.2. Market Share Analysis, 2022
15.1.2.1. By Type
15.1.2.2. By Application
15.2. Canada
15.2.1. Pricing Analysis
15.2.2. Market Share Analysis, 2022
15.2.2.1. By Type
15.2.2.2. By Application
15.3. Brazil
15.3.1. Pricing Analysis
15.3.2. Market Share Analysis, 2022
15.3.2.1. By Type
15.3.2.2. By Application
15.4. Mexico
15.4.1. Pricing Analysis
15.4.2. Market Share Analysis, 2022
15.4.2.1. By Type
15.4.2.2. By Application
15.5. Argentina
15.5.1. Pricing Analysis
15.5.2. Market Share Analysis, 2022
15.5.2.1. By Type
15.5.2.2. By Application
15.6. Chile
15.6.1. Pricing Analysis
15.6.2. Market Share Analysis, 2022
15.6.2.1. By Type
15.6.2.2. By Application
15.7. Peru
15.7.1. Pricing Analysis
15.7.2. Market Share Analysis, 2022
15.7.2.1. By Type
15.7.2.2. By Application
15.8. Germany
15.8.1. Pricing Analysis
15.8.2. Market Share Analysis, 2022
15.8.2.1. By Type
15.8.2.2. By Application
15.9. Italy
15.9.1. Pricing Analysis
15.9.2. Market Share Analysis, 2022
15.9.2.1. By Type
15.9.2.2. By Application
15.10. France
15.10.1. Pricing Analysis
15.10.2. Market Share Analysis, 2022
15.10.2.1. By Type
15.10.2.2. By Application
15.11. Spain
15.11.1. Pricing Analysis
15.11.2. Market Share Analysis, 2022
15.11.2.1. By Type
15.11.2.2. By Application
15.12. U.K.
15.12.1. Pricing Analysis
15.12.2. Market Share Analysis, 2022
15.12.2.1. By Type
15.12.2.2. By Application
15.13. Russia
15.13.1. Pricing Analysis
15.13.2. Market Share Analysis, 2022
15.13.2.1. By Type
15.13.2.2. By Application
15.14. Poland
15.14.1. Pricing Analysis
15.14.2. Market Share Analysis, 2022
15.14.2.1. By Type
15.14.2.2. By Application
15.15. BENELUX
15.15.1. Pricing Analysis
15.15.2. Market Share Analysis, 2022
15.15.2.1. By Type
15.15.2.2. By Application
15.16. Nordic Countries
15.16.1. Pricing Analysis
15.16.2. Market Share Analysis, 2022
15.16.2.1. By Type
15.16.2.2. By Application
15.17. China
15.17.1. Pricing Analysis
15.17.2. Market Share Analysis, 2022
15.17.2.1. By Type
15.17.2.2. By Application
15.18. Japan
15.18.1. Pricing Analysis
15.18.2. Market Share Analysis, 2022
15.18.2.1. By Type
15.18.2.2. By Application
15.19. South Korea
15.19.1. Pricing Analysis
15.19.2. Market Share Analysis, 2022
15.19.2.1. By Type
15.19.2.2. By Application
15.20. India
15.20.1. Pricing Analysis
15.20.2. Market Share Analysis, 2022
15.20.2.1. By Type
15.20.2.2. By Application
15.21. Thailand
15.21.1. Pricing Analysis
15.21.2. Market Share Analysis, 2022
15.21.2.1. By Type
15.21.2.2. By Application
15.22. Indonesia
15.22.1. Pricing Analysis
15.22.2. Market Share Analysis, 2022
15.22.2.1. By Type
15.22.2.2. By Application
15.23. Malaysia
15.23.1. Pricing Analysis
15.23.2. Market Share Analysis, 2022
15.23.2.1. By Type
15.23.2.2. By Application
15.24. Singapore
15.24.1. Pricing Analysis
15.24.2. Market Share Analysis, 2022
15.24.2.1. By Type
15.24.2.2. By Application
15.25. Australia
15.25.1. Pricing Analysis
15.25.2. Market Share Analysis, 2022
15.25.2.1. By Type
15.25.2.2. By Application
15.26. New Zealand
15.26.1. Pricing Analysis
15.26.2. Market Share Analysis, 2022
15.26.2.1. By Type
15.26.2.2. By Application
15.27. GCC Countries
15.27.1. Pricing Analysis
15.27.2. Market Share Analysis, 2022
15.27.2.1. By Type
15.27.2.2. By Application
15.28. South Africa
15.28.1. Pricing Analysis
15.28.2. Market Share Analysis, 2022
15.28.2.1. By Type
15.28.2.2. By Application
15.29. North Africa
15.29.1. Pricing Analysis
15.29.2. Market Share Analysis, 2022
15.29.2.1. By Type
15.29.2.2. By Application
15.30. Central Africa
15.30.1. Pricing Analysis
15.30.2. Market Share Analysis, 2022
15.30.2.1. By Type
15.30.2.2. By Application
16. Market Structure Analysis
16.1. Competition Dashboard
16.2. Competition Benchmarking
16.3. Market Share Analysis of Top Players
16.3.1. By Regional
16.3.2. By Type
16.3.3. By Application
17. Competition Analysis
17.1. Competition Deep Dive
17.1.1. Bühler AG
17.1.1.1. Overview
17.1.1.2. Product Portfolio
17.1.1.3. Profitability by Market Segments (Type /Application/Region)
17.1.1.4. Sales Footprint
17.1.1.5. Strategy Overview
17.1.1.5.1. Marketing Strategy
17.1.1.5.2. Product Strategy
17.1.1.5.3. Channel Strategy
17.1.2. Ocrim SpA
17.1.2.1. Overview
17.1.2.2. Product Portfolio
17.1.2.3. Profitability by Market Segments (Type /Application/Region)
17.1.2.4. Sales Footprint
17.1.2.5. Strategy Overview
17.1.2.5.1. Marketing Strategy
17.1.2.5.2. Product Strategy
17.1.2.5.3. Channel Strategy
17.1.3. Satake Corporation
17.1.3.1. Overview
17.1.3.2. Product Portfolio
17.1.3.3. Profitability by Market Segments (Type /Application/Region)
17.1.3.4. Sales Footprint
17.1.3.5. Strategy Overview
17.1.3.5.1. Marketing Strategy
17.1.3.5.2. Product Strategy
17.1.3.5.3. Channel Strategy
17.1.4. Alapala Machine Industry & Trade Inc.
17.1.4.1. Overview
17.1.4.2. Product Portfolio
17.1.4.3. Profitability by Market Segments (Type /Application/Region)
17.1.4.4. Sales Footprint
17.1.4.5. Strategy Overview
17.1.4.5.1. Marketing Strategy
17.1.4.5.2. Product Strategy
17.1.4.5.3. Channel Strategy
17.1.5. Henry Simon Group
17.1.5.1. Overview
17.1.5.2. Product Portfolio
17.1.5.3. Profitability by Market Segments (Type /Application/Region)
17.1.5.4. Sales Footprint
17.1.5.5. Strategy Overview
17.1.5.5.1. Marketing Strategy
17.1.5.5.2. Product Strategy
17.1.5.5.3. Channel Strategy
17.1.6. Conagra Brands Inc
17.1.6.1. Overview
17.1.6.2. Product Portfolio
17.1.6.3. Profitability by Market Segments (Type /Application/Region)
17.1.6.4. Sales Footprint
17.1.6.5. Strategy Overview
17.1.6.5.1. Marketing Strategy
17.1.6.5.2. Product Strategy
17.1.6.5.3. Channel Strategy
17.1.7. Archer Daniels Midland Company
17.1.7.1. Overview
17.1.7.2. Product Portfolio
17.1.7.3. Profitability by Market Segments (Type /Application/Region)
17.1.7.4. Sales Footprint
17.1.7.5. Strategy Overview
17.1.7.5.1. Marketing Strategy
17.1.7.5.2. Product Strategy
17.1.7.5.3. Channel Strategy
17.1.8. Cargill Incorporated
17.1.8.1. Overview
17.1.8.2. Product Portfolio
17.1.8.3. Profitability by Market Segments (Type /Application/Region)
17.1.8.4. Sales Footprint
17.1.8.5. Strategy Overview
17.1.8.5.1. Marketing Strategy
17.1.8.5.2. Product Strategy
17.1.8.5.3. Channel Strategy
17.1.9. The King Milling Company
17.1.9.1. Overview
17.1.9.2. Product Portfolio
17.1.9.3. Profitability by Market Segments (Type /Application/Region)
17.1.9.4. Sales Footprint
17.1.9.5. Strategy Overview
17.1.9.5.1. Marketing Strategy
17.1.9.5.2. Product Strategy
17.1.9.5.3. Channel Strategy
17.1.10. Ardent Mills LLC
17.1.10.1. Overview
17.1.10.2. Product Portfolio
17.1.10.3. Profitability by Market Segments (Type /Application/Region)
17.1.10.4. Sales Footprint
17.1.10.5. Strategy Overview
17.1.10.5.1. Marketing Strategy
17.1.10.5.2. Product Strategy
17.1.10.5.3. Channel Strategy
18. Assumptions & Acronyms Used
19. Research Methodology
Let us know your requirement to get
100% FREE customization
List of Tables
Table 1: Global Market Value (US$ Mn) Forecast by Region, 2018-2033
Table 2: Global Market Volume (MT) Forecast by Region, 2018-2033
Table 3: Global Market Value (US$ Mn) Forecast by Type, 2018-2033
Table 4: Global Market Volume (MT) Forecast by Type, 2018-2033
Table 5: Global Market Value (US$ Mn) Forecast by Application, 2018-2033
Table 6: Global Market Volume (MT) Forecast by Application, 2018-2033
Table 7: North America Market Value (US$ Mn) Forecast by Country, 2018-2033
Table 8: North America Market Volume (MT) Forecast by Country, 2018-2033
Table 9: North America Market Value (US$ Mn) Forecast by Type, 2018-2033
Table 10: North America Market Volume (MT) Forecast by Type, 2018-2033
Table 11: North America Market Value (US$ Mn) Forecast by Application, 2018-2033
Table 12: North America Market Volume (MT) Forecast by Application, 2018-2033
Table 13: Latin America Market Value (US$ Mn) Forecast by Country, 2018-2033
Table 14: Latin America Market Volume (MT) Forecast by Country, 2018-2033
Table 15: Latin America Market Value (US$ Mn) Forecast by Type, 2018-2033
Table 16: Latin America Market Volume (MT) Forecast by Type, 2018-2033
Table 17: Latin America Market Value (US$ Mn) Forecast by Application, 2018-2033
Table 18: Latin America Market Volume (MT) Forecast by Application, 2018-2033
Table 19: Europe Market Value (US$ Mn) Forecast by Country, 2018-2033
Table 20: Europe Market Volume (MT) Forecast by Country, 2018-2033
Table 21: Europe Market Value (US$ Mn) Forecast by Type, 2018-2033
Table 22: Europe Market Volume (MT) Forecast by Type, 2018-2033
Table 23: Europe Market Value (US$ Mn) Forecast by Application, 2018-2033
Table 24: Europe Market Volume (MT) Forecast by Application, 2018-2033
Table 25: East Asia Market Value (US$ Mn) Forecast by Country, 2018-2033
Table 26: East Asia Market Volume (MT) Forecast by Country, 2018-2033
Table 27: East Asia Market Value (US$ Mn) Forecast by Type, 2018-2033
Table 28: East Asia Market Volume (MT) Forecast by Type, 2018-2033
Table 29: East Asia Market Value (US$ Mn) Forecast by Application, 2018-2033
Table 30: East Asia Market Volume (MT) Forecast by Application, 2018-2033
Table 31: South Asia Market Value (US$ Mn) Forecast by Country, 2018-2033
Table 32: South Asia Market Volume (MT) Forecast by Country, 2018-2033
Table 33: South Asia Market Value (US$ Mn) Forecast by Type, 2018-2033
Table 34: South Asia Market Volume (MT) Forecast by Type, 2018-2033
Table 35: South Asia Market Value (US$ Mn) Forecast by Application, 2018-2033
Table 36: South Asia Market Volume (MT) Forecast by Application, 2018-2033
Table 37: Oceania Market Value (US$ Mn) Forecast by Country, 2018-2033
Table 38: Oceania Market Volume (MT) Forecast by Country, 2018-2033
Table 39: Oceania Market Value (US$ Mn) Forecast by Type, 2018-2033
Table 40: Oceania Market Volume (MT) Forecast by Type, 2018-2033
Table 41: Oceania Market Value (US$ Mn) Forecast by Application, 2018-2033
Table 42: Oceania Market Volume (MT) Forecast by Application, 2018-2033
Table 43: MEA Market Value (US$ Mn) Forecast by Country, 2018-2033
Table 44: MEA Market Volume (MT) Forecast by Country, 2018-2033
Table 45: MEA Market Value (US$ Mn) Forecast by Type, 2018-2033
Table 46: MEA Market Volume (MT) Forecast by Type, 2018-2033
Table 47: MEA Market Value (US$ Mn) Forecast by Application, 2018-2033
Table 48: MEA Market Volume (MT) Forecast by Application, 2018-2033
Find your sweet spots for generating winning opportunities in this market.
Talk to AnalystList of Charts
Figure 1: Global Market Value (US$ Mn) by Type, 2023-2033
Figure 2: Global Market Value (US$ Mn) by Application, 2023-2033
Figure 3: Global Market Value (US$ Mn) by Region, 2023-2033
Figure 4: Global Market Value (US$ Mn) Analysis by Region, 2018-2033
Figure 5: Global Market Volume (MT) Analysis by Region, 2018-2033
Figure 6: Global Market Value Share (%) and BPS Analysis by Region, 2023-2033
Figure 7: Global Market Y-o-Y Growth (%) Projections by Region, 2023-2033
Figure 8: Global Market Value (US$ Mn) Analysis by Type, 2018-2033
Figure 9: Global Market Volume (MT) Analysis by Type, 2018-2033
Figure 10: Global Market Value Share (%) and BPS Analysis by Type, 2023-2033
Figure 11: Global Market Y-o-Y Growth (%) Projections by Type, 2023-2033
Figure 12: Global Market Value (US$ Mn) Analysis by Application, 2018-2033
Figure 13: Global Market Volume (MT) Analysis by Application, 2018-2033
Figure 14: Global Market Value Share (%) and BPS Analysis by Application, 2023-2033
Figure 15: Global Market Y-o-Y Growth (%) Projections by Application, 2023-2033
Figure 16: Global Market Attractiveness by Type, 2023-2033
Figure 17: Global Market Attractiveness by Application, 2023-2033
Figure 18: Global Market Attractiveness by Region, 2023-2033
Figure 19: North America Market Value (US$ Mn) by Type, 2023-2033
Figure 20: North America Market Value (US$ Mn) by Application, 2023-2033
Figure 21: North America Market Value (US$ Mn) by Country, 2023-2033
Figure 22: North America Market Value (US$ Mn) Analysis by Country, 2018-2033
Figure 23: North America Market Volume (MT) Analysis by Country, 2018-2033
Figure 24: North America Market Value Share (%) and BPS Analysis by Country, 2023-2033
Figure 25: North America Market Y-o-Y Growth (%) Projections by Country, 2023-2033
Figure 26: North America Market Value (US$ Mn) Analysis by Type, 2018-2033
Figure 27: North America Market Volume (MT) Analysis by Type, 2018-2033
Figure 28: North America Market Value Share (%) and BPS Analysis by Type, 2023-2033
Figure 29: North America Market Y-o-Y Growth (%) Projections by Type, 2023-2033
Figure 30: North America Market Value (US$ Mn) Analysis by Application, 2018-2033
Figure 31: North America Market Volume (MT) Analysis by Application, 2018-2033
Figure 32: North America Market Value Share (%) and BPS Analysis by Application, 2023-2033
Figure 33: North America Market Y-o-Y Growth (%) Projections by Application, 2023-2033
Figure 34: North America Market Attractiveness by Type, 2023-2033
Figure 35: North America Market Attractiveness by Application, 2023-2033
Figure 36: North America Market Attractiveness by Country, 2023-2033
Figure 37: Latin America Market Value (US$ Mn) by Type, 2023-2033
Figure 38: Latin America Market Value (US$ Mn) by Application, 2023-2033
Figure 39: Latin America Market Value (US$ Mn) by Country, 2023-2033
Figure 40: Latin America Market Value (US$ Mn) Analysis by Country, 2018-2033
Figure 41: Latin America Market Volume (MT) Analysis by Country, 2018-2033
Figure 42: Latin America Market Value Share (%) and BPS Analysis by Country, 2023-2033
Figure 43: Latin America Market Y-o-Y Growth (%) Projections by Country, 2023-2033
Figure 44: Latin America Market Value (US$ Mn) Analysis by Type, 2018-2033
Figure 45: Latin America Market Volume (MT) Analysis by Type, 2018-2033
Figure 46: Latin America Market Value Share (%) and BPS Analysis by Type, 2023-2033
Figure 47: Latin America Market Y-o-Y Growth (%) Projections by Type, 2023-2033
Figure 48: Latin America Market Value (US$ Mn) Analysis by Application, 2018-2033
Figure 49: Latin America Market Volume (MT) Analysis by Application, 2018-2033
Figure 50: Latin America Market Value Share (%) and BPS Analysis by Application, 2023-2033
Figure 51: Latin America Market Y-o-Y Growth (%) Projections by Application, 2023-2033
Figure 52: Latin America Market Attractiveness by Type, 2023-2033
Figure 53: Latin America Market Attractiveness by Application, 2023-2033
Figure 54: Latin America Market Attractiveness by Country, 2023-2033
Figure 55: Europe Market Value (US$ Mn) by Type, 2023-2033
Figure 56: Europe Market Value (US$ Mn) by Application, 2023-2033
Figure 57: Europe Market Value (US$ Mn) by Country, 2023-2033
Figure 58: Europe Market Value (US$ Mn) Analysis by Country, 2018-2033
Figure 59: Europe Market Volume (MT) Analysis by Country, 2018-2033
Figure 60: Europe Market Value Share (%) and BPS Analysis by Country, 2023-2033
Figure 61: Europe Market Y-o-Y Growth (%) Projections by Country, 2023-2033
Figure 62: Europe Market Value (US$ Mn) Analysis by Type, 2018-2033
Figure 63: Europe Market Volume (MT) Analysis by Type, 2018-2033
Figure 64: Europe Market Value Share (%) and BPS Analysis by Type, 2023-2033
Figure 65: Europe Market Y-o-Y Growth (%) Projections by Type, 2023-2033
Figure 66: Europe Market Value (US$ Mn) Analysis by Application, 2018-2033
Figure 67: Europe Market Volume (MT) Analysis by Application, 2018-2033
Figure 68: Europe Market Value Share (%) and BPS Analysis by Application, 2023-2033
Figure 69: Europe Market Y-o-Y Growth (%) Projections by Application, 2023-2033
Figure 70: Europe Market Attractiveness by Type, 2023-2033
Figure 71: Europe Market Attractiveness by Application, 2023-2033
Figure 72: Europe Market Attractiveness by Country, 2023-2033
Figure 73: East Asia Market Value (US$ Mn) by Type, 2023-2033
Figure 74: East Asia Market Value (US$ Mn) by Application, 2023-2033
Figure 75: East Asia Market Value (US$ Mn) by Country, 2023-2033
Figure 76: East Asia Market Value (US$ Mn) Analysis by Country, 2018-2033
Figure 77: East Asia Market Volume (MT) Analysis by Country, 2018-2033
Figure 78: East Asia Market Value Share (%) and BPS Analysis by Country, 2023-2033
Figure 79: East Asia Market Y-o-Y Growth (%) Projections by Country, 2023-2033
Figure 80: East Asia Market Value (US$ Mn) Analysis by Type, 2018-2033
Figure 81: East Asia Market Volume (MT) Analysis by Type, 2018-2033
Figure 82: East Asia Market Value Share (%) and BPS Analysis by Type, 2023-2033
Figure 83: East Asia Market Y-o-Y Growth (%) Projections by Type, 2023-2033
Figure 84: East Asia Market Value (US$ Mn) Analysis by Application, 2018-2033
Figure 85: East Asia Market Volume (MT) Analysis by Application, 2018-2033
Figure 86: East Asia Market Value Share (%) and BPS Analysis by Application, 2023-2033
Figure 87: East Asia Market Y-o-Y Growth (%) Projections by Application, 2023-2033
Figure 88: East Asia Market Attractiveness by Type, 2023-2033
Figure 89: East Asia Market Attractiveness by Application, 2023-2033
Figure 90: East Asia Market Attractiveness by Country, 2023-2033
Figure 91: South Asia Market Value (US$ Mn) by Type, 2023-2033
Figure 92: South Asia Market Value (US$ Mn) by Application, 2023-2033
Figure 93: South Asia Market Value (US$ Mn) by Country, 2023-2033
Figure 94: South Asia Market Value (US$ Mn) Analysis by Country, 2018-2033
Figure 95: South Asia Market Volume (MT) Analysis by Country, 2018-2033
Figure 96: South Asia Market Value Share (%) and BPS Analysis by Country, 2023-2033
Figure 97: South Asia Market Y-o-Y Growth (%) Projections by Country, 2023-2033
Figure 98: South Asia Market Value (US$ Mn) Analysis by Type, 2018-2033
Figure 99: South Asia Market Volume (MT) Analysis by Type, 2018-2033
Figure 100: South Asia Market Value Share (%) and BPS Analysis by Type, 2023-2033
Figure 101: South Asia Market Y-o-Y Growth (%) Projections by Type, 2023-2033
Figure 102: South Asia Market Value (US$ Mn) Analysis by Application, 2018-2033
Figure 103: South Asia Market Volume (MT) Analysis by Application, 2018-2033
Figure 104: South Asia Market Value Share (%) and BPS Analysis by Application, 2023-2033
Figure 105: South Asia Market Y-o-Y Growth (%) Projections by Application, 2023-2033
Figure 106: South Asia Market Attractiveness by Type, 2023-2033
Figure 107: South Asia Market Attractiveness by Application, 2023-2033
Figure 108: South Asia Market Attractiveness by Country, 2023-2033
Figure 109: Oceania Market Value (US$ Mn) by Type, 2023-2033
Figure 110: Oceania Market Value (US$ Mn) by Application, 2023-2033
Figure 111: Oceania Market Value (US$ Mn) by Country, 2023-2033
Figure 112: Oceania Market Value (US$ Mn) Analysis by Country, 2018-2033
Figure 113: Oceania Market Volume (MT) Analysis by Country, 2018-2033
Figure 114: Oceania Market Value Share (%) and BPS Analysis by Country, 2023-2033
Figure 115: Oceania Market Y-o-Y Growth (%) Projections by Country, 2023-2033
Figure 116: Oceania Market Value (US$ Mn) Analysis by Type, 2018-2033
Figure 117: Oceania Market Volume (MT) Analysis by Type, 2018-2033
Figure 118: Oceania Market Value Share (%) and BPS Analysis by Type, 2023-2033
Figure 119: Oceania Market Y-o-Y Growth (%) Projections by Type, 2023-2033
Figure 120: Oceania Market Value (US$ Mn) Analysis by Application, 2018-2033
Figure 121: Oceania Market Volume (MT) Analysis by Application, 2018-2033
Figure 122: Oceania Market Value Share (%) and BPS Analysis by Application, 2023-2033
Figure 123: Oceania Market Y-o-Y Growth (%) Projections by Application, 2023-2033
Figure 124: Oceania Market Attractiveness by Type, 2023-2033
Figure 125: Oceania Market Attractiveness by Application, 2023-2033
Figure 126: Oceania Market Attractiveness by Country, 2023-2033
Figure 127: MEA Market Value (US$ Mn) by Type, 2023-2033
Figure 128: MEA Market Value (US$ Mn) by Application, 2023-2033
Figure 129: MEA Market Value (US$ Mn) by Country, 2023-2033
Figure 130: MEA Market Value (US$ Mn) Analysis by Country, 2018-2033
Figure 131: MEA Market Volume (MT) Analysis by Country, 2018-2033
Figure 132: MEA Market Value Share (%) and BPS Analysis by Country, 2023-2033
Figure 133: MEA Market Y-o-Y Growth (%) Projections by Country, 2023-2033
Figure 134: MEA Market Value (US$ Mn) Analysis by Type, 2018-2033
Figure 135: MEA Market Volume (MT) Analysis by Type, 2018-2033
Figure 136: MEA Market Value Share (%) and BPS Analysis by Type, 2023-2033
Figure 137: MEA Market Y-o-Y Growth (%) Projections by Type, 2023-2033
Figure 138: MEA Market Value (US$ Mn) Analysis by Application, 2018-2033
Figure 139: MEA Market Volume (MT) Analysis by Application, 2018-2033
Figure 140: MEA Market Value Share (%) and BPS Analysis by Application, 2023-2033
Figure 141: MEA Market Y-o-Y Growth (%) Projections by Application, 2023-2033
Figure 142: MEA Market Attractiveness by Type, 2023-2033
Figure 143: MEA Market Attractiveness by Application, 2023-2033
Figure 144: MEA Market Attractiveness by Country, 2023-2033
Need specific information?
Request CustomizationExplore Process Automation Insights
View Reports