Spelt Wheat Market Size and Share Forecast Outlook 2025 to 2035

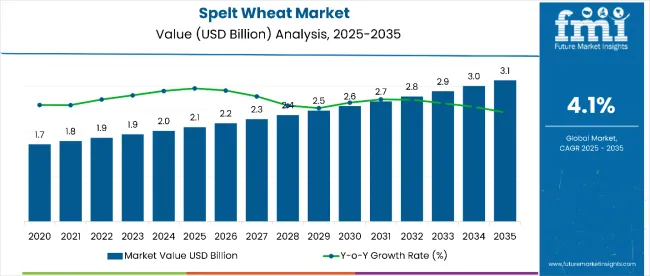
The spelt wheat market is estimated to be valued at USD 2.1 billion in 2025 and is projected to reach USD 3.1 billion by 2035, registering a compound annual growth rate (CAGR) of 4.1% over the forecast period. The spelt wheat market is projected to add an absolute dollar opportunity of USD 1.0 billion over the forecast period.
Quick Stats for Spelt Wheat Market

  • Spelt Wheat Market Value (2025): USD 2.1 billion
  • Spelt Wheat Market Forecast Value (2035): USD 3.1 billion
  • Spelt Wheat Market Forecast CAGR: 4.1%
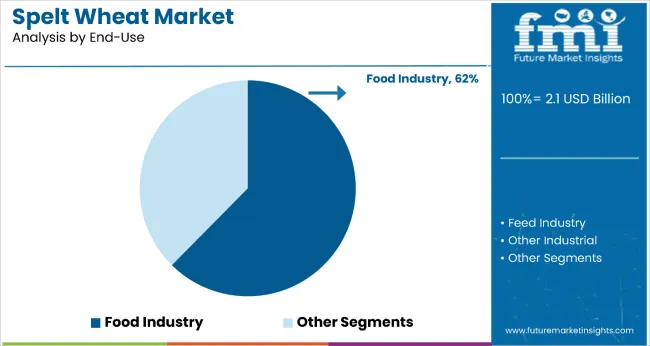
  • Leading Segment in Spelt Wheat Market in 2025: Food Industry (62% market share)
  • Key Growth Regions in Spelt Wheat Market: North America, Europe, Asia-Pacific
  • Top Key Players in Spelt Wheat Market: Arnreiter Mühle GmbH, Pfahnl Backmittel GmbH, European Flour Millers, Blattmann Schweiz AG, Einbrunger Mühle Karl Rölkens, Ardent Mills, Bob's Red Mill Natural Foods, Healthy Hildegard, Montana Flour & Grains, The Spelt Company Somerset Ltd.

Spelt Wheat Market

Metric Value
Estimated Value in (2025E) USD 2.1 billion
Forecast Value in (2035F) USD 3.1 billion
Forecast CAGR (2025 to 2035) 4.1%

This reflects a 1.52 times growth at a compound annual growth rate of 4.1%. The market’s evolution is expected to be shaped by rising demand for ancient grain alternatives in bakery products, nutritional supplements, and health-conscious consumer segments, particularly where gluten sensitivity awareness and digestive health benefits are prioritized.

By 2030, the market is likely to reach approximately USD 2.6 billion, accounting for USD 500 million in incremental value over the first half of the decade. The remaining USD 400 million is expected during the second half, suggesting a moderately back-loaded growth pattern. Product substitution for conventional wheat flour and gluten-free alternatives is gaining traction due to spelt’s favorable nutritional profile and digestive compatibility properties.

Companies such as Bob’s Red Mill Natural Foods and Ardent Mills are advancing their competitive positions through investment in organic certification processes and scalable milling technologies. Health-focused procurement models are supporting expansion into artisanal baking, functional food manufacturing, and premium retail segments. Market performance will remain anchored in organic certification standards, nutritional density benchmarks, and supply chain sustainability practices.

The spelt wheat market holds approximately 18% of the ancient grains market, driven by its nutritional superiority over modern wheat varieties and growing consumer awareness of digestive health benefits. It accounts for around 12% of the alternative flour market, supported by its baking versatility and nutty flavor profile that appeals to artisanal food manufacturers.

The market contributes nearly 8% to the organic grain market, particularly for products targeting gluten-sensitive consumers seeking wheat alternatives. It holds close to 6% of the health food ingredients market, where spelt flour is used for premium baking mixes, breakfast cereals, and functional food formulations.

The share in the specialty grain market reaches about 15%, reflecting its preference among health-conscious consumers and professional bakers seeking heritage grain alternatives to conventional wheat in certified organic and biodynamic food production.

The market is undergoing structural change driven by rising demand for nutrient-dense and easily digestible grain alternatives. Advanced processing methods using traditional stone milling and temperature-controlled techniques have enhanced flour quality, nutritional retention, and shelf stability, making spelt a viable premium alternative to conventional wheat flour.

Manufacturers are introducing organic certifications and heritage grain marketing strategies tailored for health food retailers and specialty bakeries, expanding their role beyond basic flour production. Strategic collaborations between organic farmers and specialty food distributors have accelerated adoption in premium food manufacturing.

Direct-to-consumer channels have widened access and awareness, reshaping traditional grain distribution networks and forcing conventional flour suppliers to develop specialty product lines.

Analyzing Spelt Wheat Market by Top Investment Segments

The market is segmented by nature, variety, format, distribution channel, end use, and region. By nature, the market is bifurcated into organic and conventional. Based on variety, the market is divided into whole flour and white spelt flour. Based on format, the market is classified into flour, whole kernels, custom multigrain blends, and cracked. In terms of distribution channel, the market is characterized into direct, indirect, hypermarkets, supermarkets, and retailers.

By end use, the market is divided into the food industry, the feed industry, and other industries. Regionally, the market is analyzed across North America, Latin America, Europe, East Asia, South Asia and Pacific, Oceania, and the Middle East and Africa.
By End Use, the Food Industry Accounts for 62% Market Share

Spelt Wheat Market By End Use

The food industry segment holds a leading 62% share in the end-use category, reflecting spelt wheat’s widespread adoption in bakery products, breakfast cereals, pasta manufacturing, and specialty food production. Food manufacturers increasingly prefer spelt flour due to its superior nutritional density, unique flavor profile, and marketing advantages as an ancient grain alternative.

The segment benefits from rising consumer demand for heritage grains and clean-label products that align with health and wellness trends. Spelt’s versatility in bread production, pastry applications, and breakfast cereal manufacturing has expanded its usage across multiple food categories.

Manufacturers are focusing on developing organic certified spelt-based products and premium positioning strategies, catering to both artisanal food producers and mainstream manufacturers seeking differentiated ingredients. As sustainability regulations strengthen and ancient grain certifications become more prevalent, spelt wheat’s role as a preferred heritage grain ingredient is expected to increase, supporting steady growth in food industry applications.
By Variety, Whole Flour Accounts for 59% of the Market Share

Spelt Wheat Market By Variety

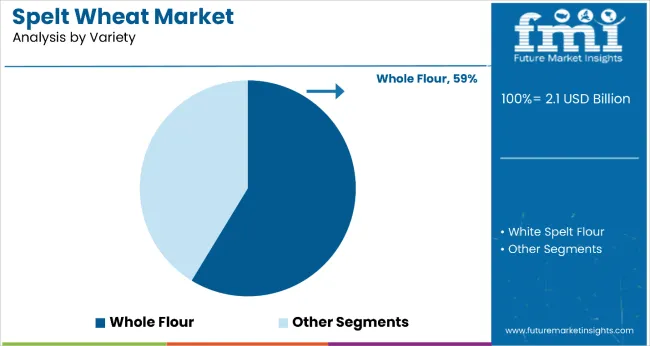
The whole flour segment dominates the variety category with a 59% market share, driven by increasing consumer preference for nutrient-dense flour options that retain the complete nutritional profile of the spelt grain. Whole spelt flour maintains the bran, germ, and endosperm, providing superior fiber content, protein levels, and mineral density compared to refined alternatives.

The product’s health positioning and compatibility with whole grain dietary recommendations further enhance its market appeal. Innovations in stone milling techniques and temperature-controlled processing have improved whole spelt flour quality while maintaining its nutritional integrity.

The segment continues to benefit from rising demand in artisanal bakeries and health food manufacturing, where whole grain content is prioritized. As design preferences evolve toward authentic heritage grain experiences and nutritional transparency, whole spelt flour is expected to maintain strong demand within the broader specialty flour landscape.

Why is the Spelt Wheat Market Growing?

Spelt’s superior nutritional profile, easier digestibility compared to modern wheat, and heritage grain appeal make it an attractive alternative for health-conscious consumers seeking natural food options.

Growing awareness of gluten sensitivity and digestive health issues is further propelling adoption, especially among consumers seeking wheat alternatives that maintain baking functionality. Government support for heritage crop cultivation, along with innovations in organic farming techniques, is also enhancing product availability and quality consistency.

As consumer preferences shift toward ancient grains and artisanal food products, and as awareness of spelt’s nutritional benefits increases in emerging markets, the market outlook remains favorable. With consumers and food manufacturers prioritizing ingredient transparency, digestive wellness, and heritage grain authenticity, spelt wheat is well-positioned to expand across various bakery, breakfast cereal, and functional food applications.

What are the Drivers, Restraints, and Key Trends of the Spelt Wheat Market?

From 2025 to 2035, heritage grain authentication systems were introduced in specialty food retail, improving product traceability, enhancing consumer confidence, and supporting premium pricing strategies. These developments position certification-ready spelt suppliers as key partners for brands seeking verified ancient grain credentials and transparent supply chain documentation.

Ancient Grain Health Positioning Drives Spelt Wheat Adoption

The growing recognition of spelt wheat’s superior nutritional profile and digestive benefits has been identified as the primary catalyst for growth in the spelt wheat market. In 2024, increased consumer awareness of gluten sensitivity and wheat intolerance prompted widespread adoption of spelt flour as a more digestible wheat alternative in artisanal bakeries and health food manufacturing.

By 2025, functional food developers were incorporating spelt-based ingredients into breakfast cereals, energy bars, and nutritional supplements to address consumer demand for ancient grain nutrition. These developments demonstrate that health-focused positioning rather than price competition is driving spelt wheat procurement cycles.

Manufacturers offering certified organic spelt with documented nutritional testing are well-positioned to capture sustained demand from health-conscious consumers and premium food brands.

Heritage Grain Authentication Creates Premium Market Opportunities

In 2024, specialty food retailers began implementing heritage grain authentication systems to verify spelt wheat origin, cultivation methods, and processing standards, leading to improved consumer confidence and premium product positioning. By 2025, artisanal bakeries and organic food manufacturers were adopting certified ancient grain verification programs for spelt-based products, supporting brand differentiation and marketing claims.

These implementations demonstrate that when spelt wheat adopts transparent authentication and traceability systems, consumer trust and premium pricing opportunities are significantly enhanced. Suppliers that offer heritage grain certification, organic verification, and supply chain documentation are positioned to capture growing demand from quality-focused food manufacturers and specialty retail channels seeking authentic ancient grain products.
Analysis of Spelt Wheat Market by Key Countries

Spelt Wheat Market Country Wise Analysis

Country CAGR
USA 4.5%
Germany 4%
France 3.5%
UK 2%
Japan 1%

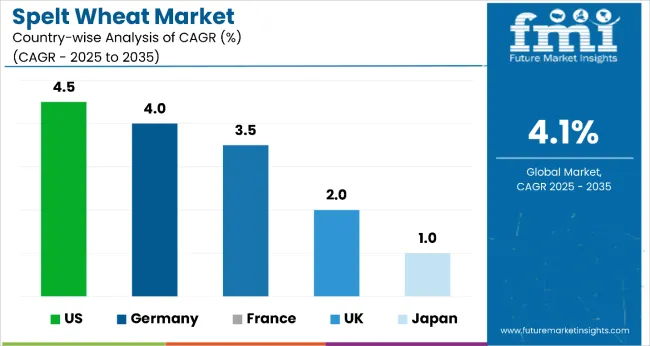
Between 2025 and 2035, the USA is expected to lead the global spelt wheat market with a CAGR of 4.5%, supported by rising consumer demand for organic ancient grains and increased retail penetration across health food sectors. Germany follows with a 4.0% CAGR, reflecting strong domestic production, EU-certified organic cultivation, and widespread artisanal adoption.

France is projected to expand at 3.5%, driven by heritage grain revival and premium bakery formulations. The UK trails with a 2.0% CAGR due to limited domestic output and import reliance, while Japan records the slowest growth at 1.0%, reflecting niche demand and restricted cultivation.

The report covers an in-depth analysis of 40+ countries; five top-performing OECD countries are highlighted below.
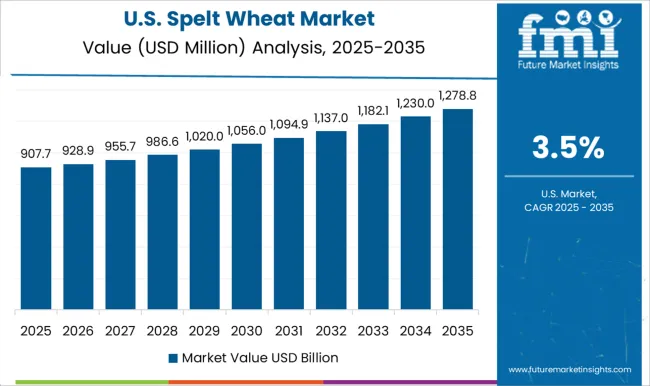
Production Expansion in the Spelt Wheat Market in the United States

The spelt wheat market in the USA is projected to grow at a CAGR of 4.5% from 2025 to 2035, outperforming other major consumer nations. Growth is driven by health-conscious consumer preferences, expanding organic food retail, and rising adoption of ancient grains in premium bakery products.

California, Oregon, and Pennsylvania are primary consumption hubs, while import reliance on Canadian and European organic producers continues to rise. USDA-certified organic spelt flour remains a top choice among specialty bakeries and natural food brands. Demand is also growing in gluten-sensitive consumer segments and artisan breakfast cereal manufacturing.
  • 1.9 million pounds of organic spelt flour consumed in 2024
  • 52% of spelt imports are USDA-certified organic
  • 890+ bakeries using spelt-based formulations in artisanal bread

Market Integration in the Spelt Wheat Sector in Germany

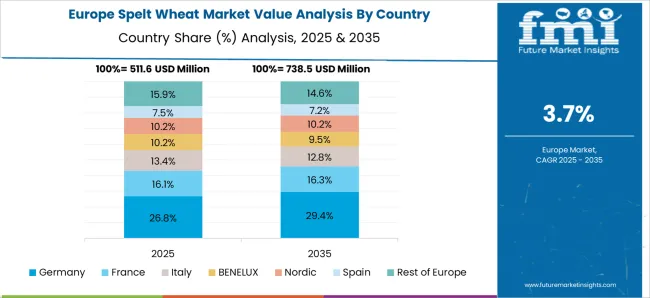
The sales of spelt wheat in Germany are expected to expand at a CAGR of 4.0% from 2025 to 2035, supported by deep-rooted traditional use and strong organic certification practices. Southern regions such as Bavaria and Baden-Württemberg lead both cultivation and processing, aided by EU subsidies for heritage grains.

Organic spelt dominates due to consumer preference for clean-label ingredients and traceable farming practices. Stone milling techniques and artisanal product positioning support domestic and export markets, especially across Central and Northern Europe.

  • 2.1 million hectares of certified organic cultivation in 2024
  • 87 traditional mills processing heritage spelt grain
  • 74% of production certified under EU organic regulations

Consumption Patterns in the Spelt Wheat Market in France

The revenue from spelt wheat in France is expected to grow at a CAGR of 3.5% from 2025 to 2035, driven by consumer interest in ancient grains and regional culinary traditions. Production clusters in the Rhône-Alpes and Provence regions supply artisanal bakeries and gourmet flour producers.

Government programs promoting agricultural biodiversity have supported the expansion of spelt cultivation. French bakers incorporate spelt into AOC-certified bread formulations, with organic variants favored in export products targeting premium bakery chains in Belgium and Switzerland.

  • 1.8 million hectares under traditional spelt cultivation in 2024
  • 34% YoY growth in bakery-grade spelt flour demand
  • 1,420 preservation projects supporting spelt varieties

Application Development in the Spelt Wheat Market in the United Kingdom

The spelt wheat market in the UK is projected to grow at a CAGR of 2.0% from 2025 to 2035, lagging behind continental Europe due to smaller cultivation areas and import reliance. Regional production is concentrated in East Anglia and Yorkshire.

Demand is led by artisanal bakeries and health food retailers focusing on ancient grains for gluten-sensitive consumers. Imports from Germany and France are vital to meet processing volumes. Product formulation centers around clean-label bread and pastries, with spelt increasingly adopted in gluten-reduced mixes.

  • 560,000 pounds of spelt flour distributed in 2024
  • 41% of imported spelt processed into organic flour
  • 1,180 bakeries using spelt in specialty bread

Limited Growth in the Spelt Wheat Market in Japan

The demand for spelt wheat in Japan is forecast to grow at a modest CAGR of 1.0% from 2025 to 2035, reflecting niche but emerging interest in ancient grains among urban health-conscious consumers. Domestic cultivation remains limited due to climatic constraints, with the majority of spelt flour imported from European suppliers.

Premium health food retailers and organic bakeries in Tokyo and Osaka drive market demand. Spelt is mostly incorporated into functional food products and luxury bakery items, though it remains a specialty grain in the broader Japanese diet.
  • USD 2.3 million estimated market value in 2025
  • 85% of spelt flour is imported from Germany and France
  • 120+ bakeries developing spelt-based premium SKUs

Competitive Landscape of Spelt Wheat Market

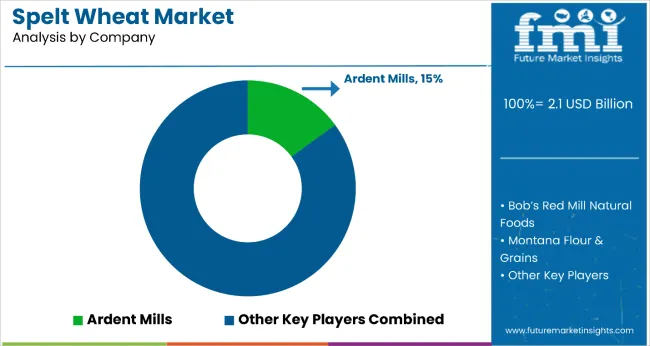
Spelt Wheat Market By Company

The spelt wheat market is moderately fragmented, featuring a mix of regional specialty grain processors and international organic food suppliers with varying degrees of heritage grain expertise and distribution capabilities. Bob’s Red Mill Natural Foods and Ardent Mills lead the North American specialty flour segment, supplying premium spelt products for health food retailers and artisanal bakeries. Their strength lies in organic certification standards and established relationships with natural food distributors.

Arnreiter Mühle GmbH and Pfahnl Backmittel GmbH differentiate through traditional European milling techniques, including stone grinding and temperature-controlled processing that preserves nutritional integrity and authentic flavor profiles for premium bakery applications. European Flour Millers and Blattmann Schweiz AG focus on certified organic spelt production and heritage grain authentication, addressing the growing demand for traceable ancient grain ingredients in specialty food manufacturing.

Regional players such as Montana Flour & Grains, Healthy Hildegard, and The Spelt Company Somerset Ltd dominate local cultivation and specialty processing in their respective markets, ensuring supply chain control and regional market penetration for artisanal food producers. Meanwhile, Einbrunger Mühle Karl Rölkens emphasizes traditional German milling standards and organic certification, creating value in heritage grain authenticity and premium positioning.

Entry barriers remain significant, driven by challenges in organic certification requirements, heritage grain authentication, and compliance with specialty food standards across multiple markets. Competitiveness increasingly depends on organic farming partnerships, traditional processing capabilities, and supply chain transparency for health-focused food manufacturers and premium retail environments.

Key Developments in Spelt Wheat Market

Ardent Mills released its FY24 ESG report highlighting key milestones such as the launch of innovative plant-based solutions, advances in sustainable farming practices, and ongoing efforts to support inclusion and employee well-being. These developments reinforce the company’s commitment to responsible ingredient sourcing and growth in specialty grains like spelt wheat.

Scope of the Report

Item Value
Quantitative Units USD 2.1 Billion
Nature Organic and Conventional
Variety Whole Flour and White Spelt Flour
Format Flour, Whole Kernels, Custom Multigrain Blends, and Cracked
Distribution Channel Direct, Indirect, Hypermarkets, Supermarkets, and Retailers
End Use Food Industry, Feed Industry, and Other Industrial
Regions Covered North America, Europe, Asia-Pacific, Latin America, Middle East & Africa
Country Covered United States, Canada, United Kingdom, Germany, France, China, Japan, South Korea, Brazil, Australia, and 40+ countries
Key Companies Profiled Arnreiter Mühle GmbH, Pfahnl Backmittel GmbH, European Flour Millers, Blattmann Schweiz AG, Einbrunger Mühle Karl Rölkens, Ardent Mills, Bob’s Red Mill Natural Foods, Healthy Hildegard, Montana Flour & Grains, The Spelt Company Somerset Ltd.
Additional Attributes Dollar sales by nature and end-use sector, growing usage in organic food manufacturing and artisanal bakery applications for health-conscious consumers, stable demand in heritage grain and specialty flour markets, innovations in stone milling and organic certification improve product quality, nutritional retention, and market positioning

Key Segments

By Nature:

  • Organic
  • Conventional

By Variety:

  • Whole Flour
  • White Spelt Flour

By Format:

  • Flour
  • Whole Kernels
  • Custom Multigrain Blends
  • Cracked

By Distribution Channel:

  • Direct
  • Indirect
  • Hypermarkets
  • Supermarkets
  • Retailers

By End Use:

  • Food Industry
  • Feed Industry
  • Other Industrial

By Region:

  • North America
  • Latin America
  • Western Europe
  • Eastern Europe
  • East Asia
  • South Asia & Pacific
  • Middle East and Africa

Table of Content

  1. Executive Summary
    • Global Market Outlook
    • Demand-side Trends
    • Supply-side Trends
    • Technology Roadmap Analysis
    • Analysis and Recommendations
  2. Market Overview
    • Market Coverage / Taxonomy
    • Market Definition / Scope / Limitations
  3. Market Background
    • Market Dynamics
      • Drivers
      • Restraints
      • Opportunity
      • Trends
    • Scenario Forecast
      • Demand in Optimistic Scenario
      • Demand in Likely Scenario
      • Demand in Conservative Scenario
    • Opportunity Map Analysis
    • Product Life Cycle Analysis
    • Supply Chain Analysis
      • Supply Side Participants and their Roles
        • Producers
        • Mid-Level Participants (Traders/ Agents/ Brokers)
        • Wholesalers and Distributors
      • Value Added and Value Created at Node in the Supply Chain
      • List of Raw Material Suppliers
      • List of Existing and Potential Buyer’s
    • Investment Feasibility Matrix
    • Value Chain Analysis
      • Profit Margin Analysis
      • Wholesalers and Distributors
      • Retailers
    • PESTLE and Porter’s Analysis
    • Regulatory Landscape
      • By Key Regions
      • By Key Countries
    • Regional Parent Market Outlook
    • Production and Consumption Statistics
    • Import and Export Statistics
  4. Global Market Analysis 2020 to 2024 and Forecast, 2025 to 2035
    • Historical Market Size Value (USD Billion) & Volume (Metric Tons) Analysis, 2020 to 2024
    • Current and Future Market Size Value (USD Billion) & Volume (Metric Tons) Projections, 2025 to 2035
      • Y-o-Y Growth Trend Analysis
      • Absolute $ Opportunity Analysis
  5. Global Market Pricing Analysis 2020 to 2024 and Forecast 2025 to 2035
  6. Global Market Analysis 2020 to 2024 and Forecast 2025 to 2035, By Nature
    • Introduction / Key Findings
    • Historical Market Size Value (USD Billion) & Volume (Metric Tons) Analysis By Nature, 2020 to 2024
    • Current and Future Market Size Value (USD Billion) & Volume (Metric Tons) Analysis and Forecast By Nature, 2025 to 2035
      • Organic
      • Conventional
    • Y-o-Y Growth Trend Analysis By Nature, 2020 to 2024
    • Absolute $ Opportunity Analysis By Nature, 2025 to 2035
  7. Global Market Analysis 2020 to 2024 and Forecast 2025 to 2035, By Variety
    • Introduction / Key Findings
    • Historical Market Size Value (USD Billion) & Volume (Metric Tons) Analysis By Variety, 2020 to 2024
    • Current and Future Market Size Value (USD Billion) & Volume (Metric Tons) Analysis and Forecast By Variety, 2025 to 2035
      • Whole Flour
      • White Spelt Flour
    • Y-o-Y Growth Trend Analysis By Variety, 2020 to 2024
    • Absolute $ Opportunity Analysis By Variety, 2025 to 2035
  8. Global Market Analysis 2020 to 2024 and Forecast 2025 to 2035, By Format
    • Introduction / Key Findings
    • Historical Market Size Value (USD Billion) & Volume (Metric Tons) Analysis By Format, 2020 to 2024
    • Current and Future Market Size Value (USD Billion) & Volume (Metric Tons) Analysis and Forecast By Format, 2025 to 2035
      • Flour
      • Whole Kernels
      • Custom Multigrain Blends
      • Cracked
    • Y-o-Y Growth Trend Analysis By Format, 2020 to 2024
    • Absolute $ Opportunity Analysis By Format, 2025 to 2035
  9. Global Market Analysis 2020 to 2024 and Forecast 2025 to 2035, By Distribution Channel
    • Introduction / Key Findings
    • Historical Market Size Value (USD Billion) & Volume (Metric Tons) Analysis By Distribution Channel, 2020 to 2024
    • Current and Future Market Size Value (USD Billion) & Volume (Metric Tons) Analysis and Forecast By Distribution Channel, 2025 to 2035
      • Direct
      • Indirect
      • Hypermarkets
      • Supermarkets
      • Retailers
    • Y-o-Y Growth Trend Analysis By Distribution Channel, 2020 to 2024
    • Absolute $ Opportunity Analysis By Distribution Channel, 2025 to 2035
  10. Global Market Analysis 2020 to 2024 and Forecast 2025 to 2035, By End Use
    • Introduction / Key Findings
    • Historical Market Size Value (USD Billion) & Volume (Metric Tons) Analysis By End Use, 2020 to 2024
    • Current and Future Market Size Value (USD Billion) & Volume (Metric Tons) Analysis and Forecast By End Use, 2025 to 2035
      • Food Industry
      • Feed Industry
      • Other Industrial
    • Y-o-Y Growth Trend Analysis By End Use, 2020 to 2024
    • Absolute $ Opportunity Analysis By End Use, 2025 to 2035
  11. Global Market Analysis 2020 to 2024 and Forecast 2025 to 2035, By Region
    • Introduction
    • Historical Market Size Value (USD Billion) & Volume (Metric Tons) Analysis By Region, 2020 to 2024
    • Current Market Size Value (USD Billion) & Volume (Metric Tons) Analysis and Forecast By Region, 2025 to 2035
      • North America
      • Latin America
      • Western Europe
      • Eastern Europe
      • East Asia
      • South Asia & Pacific
      • Middle East and Africa
    • Market Attractiveness Analysis By Region
  12. North America Market Analysis 2020 to 2024 and Forecast 2025 to 2035, By Country
    • Historical Market Size Value (USD Billion) & Volume (Metric Tons) Trend Analysis By Market Taxonomy, 2020 to 2024
    • Market Size Value (USD Billion) & Volume (Metric Tons) Forecast By Market Taxonomy, 2025 to 2035
      • By Country
        • USA
        • Canada
        • Mexico
      • By Nature
      • By Variety
      • By Format
      • By Distribution Channel
      • By End Use
    • Market Attractiveness Analysis
      • By Country
      • By Nature
      • By Variety
      • By Format
      • By Distribution Channel
      • By End Use
    • Key Takeaways
  13. Latin America Market Analysis 2020 to 2024 and Forecast 2025 to 2035, By Country
    • Historical Market Size Value (USD Billion) & Volume (Metric Tons) Trend Analysis By Market Taxonomy, 2020 to 2024
    • Market Size Value (USD Billion) & Volume (Metric Tons) Forecast By Market Taxonomy, 2025 to 2035
      • By Country
        • Brazil
        • Argentina
        • Rest of LATAM
      • By Nature
      • By Variety
      • By Format
      • By Distribution Channel
      • By End Use
    • Market Attractiveness Analysis
      • By Country
      • By Nature
      • By Variety
      • By Format
      • By Distribution Channel
      • By End Use
    • Key Takeaways
  14. Western Europe Market Analysis 2020 to 2024 and Forecast 2025 to 2035, By Country
    • Historical Market Size Value (USD Billion) & Volume (Metric Tons) Trend Analysis By Market Taxonomy, 2020 to 2024
    • Market Size Value (USD Billion) & Volume (Metric Tons) Forecast By Market Taxonomy, 2025 to 2035
      • By Country
        • Germany
        • Italy
        • France
        • UK
        • Spain
        • BENELUX
        • Nordic
        • Rest of W.Europe
      • By Nature
      • By Variety
      • By Format
      • By Distribution Channel
      • By End Use
    • Market Attractiveness Analysis
      • By Country
      • By Nature
      • By Variety
      • By Format
      • By Distribution Channel
      • By End Use
    • Key Takeaways
  15. Eastern Europe Market Analysis 2020 to 2024 and Forecast 2025 to 2035, By Country
    • Historical Market Size Value (USD Billion) & Volume (Metric Tons) Trend Analysis By Market Taxonomy, 2020 to 2024
    • Market Size Value (USD Billion) & Volume (Metric Tons) Forecast By Market Taxonomy, 2025 to 2035
      • By Country
        • Russia
        • Hungary
        • Poland
        • Balkan & Baltics
        • Rest of E. Europe
      • By Nature
      • By Variety
      • By Format
      • By Distribution Channel
      • By End Use
    • Market Attractiveness Analysis
      • By Country
      • By Nature
      • By Variety
      • By Format
      • By Distribution Channel
      • By End Use
    • Key Takeaways
  16. East Asia Market Analysis 2020 to 2024 and Forecast 2025 to 2035, By Country
    • Historical Market Size Value (USD Billion) & Volume (Metric Tons) Trend Analysis By Market Taxonomy, 2020 to 2024
    • Market Size Value (USD Billion) & Volume (Metric Tons) Forecast By Market Taxonomy, 2025 to 2035
      • By Country
        • China
        • Japan
        • South Korea
      • By Nature
      • By Variety
      • By Format
      • By Distribution Channel
      • By End Use
    • Market Attractiveness Analysis
      • By Country
      • By Nature
      • By Variety
      • By Format
      • By Distribution Channel
      • By End Use
    • Key Takeaways
  17. South Asia & Pacific Market Analysis 2020 to 2024 and Forecast 2025 to 2035, By Country
    • Historical Market Size Value (USD Billion) & Volume (Metric Tons) Trend Analysis By Market Taxonomy, 2020 to 2024
    • Market Size Value (USD Billion) & Volume (Metric Tons) Forecast By Market Taxonomy, 2025 to 2035
      • By Country
        • India
        • Australia & New Zealand
        • ASEAN
        • Rest of SAP
      • By Nature
      • By Variety
      • By Format
      • By Distribution Channel
      • By End Use
    • Market Attractiveness Analysis
      • By Country
      • By Nature
      • By Variety
      • By Format
      • By Distribution Channel
      • By End Use
    • Key Takeaways
  18. Middle East and Africa Market Analysis 2020 to 2024 and Forecast 2025 to 2035, By Country
    • Historical Market Size Value (USD Billion) & Volume (Metric Tons) Trend Analysis By Market Taxonomy, 2020 to 2024
    • Market Size Value (USD Billion) & Volume (Metric Tons) Forecast By Market Taxonomy, 2025 to 2035
      • By Country
        • GCC Countries
        • Northern Africa
        • South Africa
        • Turkiye
        • Rest of MEA
      • By Nature
      • By Variety
      • By Format
      • By Distribution Channel
      • By End Use
    • Market Attractiveness Analysis
      • By Country
      • By Nature
      • By Variety
      • By Format
      • By Distribution Channel
      • By End Use
    • Key Takeaways
  19. Key Countries Market Analysis
    • USA
      • Pricing Analysis
      • Market Share Analysis, 2024
        • By Nature
        • By Variety
        • By Format
        • By Distribution Channel
        • By End Use
    • Canada
      • Pricing Analysis
      • Market Share Analysis, 2024
        • By Nature
        • By Variety
        • By Format
        • By Distribution Channel
        • By End Use
    • Brazil
      • Pricing Analysis
      • Market Share Analysis, 2024
        • By Nature
        • By Variety
        • By Format
        • By Distribution Channel
        • By End Use
    • Mexico
      • Pricing Analysis
      • Market Share Analysis, 2024
        • By Nature
        • By Variety
        • By Format
        • By Distribution Channel
        • By End Use
    • Argentina
      • Pricing Analysis
      • Market Share Analysis, 2024
        • By Nature
        • By Variety
        • By Format
        • By Distribution Channel
        • By End Use
  20. Market Structure Analysis
    • Competition Dashboard
    • Competition Benchmarking
    • Market Share Analysis of Top Players
      • By Regional
      • By Nature
      • By Variety
      • By Format
      • By Distribution Channel
      • By End Use
  21. Competition Analysis
    • Competition Deep Dive
      • Arnreiter Mühle GmbH
        • Overview
        • Product Portfolio
        • Profitability by Market Segments (Product/Age /Sales Channel/Region)
        • Sales Footprint
        • Strategy Overview
          • Marketing Strategy
          • Product Strategy
          • Channel Strategy
      • Pfahnl Backmittel GmbH
        • Overview
        • Product Portfolio
        • Profitability by Market Segments (Product/Age /Sales Channel/Region)
        • Sales Footprint
        • Strategy Overview
          • Marketing Strategy
          • Product Strategy
          • Channel Strategy
      • European Flour Millers
        • Overview
        • Product Portfolio
        • Profitability by Market Segments (Product/Age /Sales Channel/Region)
        • Sales Footprint
        • Strategy Overview
          • Marketing Strategy
          • Product Strategy
          • Channel Strategy
      • Blattmann Schweiz AG
        • Overview
        • Product Portfolio
        • Profitability by Market Segments (Product/Age /Sales Channel/Region)
        • Sales Footprint
        • Strategy Overview
          • Marketing Strategy
          • Product Strategy
          • Channel Strategy
      • Einbrunger Mühle Karl Rölkens
        • Overview
        • Product Portfolio
        • Profitability by Market Segments (Product/Age /Sales Channel/Region)
        • Sales Footprint
        • Strategy Overview
          • Marketing Strategy
          • Product Strategy
          • Channel Strategy
      • Ardent Mills
        • Overview
        • Product Portfolio
        • Profitability by Market Segments (Product/Age /Sales Channel/Region)
        • Sales Footprint
        • Strategy Overview
          • Marketing Strategy
          • Product Strategy
          • Channel Strategy
      • Bob’s Red Mill Natural Foods
        • Overview
        • Product Portfolio
        • Profitability by Market Segments (Product/Age /Sales Channel/Region)
        • Sales Footprint
        • Strategy Overview
          • Marketing Strategy
          • Product Strategy
          • Channel Strategy
      • Healthy Hildegard
        • Overview
        • Product Portfolio
        • Profitability by Market Segments (Product/Age /Sales Channel/Region)
        • Sales Footprint
        • Strategy Overview
          • Marketing Strategy
          • Product Strategy
          • Channel Strategy
      • Montana Flour & Grains
        • Overview
        • Product Portfolio
        • Profitability by Market Segments (Product/Age /Sales Channel/Region)
        • Sales Footprint
        • Strategy Overview
          • Marketing Strategy
          • Product Strategy
          • Channel Strategy
      • The Spelt Company Somerset Ltd
        • Overview
        • Product Portfolio
        • Profitability by Market Segments (Product/Age /Sales Channel/Region)
        • Sales Footprint
        • Strategy Overview
          • Marketing Strategy
          • Product Strategy
          • Channel Strategy
  22. Assumptions & Acronyms Used
  23. Research Methodology

List of Tables

  • Table 1: Global Market Value (USD Billion) Forecast by Region, 2020-2035
  • Table 2: Global Market Volume (Metric Tons) Forecast by Region, 2020-2035
  • Table 3: Global Market Value (USD Billion) Forecast by Nature, 2020-2035
  • Table 4: Global Market Volume (Metric Tons) Forecast by Nature, 2020-2035
  • Table 5: Global Market Value (USD Billion) Forecast by Variety, 2020-2035
  • Table 6: Global Market Volume (Metric Tons) Forecast by Variety, 2020-2035
  • Table 7: Global Market Value (USD Billion) Forecast by Format, 2020-2035
  • Table 8: Global Market Volume (Metric Tons) Forecast by Format, 2020-2035
  • Table 9: Global Market Value (USD Billion) Forecast by Distribution Channel, 2020-2035
  • Table 10: Global Market Volume (Metric Tons) Forecast by Distribution Channel, 2020-2035
  • Table 11: Global Market Value (USD Billion) Forecast by End Use, 2020-2035
  • Table 12: Global Market Volume (Metric Tons) Forecast by End Use, 2020-2035
  • Table 13: North America Market Value (USD Billion) Forecast by Country, 2020-2035
  • Table 14: North America Market Volume (Metric Tons) Forecast by Country, 2020-2035
  • Table 15: North America Market Value (USD Billion) Forecast by Nature, 2020-2035
  • Table 16: North America Market Volume (Metric Tons) Forecast by Nature, 2020-2035
  • Table 17: North America Market Value (USD Billion) Forecast by Variety, 2020-2035
  • Table 18: North America Market Volume (Metric Tons) Forecast by Variety, 2020-2035
  • Table 19: North America Market Value (USD Billion) Forecast by Format, 2020-2035
  • Table 20: North America Market Volume (Metric Tons) Forecast by Format, 2020-2035
  • Table 21: North America Market Value (USD Billion) Forecast by Distribution Channel, 2020-2035
  • Table 22: North America Market Volume (Metric Tons) Forecast by Distribution Channel, 2020-2035
  • Table 23: North America Market Value (USD Billion) Forecast by End Use, 2020-2035
  • Table 24: North America Market Volume (Metric Tons) Forecast by End Use, 2020-2035
  • Table 25: Latin America Market Value (USD Billion) Forecast by Country, 2020-2035
  • Table 26: Latin America Market Volume (Metric Tons) Forecast by Country, 2020-2035
  • Table 27: Latin America Market Value (USD Billion) Forecast by Nature, 2020-2035
  • Table 28: Latin America Market Volume (Metric Tons) Forecast by Nature, 2020-2035
  • Table 29: Latin America Market Value (USD Billion) Forecast by Variety, 2020-2035
  • Table 30: Latin America Market Volume (Metric Tons) Forecast by Variety, 2020-2035
  • Table 31: Latin America Market Value (USD Billion) Forecast by Format, 2020-2035
  • Table 32: Latin America Market Volume (Metric Tons) Forecast by Format, 2020-2035
  • Table 33: Latin America Market Value (USD Billion) Forecast by Distribution Channel, 2020-2035
  • Table 34: Latin America Market Volume (Metric Tons) Forecast by Distribution Channel, 2020-2035
  • Table 35: Latin America Market Value (USD Billion) Forecast by End Use, 2020-2035
  • Table 36: Latin America Market Volume (Metric Tons) Forecast by End Use, 2020-2035
  • Table 37: Western Europe Market Value (USD Billion) Forecast by Country, 2020-2035
  • Table 38: Western Europe Market Volume (Metric Tons) Forecast by Country, 2020-2035
  • Table 39: Western Europe Market Value (USD Billion) Forecast by Nature, 2020-2035
  • Table 40: Western Europe Market Volume (Metric Tons) Forecast by Nature, 2020-2035
  • Table 41: Western Europe Market Value (USD Billion) Forecast by Variety, 2020-2035
  • Table 42: Western Europe Market Volume (Metric Tons) Forecast by Variety, 2020-2035
  • Table 43: Western Europe Market Value (USD Billion) Forecast by Format, 2020-2035
  • Table 44: Western Europe Market Volume (Metric Tons) Forecast by Format, 2020-2035
  • Table 45: Western Europe Market Value (USD Billion) Forecast by Distribution Channel, 2020-2035
  • Table 46: Western Europe Market Volume (Metric Tons) Forecast by Distribution Channel, 2020-2035
  • Table 47: Western Europe Market Value (USD Billion) Forecast by End Use, 2020-2035
  • Table 48: Western Europe Market Volume (Metric Tons) Forecast by End Use, 2020-2035
  • Table 49: Eastern Europe Market Value (USD Billion) Forecast by Country, 2020-2035
  • Table 50: Eastern Europe Market Volume (Metric Tons) Forecast by Country, 2020-2035
  • Table 51: Eastern Europe Market Value (USD Billion) Forecast by Nature, 2020-2035
  • Table 52: Eastern Europe Market Volume (Metric Tons) Forecast by Nature, 2020-2035
  • Table 53: Eastern Europe Market Value (USD Billion) Forecast by Variety, 2020-2035
  • Table 54: Eastern Europe Market Volume (Metric Tons) Forecast by Variety, 2020-2035
  • Table 55: Eastern Europe Market Value (USD Billion) Forecast by Format, 2020-2035
  • Table 56: Eastern Europe Market Volume (Metric Tons) Forecast by Format, 2020-2035
  • Table 57: Eastern Europe Market Value (USD Billion) Forecast by Distribution Channel, 2020-2035
  • Table 58: Eastern Europe Market Volume (Metric Tons) Forecast by Distribution Channel, 2020-2035
  • Table 59: Eastern Europe Market Value (USD Billion) Forecast by End Use, 2020-2035
  • Table 60: Eastern Europe Market Volume (Metric Tons) Forecast by End Use, 2020-2035
  • Table 61: East Asia Market Value (USD Billion) Forecast by Country, 2020-2035
  • Table 62: East Asia Market Volume (Metric Tons) Forecast by Country, 2020-2035
  • Table 63: East Asia Market Value (USD Billion) Forecast by Nature, 2020-2035
  • Table 64: East Asia Market Volume (Metric Tons) Forecast by Nature, 2020-2035
  • Table 65: East Asia Market Value (USD Billion) Forecast by Variety, 2020-2035
  • Table 66: East Asia Market Volume (Metric Tons) Forecast by Variety, 2020-2035
  • Table 67: East Asia Market Value (USD Billion) Forecast by Format, 2020-2035
  • Table 68: East Asia Market Volume (Metric Tons) Forecast by Format, 2020-2035
  • Table 69: East Asia Market Value (USD Billion) Forecast by Distribution Channel, 2020-2035
  • Table 70: East Asia Market Volume (Metric Tons) Forecast by Distribution Channel, 2020-2035
  • Table 71: East Asia Market Value (USD Billion) Forecast by End Use, 2020-2035
  • Table 72: East Asia Market Volume (Metric Tons) Forecast by End Use, 2020-2035
  • Table 73: South Asia & Pacific Market Value (USD Billion) Forecast by Country, 2020-2035
  • Table 74: South Asia & Pacific Market Volume (Metric Tons) Forecast by Country, 2020-2035
  • Table 75: South Asia & Pacific Market Value (USD Billion) Forecast by Nature, 2020-2035
  • Table 76: South Asia & Pacific Market Volume (Metric Tons) Forecast by Nature, 2020-2035
  • Table 77: South Asia & Pacific Market Value (USD Billion) Forecast by Variety, 2020-2035
  • Table 78: South Asia & Pacific Market Volume (Metric Tons) Forecast by Variety, 2020-2035
  • Table 79: South Asia & Pacific Market Value (USD Billion) Forecast by Format, 2020-2035
  • Table 80: South Asia & Pacific Market Volume (Metric Tons) Forecast by Format, 2020-2035
  • Table 81: South Asia & Pacific Market Value (USD Billion) Forecast by Distribution Channel, 2020-2035
  • Table 82: South Asia & Pacific Market Volume (Metric Tons) Forecast by Distribution Channel, 2020-2035
  • Table 83: South Asia & Pacific Market Value (USD Billion) Forecast by End Use, 2020-2035
  • Table 84: South Asia & Pacific Market Volume (Metric Tons) Forecast by End Use, 2020-2035
  • Table 85: Middle East and Africa Market Value (USD Billion) Forecast by Country, 2020-2035
  • Table 86: Middle East and Africa Market Volume (Metric Tons) Forecast by Country, 2020-2035
  • Table 87: Middle East and Africa Market Value (USD Billion) Forecast by Nature, 2020-2035
  • Table 88: Middle East and Africa Market Volume (Metric Tons) Forecast by Nature, 2020-2035
  • Table 89: Middle East and Africa Market Value (USD Billion) Forecast by Variety, 2020-2035
  • Table 90: Middle East and Africa Market Volume (Metric Tons) Forecast by Variety, 2020-2035
  • Table 91: Middle East and Africa Market Value (USD Billion) Forecast by Format, 2020-2035
  • Table 92: Middle East and Africa Market Volume (Metric Tons) Forecast by Format, 2020-2035
  • Table 93: Middle East and Africa Market Value (USD Billion) Forecast by Distribution Channel, 2020-2035
  • Table 94: Middle East and Africa Market Volume (Metric Tons) Forecast by Distribution Channel, 2020-2035
  • Table 95: Middle East and Africa Market Value (USD Billion) Forecast by End Use, 2020-2035
  • Table 96: Middle East and Africa Market Volume (Metric Tons) Forecast by End Use, 2020-2035

List of Figures

  • Figure 1: Global Market Volume (Metric Tons) Forecast 2020-2035
  • Figure 2: Global Market Pricing Analysis
  • Figure 3: Global Market Value (USD Billion) Forecast 2020-2035
  • Figure 4: Global Market Value Share and BPS Analysis by Nature, 2025 and 2035
  • Figure 5: Global Market Y-o-Y Growth Comparison by Nature, 2025-2035
  • Figure 6: Global Market Attractiveness Analysis by Nature
  • Figure 7: Global Market Value Share and BPS Analysis by Variety, 2025 and 2035
  • Figure 8: Global Market Y-o-Y Growth Comparison by Variety, 2025-2035
  • Figure 9: Global Market Attractiveness Analysis by Variety
  • Figure 10: Global Market Value Share and BPS Analysis by Format, 2025 and 2035
  • Figure 11: Global Market Y-o-Y Growth Comparison by Format, 2025-2035
  • Figure 12: Global Market Attractiveness Analysis by Format
  • Figure 13: Global Market Value Share and BPS Analysis by Distribution Channel, 2025 and 2035
  • Figure 14: Global Market Y-o-Y Growth Comparison by Distribution Channel, 2025-2035
  • Figure 15: Global Market Attractiveness Analysis by Distribution Channel
  • Figure 16: Global Market Value Share and BPS Analysis by End Use, 2025 and 2035
  • Figure 17: Global Market Y-o-Y Growth Comparison by End Use, 2025-2035
  • Figure 18: Global Market Attractiveness Analysis by End Use
  • Figure 19: Global Market Value (USD Billion) Share and BPS Analysis by Region, 2025 and 2035
  • Figure 20: Global Market Y-o-Y Growth Comparison by Region, 2025-2035
  • Figure 21: Global Market Attractiveness Analysis by Region
  • Figure 22: North America Market Incremental $ Opportunity, 2025-2035
  • Figure 23: Latin America Market Incremental $ Opportunity, 2025-2035
  • Figure 24: Western Europe Market Incremental $ Opportunity, 2025-2035
  • Figure 25: Eastern Europe Market Incremental $ Opportunity, 2025-2035
  • Figure 26: East Asia Market Incremental $ Opportunity, 2025-2035
  • Figure 27: South Asia & Pacific Market Incremental $ Opportunity, 2025-2035
  • Figure 28: Middle East and Africa Market Incremental $ Opportunity, 2025-2035
  • Figure 29: North America Market Value Share and BPS Analysis by Country, 2025 and 2035
  • Figure 30: North America Market Value Share and BPS Analysis by Nature, 2025 and 2035
  • Figure 31: North America Market Y-o-Y Growth Comparison by Nature, 2025-2035
  • Figure 32: North America Market Attractiveness Analysis by Nature
  • Figure 33: North America Market Value Share and BPS Analysis by Variety, 2025 and 2035
  • Figure 34: North America Market Y-o-Y Growth Comparison by Variety, 2025-2035
  • Figure 35: North America Market Attractiveness Analysis by Variety
  • Figure 36: North America Market Value Share and BPS Analysis by Format, 2025 and 2035
  • Figure 37: North America Market Y-o-Y Growth Comparison by Format, 2025-2035
  • Figure 38: North America Market Attractiveness Analysis by Format
  • Figure 39: North America Market Value Share and BPS Analysis by Distribution Channel, 2025 and 2035
  • Figure 40: North America Market Y-o-Y Growth Comparison by Distribution Channel, 2025-2035
  • Figure 41: North America Market Attractiveness Analysis by Distribution Channel
  • Figure 42: North America Market Value Share and BPS Analysis by End Use, 2025 and 2035
  • Figure 43: North America Market Y-o-Y Growth Comparison by End Use, 2025-2035
  • Figure 44: North America Market Attractiveness Analysis by End Use
  • Figure 45: Latin America Market Value Share and BPS Analysis by Country, 2025 and 2035
  • Figure 46: Latin America Market Value Share and BPS Analysis by Nature, 2025 and 2035
  • Figure 47: Latin America Market Y-o-Y Growth Comparison by Nature, 2025-2035
  • Figure 48: Latin America Market Attractiveness Analysis by Nature
  • Figure 49: Latin America Market Value Share and BPS Analysis by Variety, 2025 and 2035
  • Figure 50: Latin America Market Y-o-Y Growth Comparison by Variety, 2025-2035
  • Figure 51: Latin America Market Attractiveness Analysis by Variety
  • Figure 52: Latin America Market Value Share and BPS Analysis by Format, 2025 and 2035
  • Figure 53: Latin America Market Y-o-Y Growth Comparison by Format, 2025-2035
  • Figure 54: Latin America Market Attractiveness Analysis by Format
  • Figure 55: Latin America Market Value Share and BPS Analysis by Distribution Channel, 2025 and 2035
  • Figure 56: Latin America Market Y-o-Y Growth Comparison by Distribution Channel, 2025-2035
  • Figure 57: Latin America Market Attractiveness Analysis by Distribution Channel
  • Figure 58: Latin America Market Value Share and BPS Analysis by End Use, 2025 and 2035
  • Figure 59: Latin America Market Y-o-Y Growth Comparison by End Use, 2025-2035
  • Figure 60: Latin America Market Attractiveness Analysis by End Use
  • Figure 61: Western Europe Market Value Share and BPS Analysis by Country, 2025 and 2035
  • Figure 62: Western Europe Market Value Share and BPS Analysis by Nature, 2025 and 2035
  • Figure 63: Western Europe Market Y-o-Y Growth Comparison by Nature, 2025-2035
  • Figure 64: Western Europe Market Attractiveness Analysis by Nature
  • Figure 65: Western Europe Market Value Share and BPS Analysis by Variety, 2025 and 2035
  • Figure 66: Western Europe Market Y-o-Y Growth Comparison by Variety, 2025-2035
  • Figure 67: Western Europe Market Attractiveness Analysis by Variety
  • Figure 68: Western Europe Market Value Share and BPS Analysis by Format, 2025 and 2035
  • Figure 69: Western Europe Market Y-o-Y Growth Comparison by Format, 2025-2035
  • Figure 70: Western Europe Market Attractiveness Analysis by Format
  • Figure 71: Western Europe Market Value Share and BPS Analysis by Distribution Channel, 2025 and 2035
  • Figure 72: Western Europe Market Y-o-Y Growth Comparison by Distribution Channel, 2025-2035
  • Figure 73: Western Europe Market Attractiveness Analysis by Distribution Channel
  • Figure 74: Western Europe Market Value Share and BPS Analysis by End Use, 2025 and 2035
  • Figure 75: Western Europe Market Y-o-Y Growth Comparison by End Use, 2025-2035
  • Figure 76: Western Europe Market Attractiveness Analysis by End Use
  • Figure 77: Eastern Europe Market Value Share and BPS Analysis by Country, 2025 and 2035
  • Figure 78: Eastern Europe Market Value Share and BPS Analysis by Nature, 2025 and 2035
  • Figure 79: Eastern Europe Market Y-o-Y Growth Comparison by Nature, 2025-2035
  • Figure 80: Eastern Europe Market Attractiveness Analysis by Nature
  • Figure 81: Eastern Europe Market Value Share and BPS Analysis by Variety, 2025 and 2035
  • Figure 82: Eastern Europe Market Y-o-Y Growth Comparison by Variety, 2025-2035
  • Figure 83: Eastern Europe Market Attractiveness Analysis by Variety
  • Figure 84: Eastern Europe Market Value Share and BPS Analysis by Format, 2025 and 2035
  • Figure 85: Eastern Europe Market Y-o-Y Growth Comparison by Format, 2025-2035
  • Figure 86: Eastern Europe Market Attractiveness Analysis by Format
  • Figure 87: Eastern Europe Market Value Share and BPS Analysis by Distribution Channel, 2025 and 2035
  • Figure 88: Eastern Europe Market Y-o-Y Growth Comparison by Distribution Channel, 2025-2035
  • Figure 89: Eastern Europe Market Attractiveness Analysis by Distribution Channel
  • Figure 90: Eastern Europe Market Value Share and BPS Analysis by End Use, 2025 and 2035
  • Figure 91: Eastern Europe Market Y-o-Y Growth Comparison by End Use, 2025-2035
  • Figure 92: Eastern Europe Market Attractiveness Analysis by End Use
  • Figure 93: East Asia Market Value Share and BPS Analysis by Country, 2025 and 2035
  • Figure 94: East Asia Market Value Share and BPS Analysis by Nature, 2025 and 2035
  • Figure 95: East Asia Market Y-o-Y Growth Comparison by Nature, 2025-2035
  • Figure 96: East Asia Market Attractiveness Analysis by Nature
  • Figure 97: East Asia Market Value Share and BPS Analysis by Variety, 2025 and 2035
  • Figure 98: East Asia Market Y-o-Y Growth Comparison by Variety, 2025-2035
  • Figure 99: East Asia Market Attractiveness Analysis by Variety
  • Figure 100: East Asia Market Value Share and BPS Analysis by Format, 2025 and 2035
  • Figure 101: East Asia Market Y-o-Y Growth Comparison by Format, 2025-2035
  • Figure 102: East Asia Market Attractiveness Analysis by Format
  • Figure 103: East Asia Market Value Share and BPS Analysis by Distribution Channel, 2025 and 2035
  • Figure 104: East Asia Market Y-o-Y Growth Comparison by Distribution Channel, 2025-2035
  • Figure 105: East Asia Market Attractiveness Analysis by Distribution Channel
  • Figure 106: East Asia Market Value Share and BPS Analysis by End Use, 2025 and 2035
  • Figure 107: East Asia Market Y-o-Y Growth Comparison by End Use, 2025-2035
  • Figure 108: East Asia Market Attractiveness Analysis by End Use
  • Figure 109: South Asia & Pacific Market Value Share and BPS Analysis by Country, 2025 and 2035
  • Figure 110: South Asia & Pacific Market Value Share and BPS Analysis by Nature, 2025 and 2035
  • Figure 111: South Asia & Pacific Market Y-o-Y Growth Comparison by Nature, 2025-2035
  • Figure 112: South Asia & Pacific Market Attractiveness Analysis by Nature
  • Figure 113: South Asia & Pacific Market Value Share and BPS Analysis by Variety, 2025 and 2035
  • Figure 114: South Asia & Pacific Market Y-o-Y Growth Comparison by Variety, 2025-2035
  • Figure 115: South Asia & Pacific Market Attractiveness Analysis by Variety
  • Figure 116: South Asia & Pacific Market Value Share and BPS Analysis by Format, 2025 and 2035
  • Figure 117: South Asia & Pacific Market Y-o-Y Growth Comparison by Format, 2025-2035
  • Figure 118: South Asia & Pacific Market Attractiveness Analysis by Format
  • Figure 119: South Asia & Pacific Market Value Share and BPS Analysis by Distribution Channel, 2025 and 2035
  • Figure 120: South Asia & Pacific Market Y-o-Y Growth Comparison by Distribution Channel, 2025-2035
  • Figure 121: South Asia & Pacific Market Attractiveness Analysis by Distribution Channel
  • Figure 122: South Asia & Pacific Market Value Share and BPS Analysis by End Use, 2025 and 2035
  • Figure 123: South Asia & Pacific Market Y-o-Y Growth Comparison by End Use, 2025-2035
  • Figure 124: South Asia & Pacific Market Attractiveness Analysis by End Use
  • Figure 125: Middle East and Africa Market Value Share and BPS Analysis by Country, 2025 and 2035
  • Figure 126: Middle East and Africa Market Value Share and BPS Analysis by Nature, 2025 and 2035
  • Figure 127: Middle East and Africa Market Y-o-Y Growth Comparison by Nature, 2025-2035
  • Figure 128: Middle East and Africa Market Attractiveness Analysis by Nature
  • Figure 129: Middle East and Africa Market Value Share and BPS Analysis by Variety, 2025 and 2035
  • Figure 130: Middle East and Africa Market Y-o-Y Growth Comparison by Variety, 2025-2035
  • Figure 131: Middle East and Africa Market Attractiveness Analysis by Variety
  • Figure 132: Middle East and Africa Market Value Share and BPS Analysis by Format, 2025 and 2035
  • Figure 133: Middle East and Africa Market Y-o-Y Growth Comparison by Format, 2025-2035
  • Figure 134: Middle East and Africa Market Attractiveness Analysis by Format
  • Figure 135: Middle East and Africa Market Value Share and BPS Analysis by Distribution Channel, 2025 and 2035
  • Figure 136: Middle East and Africa Market Y-o-Y Growth Comparison by Distribution Channel, 2025-2035
  • Figure 137: Middle East and Africa Market Attractiveness Analysis by Distribution Channel
  • Figure 138: Middle East and Africa Market Value Share and BPS Analysis by End Use, 2025 and 2035
  • Figure 139: Middle East and Africa Market Y-o-Y Growth Comparison by End Use, 2025-2035
  • Figure 140: Middle East and Africa Market Attractiveness Analysis by End Use
  • Figure 141: Global Market - Tier Structure Analysis
  • Figure 142: Global Market - Company Share Analysis

Frequently Asked Questions

How big is the spelt wheat market in 2025?

The global spelt wheat market is estimated to be valued at USD 2.1 billion in 2025.

What will be the size of the spelt wheat market in 2035?

The market size for the spelt wheat market is projected to reach USD 3.1 billion by 2035.

How much will the spelt wheat market grow between 2025 and 2035?

The spelt wheat market is expected to grow at a 4.1% CAGR between 2025 and 2035.

Which spelt wheat variety is projected to have a prominent market share in 2025?

The whole flour variety is projected to account for 59% of the market share in 2025.

Which end-use segment is expected to contribute a significant share to the spelt wheat market in 2025?

In terms of end use, the food industry segment is expected to command a 62% share in the spelt wheat market in 2025.

Explore Similar Insights

Future Market Insights

Spelt Wheat Market