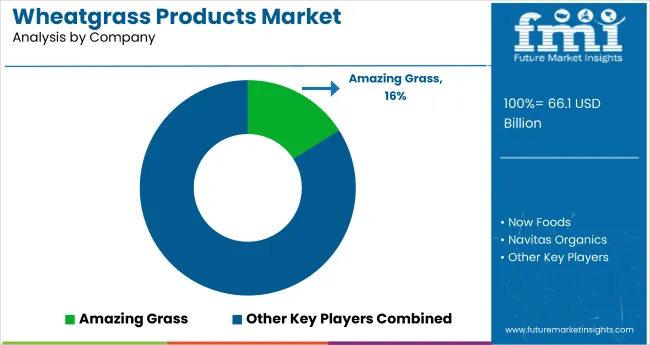
Wheatgrass Products Market Snapshot (2023 to 2033)

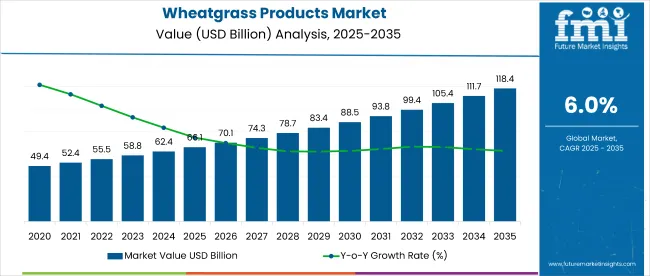
The global wheatgrass products market is expected to attain a valuation of US$ 62,400 million in 2023 and is projected to reach US$ 114,398.6 million by 2033, expected to rise at a CAGR of 6% during the forecast period.

The increasing awareness of the health advantages associated with wheatgrass is projected to fuel its growth. The surge in wellness trends and evolving consumer preferences for green foods are also contributing to the growing demand for wheatgrass products.

The expanding aging population is a significant driver for industry growth. Wheatgrass products are commonly utilized by both men and women aged 60 years and above to promote regular blood circulation and attain various health benefits. Moreover, the rising number of diabetic patients worldwide is anticipated to further propel the demand for wheatgrass products.

As per the International Diabetic Federation's report in 2021, there are approximately 537 million individuals aged 20 to 79 living with diabetes. Furthermore, it is projected that the total number of people with diabetes will rise to 643 million by 2030. Wheatgrass powder is considered beneficial for diabetics due to its anti-diabetic properties, which assist in regulating blood sugar levels and mitigating the adverse effects of high blood sugar. Therefore, wheatgrass powder can be utilized as a complementary treatment alongside conventional diabetes management.

In 2021, the World Health Organization (WHO) reported that breast cancer has emerged as the most prevalent form of cancer globally, accounting for 12% of all newly diagnosed cases annually. Wheatgrass juice has shown potential in reducing chemotherapy-related haematological toxicity among breast cancer patients.

Report Attribute Details
Expected Market Value (2023) US$ 62,400 million
Anticipated Forecast Value (2033) US$ 114,398.6 million
Projected Growth Rate (2023 to 2033) CAGR 6%

Don't pay for what you don't need

Customize your report by selecting specific countries or regions and save 30%!

2018 to 2022 Wheatgrass Products Demand Analysis vs. Forecast 2023 to 2033

The wheatgrass products market was worth USD 54,412.0 million in 2018. It accumulated a market value of USD 60,000 million in 2022 while growing at a CAGR of 2.5% during the historical period.

Wheatgrass products are packed with a variety of nutrients including, minerals, vitamins, and amino acids. The wheatgrass products market is expected to rise at 6% CAGR between 2023 and 2033.

Manufacturers are investing in environment-friendly product portfolios. Consumers have become particular about their choices, including eco-friendly packaging, clean label ingredients, and practices adhering to animal welfare. Consequently, quality and ethics are gaining importance in the industry.

The primary driver for wheatgrass products is demand from gluten-intolerant consumers. Wheatgrass is also high in antioxidants, vitamins, and minerals, which helps in detoxification of the liver by excreting toxic substances.

Consumers in general believe that gluten-free products are considered to be healthy for the gut and help in higher metabolism rates, thereby supporting the adoption of wheatgrass products.

Wheatgrass products are gaining traction among middle aged and geriatric consumers owing to higher incidence of digestive and immunity ailments. Manufacturers have incorporated wheatgrass in various forms, with powdered options supporting long-term demand owing to ease of use in smoothies, protein shakes, and health supplements.

Is the Preference for Non-Modified Ingredients Boosting the Sales of Wheatgrass Products?

Manufacturers have significant scope for research and development as wheatgrass products can be utilized in cosmetics, skin care, pharmaceuticals, food and beverages, sports, and nutrition.

The growing numbers of health-conscious people around the world has grown the demand for non-GMO cosmetic ingredients. In the case of parenting, parents are increasingly concerned about the ingredients used in baby care products on the market, resulting in a preference for non-GMO materials for the foreseeable future.

Also, consumption of young wheatgrass is a potent source of active enzymes, minerals, vitamins and proteins. The increased clinical utility of wheatgrass due to antioxidant properties helps with the treatment of most of the degenerative ailments including cardio-vascular disease and diabetes.

Detoxification trends are also gaining traction. Increasing consumption of junk food and chemical-based medications by consumers are generating demanding for wheatgrass-infused drinks. This is especially popular among vegan consumers.

The plant also helps in overcoming hypertension, joint pain, and obesity which bolsters incorporation in the food and beverage sector. In 2020, MY PROTEIN, a U.S. based company offered its Green Superfood Blend for growing muscle mass.

Nandini Roy Choudhury

Principal Consultant

Talk to Analyst

Find your sweet spots for generating winning opportunities in this market.

Country-wise Insights

How Big is the Opportunity for Wheatgrass Products Market in the United States?

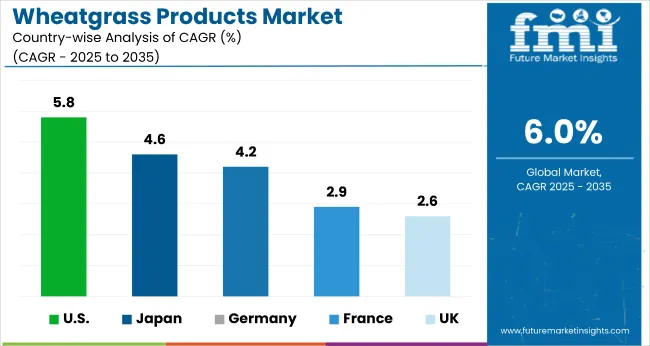
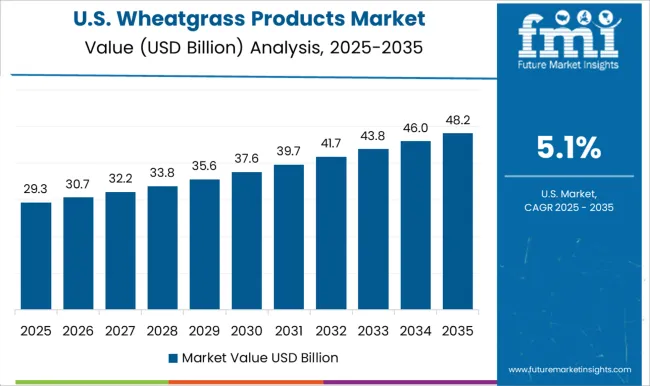
According to FMI, the North America wheatgrass products market accounted for a maximum market share of nearly 30% in 2021. In 2022, the market in United States accounted for a revenue share of 12.3%. The region is expected to grow with a CAGR of 5.8% during the forecast period.

FMI has projected that the United States will be among the most profitable markets throughout the forecast period with high spending power being a major driver. The United States is considered to be a mature market for wheatgrass with an established base of consumers. A notable portion of the population in the U.S. is gluten intolerant. Therefore, wheatgrass being one of the healthiest options available, will witness major opportunities in the years ahead.

Is India’s Wheatgrass Products Market Set to Surge in the Near Future?

With a market share of nearly 50% in 2023, India remains one of the more lucrative markets in South Asia. The wheatgrass product market in India is expected to grow with an impressive CAGR of 24.6% during the forecast period. India’s population has traditionally followed Ayurvedic practices in medicine, which supports adoption.

India being an emerging nation with a high population will support efforts by manufacturers to penetrate the market. Increasing incidence of digestive, liver, and stomach disorders in among Indians will bolster demand for wheatgrass products. Other factors propelling the market are increased economic development, higher purchasing power, and increasing standards of living.

How is the United Kingdom Wheatgrass Products Market Responding to Demand for Plant-based Food?

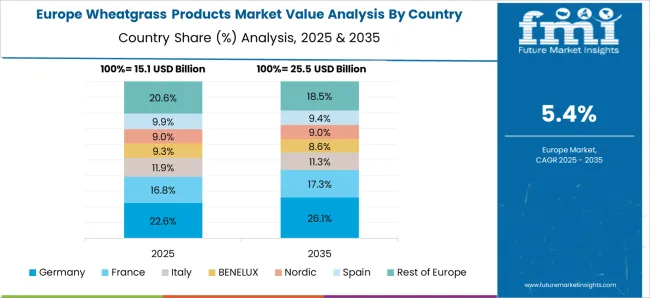
With a market share of over 19% in 2023, the United Kingdom is estimated to have significant market share in the Europe wheatgrass products market. The demand for wheatgrass products in United Kingdom is expected to grow with a CAGR of 2.6% during the forecast period. Due to the growing demand of plant-based products in the United Kingdom, the rising vegan population and the resultant demand for juices and supplements will aid market developments.

Wheatgrass is also widely used in juices and smoothies, which is considered has an effective method of removing toxins, which generates positive prospects in the upcoming decade.

What Factors Impact the Wheatgrass Products Market in Germany?

FMI has projected the Germany wheatgrass products market to gain an attractive value share over the forecast period accounting for nearly 21% of Europe in 2023. Germany alone accounted for 4.6% of global revenue share in 2022.

Despite the impact of the pandemic on the country’s food and beverage industry, the demand for clean label and healthy products is increasing through 2023. The fear of the pandemic has made people very cautious about their eating habits. Thus, immunity boosting products have become very important among consumers.

Therefore, the demand for wheatgrass products is constantly on the rise in Germany manufacturers in Germany are also innovating with variety in the form of beverages to attract consumers and to ensure sales in the long-term.

How Large is the Opportunity for Organic Wheatgrass in Brazil?

FMI has projected the Brazil wheatgrass products market to gain significant value share over the forecast period accounting for 39% in 2023. Brazil is projected to witness lucrative growth as consumers are opting for organic supplements over synthetic alternatives, owing to fears of side effects. Therefore, the consumption of organic wheatgrass supplements has increased in Brazil. The trend is likely to continue in the upcoming decade.

Category-wise Insights

How are Organic Wheatgrass Products Set to Fare?

Organic wheatgrass products account for nearly 90% of the overall market in 2022 and the demand is expected to rise with a CAGR of 6.5% during the forecast period.

Increasing demand from health-conscious consumers for healthier food options, and a preference for products that are beneficial for health drive market developments.

Consumers are willing to pay a premium price for organic products. The changing consumer preferences are driving the demand for organic wheatgrass products for the foreseeable future.

Which Type of Wheatgrass Product is Gaining Traction?

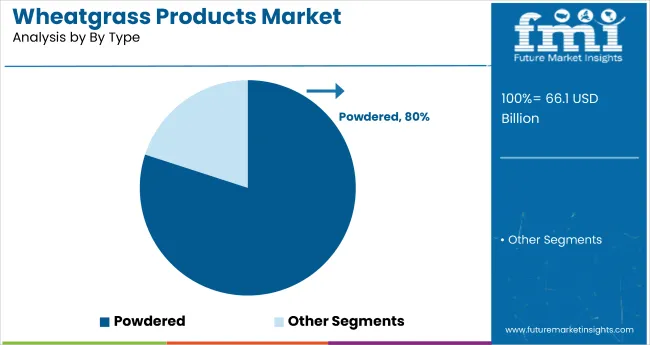
Powdered products account for a maximum market share of 80% in 2022. This can be attributed to superior taste and ease of use. Powdered wheatgrass is gaining a lot of traction in the United States owing to the widespread presence of processing plants in the country.

Powdered products find roles in nutraceuticals in addition to the food and beverage sector. Therefore, it will neutralize taste and is preferred by athletes. Now Food Inc. has launched organic wheatgrass powder to meet sports nutrition application requirements.

Which Distribution Channel is Preferred in the Wheatgrass Products Market?

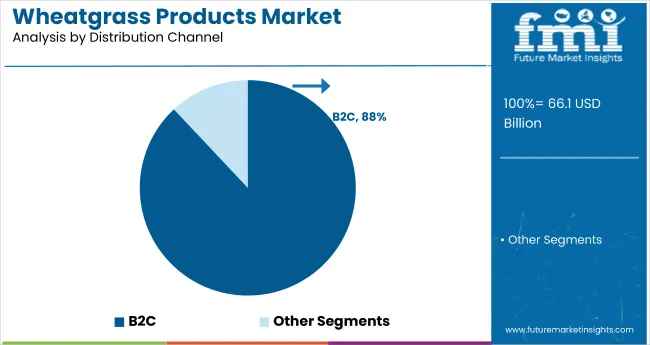
The B2C segment accounted for a revenue share of 88% in 2022. This segment is expected to grow with a CAGR of 6.4% during the forecast period. This is owing to customization of product offerings as per user needs at an optimal price. Also, these channels provide access to brands and manufacturers in supermarkets and hypermarkets.

Besides this, manufacturers prefer supermarkets and hypermarkets owing to direct contact with the consumer and the resultant confidence regarding product authenticity. Online sales channels help to optimize supply chains, thereby reducing the cost to the manufacturer.

Which Packaging is Preferred for Wheatgrass Products?

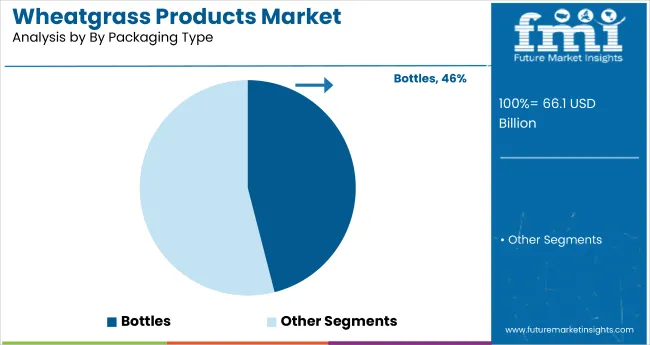
Bottles for packaging wheatgrass products is expected to dominate the global market with a share of nearly 46%, in 2023 which is expected to grow over the forecast period. Packaging plays a prominent role is attracting the consumers.

Therefore, manufacturers are also focusing on ensuring the use of eco-friendly packaging material to keep up with evolving consumer preferences.

Which End Use Application Accounts for Maximum Market Share?

Household end use applications accounted for a significant share in 2022. Ease of use for consumers drive demand in these settings.

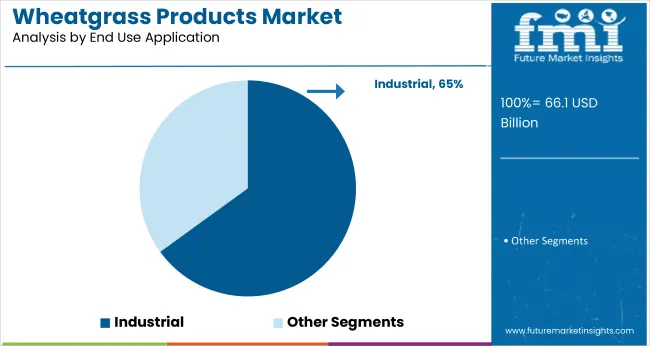
However, industrial applications accounted for 65% revenue share in 2022. The demand from this segment is projected to grow with a CAGR of 6.8% throughout the forecast period. The segment will most likely witness an attractive growth rate during the forecast period, with niche use in the pharma and nutraceutical sectors.

Get the data you need at a Fraction of the cost

Personalize your report by choosing insights you need
and save 40%!

Start-ups in Wheatgrass Products Market

Start-ups are crucial in identifying growth opportunities, including the wheatgrass products market. They effectively convert inputs to outputs and adapt to market changes, contributing to the industry's expansion. Some start-ups are expected to drive growth in the wheatgrass products market.

  • Amazing Grass is involved in manufacturing and marketing organic plant-based nutrition products, including wheat grass, green superfood, raw reserve, plant-based protein, organic superfood bars, kidz superfood, and others.
  • Grass Root Naturals specializes in producing and selling a variety of plant-based superfoods.
  • Juju Fresh is an online-first brand that offers cold-pressed juice prepared and delivered through its internet platform. Their juices are crafted using a blend of nutritious ingredients, including black beans, spinach, celery, apple, orange, wheatgrass, and more.

Competitive Landscape

The wheatgrass products market is highly competitive, with several key industry players investing heavily in the production of these services.

The key industry players are Now Foods, Synergy Natural, Dynamic Greens Wheatgrass Juice, Navitas Organics, My protein, Pines International, Inc., Herbco International Inc, Nutriblade, Girmes Wheatgrass, E-Phamax, Terrasoul Superfoods, Naturya, ABE'S Organics, Nature Bell, Amazing Grass, Dr. Berg.

Some recent developments in the market are:

Key industry players are utilizing organic growth strategies like acquisitions, mergers, tie-ups, and collaboration to bolster their product portfolio. This is expected to propel the global wheatgrass products market.

  • In March 2021, JIVO Wellness, a New Delhi-based company, launched an exciting range of products, including a refreshing wheatgrass summer drink. To expand its reach, the company has formed partnerships with leading e-commerce platforms and superstores for widespread distribution.
  • In February 2021, Living MaKa introduced its inaugural range of convenient and ready-to-drink wheatgrass beverages, aiming to make wheatgrass easily accessible to all. In July 2022, MaKa joined forces with UNFI and KeHE to enhance distribution, making their products available in independent and natural stores across various regions nationwide.
  • In 2020, JIVO Wellness unveiled an expanded range of products, featuring organic basmati rice, muesli munch, choco flakes, wheatgrass summer drinks, and more.
  • In September 2020, Nature's Path, a significant player in the industry, introduced a new product line consisting of superfood granolas and cups made from wheatgrass.

Report Scope

Report Attribute Details
Market Value in 2023 US$ 62,400 million
Market Value in 2033 US$ 114,398.6 million
Growth Rate CAGR of 6% from 2023 to 2033
Base Year for Estimation 2022
Historical Data 2018 to 2022
Forecast Period 2023 to 2033
Quantitative Units Revenue in US$ million and CAGR from 2023 to 2033
Report Coverage Revenue Forecast, Volume Forecast, Company Ranking, Competitive Landscape, Growth Factors, Trends, and Pricing Analysis
Segments Covered
  • By type
  • By nature
  • By end-use application
  • By packaging type
  • By distribution channel
  • By region
Regions Covered
  • North America
  • Latin America
  • Europe
  • Asia Pacific
  • Middle East and Africa
Key Countries Profiled
  • United States
  • Canada
  • Brazil
  • Mexico
  • Germany
  • United Kingdom
  • France
  • Spain
  • Italy
  • India
  • China
  • Japan
  • Malaysia
  • Singapore
  • Thailand
  • South Korea
  • Australia
  • New Zealand
  • GCC Countries
  • South Africa
  • Israel
Key Companies Profiled
  • Now Foods
  • Synergy Natural
  • Dynamic Greens Wheatgrass Juice
  • Navitas Organics
  • My protein
  • Pines International, Inc.
  • Herbco International Inc.
  • Nutriblade
  • Girmes Wheatgrass
  • E-Phamax
  • Terrasoul Superfoods
  • Naturya
  • ABE'S Organics
  • Nature Bell
  • Amazing Grass
  • Dr. Berg
Customization & Pricing Available Upon Request

Key Segments Profiled in the Wheatgrass products Market Industry Survey

By Type:

  • Juice
  • Powder

By Nature:

  • Natural
  • Organic

By End Use Application:

  • Industrial
    • Food & Beverages
    • Nutraceuticals
    • Personal Care & Cosmetics
    • Pharmaceuticals
    • Pet Food
  • Household

By Packaging Type:

  • Pouches
  • Tins
  • Bottles
  • Sachets
  • Capsules

By Distribution Channel:

  • B2B
  • B2C
    • Hypermarket/Supermarket
    • Convenience Store
    • Specialty Store
    • Online Retailers
    • Others

By Region:

  • North America
  • Latin America
  • Europe
  • Asia Pacific
  • Middle East and Africa

Frequently Asked Questions

How will the Global Wheatgrass Products Market Progress in the Next Ten Years?

The sales of wheatgrass products worldwide could advance at a 6% CAGR through 2033.

What will be the Net Worth of the Global Wheatgrass Products Market Size in 2033?

The market is expected to reach US$ 114,398.6 million by 2033.

What are the Emerging Trends in the Global Wheatgrass Products Market?

Use of wheatgrass juice to cure breast cancer has boosted the overall market growth.

Which is the Rapidly Growing Region for the Global Wheatgrass Products Market?

The market in India is growing rapidly, with 24.6% of market share until 2033.

Which Key Type Wheatgrass Products is Benefitting the Market More?

The organic segment is in high demand and may exhibit 6.5% CAGR through 2033.

Table of Content
1. Executive Summary
    1.1. Global Market Outlook
    1.2. Demand-side Trends
    1.3. Supply-side Trends
    1.4. Technology Roadmap Analysis
    1.5. Analysis and Recommendations
2. Market Overview
    2.1. Market Coverage / Taxonomy
    2.2. Market Definition / Scope / Limitations
3. Market Background
    3.1. Market Dynamics
        3.1.1. Drivers
        3.1.2. Restraints
        3.1.3. Opportunity
        3.1.4. Trends
    3.2. Scenario Forecast
        3.2.1. Demand in Optimistic Scenario
        3.2.2. Demand in Likely Scenario
        3.2.3. Demand in Conservative Scenario
    3.3. Opportunity Map Analysis
    3.4. Product Life Cycle Analysis
    3.5. Supply Chain Analysis
        3.5.1. Supply Side Participants and their Roles
            3.5.1.1. Producers
            3.5.1.2. Mid-Level Participants (Traders/ Agents/ Brokers)
            3.5.1.3. Wholesalers and Distributors
        3.5.2. Value Added and Value Created at Node in the Supply Chain
        3.5.3. List of Raw Material Suppliers
        3.5.4. List of Existing and Potential Buyers
    3.6. Investment Feasibility Matrix
    3.7. Value Chain Analysis
        3.7.1. Profit Margin Analysis
        3.7.2. Wholesalers and Distributors
        3.7.3. Retailers
    3.8. PESTLE and Porter’s Analysis
    3.9. Regulatory Landscape
        3.9.1. By Key Regions
        3.9.2. By Key Countries
    3.10. Regional Parent Market Outlook
    3.11. Production and Consumption Statistics
    3.12. Import and Export Statistics
4. Global Market Analysis 2018 to 2022 and Forecast, 2023 to 2033
    4.1. Historical Market Size Value (US$ Million) & Volume (MT) Analysis, 2018 to 2022
    4.2. Current and Future Market Size Value (US$ Million) & Volume (MT) Projections, 2023 to 2033
        4.2.1. Y-o-Y Growth Trend Analysis
        4.2.2. Absolute $ Opportunity Analysis
5. Global Market Analysis 2018 to 2022 and Forecast 2023 to 2033, By Type
    5.1. Introduction / Key Findings
    5.2. Historical Market Size Value (US$ Million) & Volume (MT) Analysis By Type, 2018 to 2022
    5.3. Current and Future Market Size Value (US$ Million) & Volume (MT) Analysis and Forecast By Type, 2023 to 2033
        5.3.1. Juice
        5.3.2. Powder
    5.4. Y-o-Y Growth Trend Analysis By Type, 2018 to 2022
    5.5. Absolute $ Opportunity Analysis By Type, 2023 to 2033
6. Global Market Analysis 2018 to 2022 and Forecast 2023 to 2033, By Nature
    6.1. Introduction / Key Findings
    6.2. Historical Market Size Value (US$ Million) & Volume (MT) Analysis By Nature, 2018 to 2022
    6.3. Current and Future Market Size Value (US$ Million) & Volume (MT) Analysis and Forecast By Nature, 2023 to 2033
        6.3.1. Natural
        6.3.2. Organic
    6.4. Y-o-Y Growth Trend Analysis By Nature, 2018 to 2022
    6.5. Absolute $ Opportunity Analysis By Nature, 2023 to 2033
7. Global Market Analysis 2018 to 2022 and Forecast 2023 to 2033, By End Use Application
    7.1. Introduction / Key Findings
    7.2. Historical Market Size Value (US$ Million) & Volume (MT) Analysis By End Use Application, 2018 to 2022
    7.3. Current and Future Market Size Value (US$ Million) & Volume (MT) Analysis and Forecast By End Use Application, 2023 to 2033
        7.3.1. Industrial
            7.3.1.1. Food & Beverages
            7.3.1.2. Nutraceuticals
            7.3.1.3. Personal Care & Cosmetics
            7.3.1.4. Pharmaceuticals
            7.3.1.5. Pet Food
        7.3.2. Household
    7.4. Y-o-Y Growth Trend Analysis By End Use Application, 2018 to 2022
    7.5. Absolute $ Opportunity Analysis By End Use Application, 2023 to 2033
8. Global Market Analysis 2018 to 2022 and Forecast 2023 to 2033, By Packaging Type
    8.1. Introduction / Key Findings
    8.2. Historical Market Size Value (US$ Million) & Volume (MT) Analysis By Packaging Type, 2018 to 2022
    8.3. Current and Future Market Size Value (US$ Million) & Volume (MT) Analysis and Forecast By Packaging Type, 2023 to 2033
        8.3.1. Pouches
        8.3.2. Tins
        8.3.3. Bottles
        8.3.4. Sachets
        8.3.5. Capsules
    8.4. Y-o-Y Growth Trend Analysis By Packaging Type, 2018 to 2022
    8.5. Absolute $ Opportunity Analysis By Packaging Type, 2023 to 2033
9. Global Market Analysis 2018 to 2022 and Forecast 2023 to 2033, By Distribution Channel
    9.1. Introduction / Key Findings
    9.2. Historical Market Size Value (US$ Million) & Volume (MT) Analysis By Distribution Channel, 2018 to 2022
    9.3. Current and Future Market Size Value (US$ Million) & Volume (MT) Analysis and Forecast By Distribution Channel, 2023 to 2033
        9.3.1. B2B
        9.3.2. B2C
            9.3.2.1. Hypermarket/Supermarket
            9.3.2.2. Convenience Store
            9.3.2.3. Specialty Store
            9.3.2.4. Online Retailers
            9.3.2.5. Others
    9.4. Y-o-Y Growth Trend Analysis By Distribution Channel, 2018 to 2022
    9.5. Absolute $ Opportunity Analysis By Distribution Channel, 2023 to 2033
10. Global Market Analysis 2018 to 2022 and Forecast 2023 to 2033, By Region
    10.1. Introduction
    10.2. Historical Market Size Value (US$ Million) & Volume (MT) Analysis By Region, 2018 to 2022
    10.3. Current Market Size Value (US$ Million) & Volume (MT) Analysis and Forecast By Region, 2023 to 2033
        10.3.1. North America
        10.3.2. Latin America
        10.3.3. Europe
        10.3.4. Asia Pacific
        10.3.5. MEA
    10.4. Market Attractiveness Analysis By Region
11. North America Market Analysis 2018 to 2022 and Forecast 2023 to 2033, By Country
    11.1. Historical Market Size Value (US$ Million) & Volume (MT) Trend Analysis By Market Taxonomy, 2018 to 2022
    11.2. Market Size Value (US$ Million) & Volume (MT) Forecast By Market Taxonomy, 2023 to 2033
        11.2.1. By Country
            11.2.1.1. USA
            11.2.1.2. Canada
        11.2.2. By Type
        11.2.3. By Nature
        11.2.4. By End Use Application
        11.2.5. By Packaging Type
        11.2.6. By Distribution Channel
    11.3. Market Attractiveness Analysis
        11.3.1. By Country
        11.3.2. By Type
        11.3.3. By Nature
        11.3.4. By End Use Application
        11.3.5. By Packaging Type
        11.3.6. By Distribution Channel
    11.4. Key Takeaways
12. Latin America Market Analysis 2018 to 2022 and Forecast 2023 to 2033, By Country
    12.1. Historical Market Size Value (US$ Million) & Volume (MT) Trend Analysis By Market Taxonomy, 2018 to 2022
    12.2. Market Size Value (US$ Million) & Volume (MT) Forecast By Market Taxonomy, 2023 to 2033
        12.2.1. By Country
            12.2.1.1. Brazil
            12.2.1.2. Mexico
            12.2.1.3. Rest of Latin America
        12.2.2. By Type
        12.2.3. By Nature
        12.2.4. By End Use Application
        12.2.5. By Packaging Type
        12.2.6. By Distribution Channel
    12.3. Market Attractiveness Analysis
        12.3.1. By Country
        12.3.2. By Type
        12.3.3. By Nature
        12.3.4. By End Use Application
        12.3.5. By Packaging Type
        12.3.6. By Distribution Channel
    12.4. Key Takeaways
13. Europe Market Analysis 2018 to 2022 and Forecast 2023 to 2033, By Country
    13.1. Historical Market Size Value (US$ Million) & Volume (MT) Trend Analysis By Market Taxonomy, 2018 to 2022
    13.2. Market Size Value (US$ Million) & Volume (MT) Forecast By Market Taxonomy, 2023 to 2033
        13.2.1. By Country
            13.2.1.1. Germany
            13.2.1.2. UK
            13.2.1.3. France
            13.2.1.4. Spain
            13.2.1.5. Italy
            13.2.1.6. Rest of Europe
        13.2.2. By Type
        13.2.3. By Nature
        13.2.4. By End Use Application
        13.2.5. By Packaging Type
        13.2.6. By Distribution Channel
    13.3. Market Attractiveness Analysis
        13.3.1. By Country
        13.3.2. By Type
        13.3.3. By Nature
        13.3.4. By End Use Application
        13.3.5. By Packaging Type
        13.3.6. By Distribution Channel
    13.4. Key Takeaways
14. Asia Pacific Market Analysis 2018 to 2022 and Forecast 2023 to 2033, By Country
    14.1. Historical Market Size Value (US$ Million) & Volume (MT) Trend Analysis By Market Taxonomy, 2018 to 2022
    14.2. Market Size Value (US$ Million) & Volume (MT) Forecast By Market Taxonomy, 2023 to 2033
        14.2.1. By Country
            14.2.1.1. China
            14.2.1.2. Japan
            14.2.1.3. South Korea
            14.2.1.4. Singapore
            14.2.1.5. Thailand
            14.2.1.6. Indonesia
            14.2.1.7. Australia
            14.2.1.8. New Zealand
            14.2.1.9. Rest of Asia Pacific
        14.2.2. By Type
        14.2.3. By Nature
        14.2.4. By End Use Application
        14.2.5. By Packaging Type
        14.2.6. By Distribution Channel
    14.3. Market Attractiveness Analysis
        14.3.1. By Country
        14.3.2. By Type
        14.3.3. By Nature
        14.3.4. By End Use Application
        14.3.5. By Packaging Type
        14.3.6. By Distribution Channel
    14.4. Key Takeaways
15. MEA Market Analysis 2018 to 2022 and Forecast 2023 to 2033, By Country
    15.1. Historical Market Size Value (US$ Million) & Volume (MT) Trend Analysis By Market Taxonomy, 2018 to 2022
    15.2. Market Size Value (US$ Million) & Volume (MT) Forecast By Market Taxonomy, 2023 to 2033
        15.2.1. By Country
            15.2.1.1. GCC Countries
            15.2.1.2. South Africa
            15.2.1.3. Israel
            15.2.1.4. Rest of MEA
        15.2.2. By Type
        15.2.3. By Nature
        15.2.4. By End Use Application
        15.2.5. By Packaging Type
        15.2.6. By Distribution Channel
    15.3. Market Attractiveness Analysis
        15.3.1. By Country
        15.3.2. By Type
        15.3.3. By Nature
        15.3.4. By End Use Application
        15.3.5. By Packaging Type
        15.3.6. By Distribution Channel
    15.4. Key Takeaways
16. Key Countries Market Analysis
    16.1. USA
        16.1.1. Pricing Analysis
        16.1.2. Market Share Analysis, 2022
            16.1.2.1. By Type
            16.1.2.2. By Nature
            16.1.2.3. By End Use Application
            16.1.2.4. By Packaging Type
            16.1.2.5. By Distribution Channel
    16.2. Canada
        16.2.1. Pricing Analysis
        16.2.2. Market Share Analysis, 2022
            16.2.2.1. By Type
            16.2.2.2. By Nature
            16.2.2.3. By End Use Application
            16.2.2.4. By Packaging Type
            16.2.2.5. By Distribution Channel
    16.3. Brazil
        16.3.1. Pricing Analysis
        16.3.2. Market Share Analysis, 2022
            16.3.2.1. By Type
            16.3.2.2. By Nature
            16.3.2.3. By End Use Application
            16.3.2.4. By Packaging Type
            16.3.2.5. By Distribution Channel
    16.4. Mexico
        16.4.1. Pricing Analysis
        16.4.2. Market Share Analysis, 2022
            16.4.2.1. By Type
            16.4.2.2. By Nature
            16.4.2.3. By End Use Application
            16.4.2.4. By Packaging Type
            16.4.2.5. By Distribution Channel
    16.5. Germany
        16.5.1. Pricing Analysis
        16.5.2. Market Share Analysis, 2022
            16.5.2.1. By Type
            16.5.2.2. By Nature
            16.5.2.3. By End Use Application
            16.5.2.4. By Packaging Type
            16.5.2.5. By Distribution Channel
    16.6. UK
        16.6.1. Pricing Analysis
        16.6.2. Market Share Analysis, 2022
            16.6.2.1. By Type
            16.6.2.2. By Nature
            16.6.2.3. By End Use Application
            16.6.2.4. By Packaging Type
            16.6.2.5. By Distribution Channel
    16.7. France
        16.7.1. Pricing Analysis
        16.7.2. Market Share Analysis, 2022
            16.7.2.1. By Type
            16.7.2.2. By Nature
            16.7.2.3. By End Use Application
            16.7.2.4. By Packaging Type
            16.7.2.5. By Distribution Channel
    16.8. Spain
        16.8.1. Pricing Analysis
        16.8.2. Market Share Analysis, 2022
            16.8.2.1. By Type
            16.8.2.2. By Nature
            16.8.2.3. By End Use Application
            16.8.2.4. By Packaging Type
            16.8.2.5. By Distribution Channel
    16.9. Italy
        16.9.1. Pricing Analysis
        16.9.2. Market Share Analysis, 2022
            16.9.2.1. By Type
            16.9.2.2. By Nature
            16.9.2.3. By End Use Application
            16.9.2.4. By Packaging Type
            16.9.2.5. By Distribution Channel
    16.10. China
        16.10.1. Pricing Analysis
        16.10.2. Market Share Analysis, 2022
            16.10.2.1. By Type
            16.10.2.2. By Nature
            16.10.2.3. By End Use Application
            16.10.2.4. By Packaging Type
            16.10.2.5. By Distribution Channel
    16.11. Japan
        16.11.1. Pricing Analysis
        16.11.2. Market Share Analysis, 2022
            16.11.2.1. By Type
            16.11.2.2. By Nature
            16.11.2.3. By End Use Application
            16.11.2.4. By Packaging Type
            16.11.2.5. By Distribution Channel
    16.12. South Korea
        16.12.1. Pricing Analysis
        16.12.2. Market Share Analysis, 2022
            16.12.2.1. By Type
            16.12.2.2. By Nature
            16.12.2.3. By End Use Application
            16.12.2.4. By Packaging Type
            16.12.2.5. By Distribution Channel
    16.13. Singapore
        16.13.1. Pricing Analysis
        16.13.2. Market Share Analysis, 2022
            16.13.2.1. By Type
            16.13.2.2. By Nature
            16.13.2.3. By End Use Application
            16.13.2.4. By Packaging Type
            16.13.2.5. By Distribution Channel
    16.14. Thailand
        16.14.1. Pricing Analysis
        16.14.2. Market Share Analysis, 2022
            16.14.2.1. By Type
            16.14.2.2. By Nature
            16.14.2.3. By End Use Application
            16.14.2.4. By Packaging Type
            16.14.2.5. By Distribution Channel
    16.15. Indonesia
        16.15.1. Pricing Analysis
        16.15.2. Market Share Analysis, 2022
            16.15.2.1. By Type
            16.15.2.2. By Nature
            16.15.2.3. By End Use Application
            16.15.2.4. By Packaging Type
            16.15.2.5. By Distribution Channel
    16.16. Australia
        16.16.1. Pricing Analysis
        16.16.2. Market Share Analysis, 2022
            16.16.2.1. By Type
            16.16.2.2. By Nature
            16.16.2.3. By End Use Application
            16.16.2.4. By Packaging Type
            16.16.2.5. By Distribution Channel
    16.17. New Zealand
        16.17.1. Pricing Analysis
        16.17.2. Market Share Analysis, 2022
            16.17.2.1. By Type
            16.17.2.2. By Nature
            16.17.2.3. By End Use Application
            16.17.2.4. By Packaging Type
            16.17.2.5. By Distribution Channel
    16.18. GCC Countries
        16.18.1. Pricing Analysis
        16.18.2. Market Share Analysis, 2022
            16.18.2.1. By Type
            16.18.2.2. By Nature
            16.18.2.3. By End Use Application
            16.18.2.4. By Packaging Type
            16.18.2.5. By Distribution Channel
    16.19. South Africa
        16.19.1. Pricing Analysis
        16.19.2. Market Share Analysis, 2022
            16.19.2.1. By Type
            16.19.2.2. By Nature
            16.19.2.3. By End Use Application
            16.19.2.4. By Packaging Type
            16.19.2.5. By Distribution Channel
    16.20. Israel
        16.20.1. Pricing Analysis
        16.20.2. Market Share Analysis, 2022
            16.20.2.1. By Type
            16.20.2.2. By Nature
            16.20.2.3. By End Use Application
            16.20.2.4. By Packaging Type
            16.20.2.5. By Distribution Channel
17. Market Structure Analysis
    17.1. Competition Dashboard
    17.2. Competition Benchmarking
    17.3. Market Share Analysis of Top Players
        17.3.1. By Regional
        17.3.2. By Type
        17.3.3. By Nature
        17.3.4. By End Use Application
        17.3.5. By Packaging Type
        17.3.6. By Distribution Channel
18. Competition Analysis
    18.1. Competition Deep Dive
        18.1.1. Now Foods
            18.1.1.1. Overview
            18.1.1.2. Product Portfolio
            18.1.1.3. Profitability by Market Segments
            18.1.1.4. Sales Footprint
            18.1.1.5. Strategy Overview
                18.1.1.5.1. Marketing Strategy
                18.1.1.5.2. Product Strategy
                18.1.1.5.3. Channel Strategy
        18.1.2. Synergy Natural
            18.1.2.1. Overview
            18.1.2.2. Product Portfolio
            18.1.2.3. Profitability by Market Segments
            18.1.2.4. Sales Footprint
            18.1.2.5. Strategy Overview
                18.1.2.5.1. Marketing Strategy
                18.1.2.5.2. Product Strategy
                18.1.2.5.3. Channel Strategy
        18.1.3. Dynamic Greens Wheatgrass Juice
            18.1.3.1. Overview
            18.1.3.2. Product Portfolio
            18.1.3.3. Profitability by Market Segments
            18.1.3.4. Sales Footprint
            18.1.3.5. Strategy Overview
                18.1.3.5.1. Marketing Strategy
                18.1.3.5.2. Product Strategy
                18.1.3.5.3. Channel Strategy
        18.1.4. Navitas Organics
            18.1.4.1. Overview
            18.1.4.2. Product Portfolio
            18.1.4.3. Profitability by Market Segments
            18.1.4.4. Sales Footprint
            18.1.4.5. Strategy Overview
                18.1.4.5.1. Marketing Strategy
                18.1.4.5.2. Product Strategy
                18.1.4.5.3. Channel Strategy
        18.1.5. My protein
            18.1.5.1. Overview
            18.1.5.2. Product Portfolio
            18.1.5.3. Profitability by Market Segments
            18.1.5.4. Sales Footprint
            18.1.5.5. Strategy Overview
                18.1.5.5.1. Marketing Strategy
                18.1.5.5.2. Product Strategy
                18.1.5.5.3. Channel Strategy
        18.1.6. Pines International, Inc.
            18.1.6.1. Overview
            18.1.6.2. Product Portfolio
            18.1.6.3. Profitability by Market Segments
            18.1.6.4. Sales Footprint
            18.1.6.5. Strategy Overview
                18.1.6.5.1. Marketing Strategy
                18.1.6.5.2. Product Strategy
                18.1.6.5.3. Channel Strategy
        18.1.7. Herbco International Inc
            18.1.7.1. Overview
            18.1.7.2. Product Portfolio
            18.1.7.3. Profitability by Market Segments
            18.1.7.4. Sales Footprint
            18.1.7.5. Strategy Overview
                18.1.7.5.1. Marketing Strategy
                18.1.7.5.2. Product Strategy
                18.1.7.5.3. Channel Strategy
        18.1.8. Nutriblade
            18.1.8.1. Overview
            18.1.8.2. Product Portfolio
            18.1.8.3. Profitability by Market Segments
            18.1.8.4. Sales Footprint
            18.1.8.5. Strategy Overview
                18.1.8.5.1. Marketing Strategy
                18.1.8.5.2. Product Strategy
                18.1.8.5.3. Channel Strategy
        18.1.9. Girmes Wheatgrass
            18.1.9.1. Overview
            18.1.9.2. Product Portfolio
            18.1.9.3. Profitability by Market Segments
            18.1.9.4. Sales Footprint
            18.1.9.5. Strategy Overview
                18.1.9.5.1. Marketing Strategy
                18.1.9.5.2. Product Strategy
                18.1.9.5.3. Channel Strategy
        18.1.10. E-Phamax
            18.1.10.1. Overview
            18.1.10.2. Product Portfolio
            18.1.10.3. Profitability by Market Segments
            18.1.10.4. Sales Footprint
            18.1.10.5. Strategy Overview
                18.1.10.5.1. Marketing Strategy
                18.1.10.5.2. Product Strategy
                18.1.10.5.3. Channel Strategy
        18.1.11. Terrasoul Superfoods
            18.1.11.1. Overview
            18.1.11.2. Product Portfolio
            18.1.11.3. Profitability by Market Segments
            18.1.11.4. Sales Footprint
            18.1.11.5. Strategy Overview
                18.1.11.5.1. Marketing Strategy
                18.1.11.5.2. Product Strategy
                18.1.11.5.3. Channel Strategy
        18.1.12. Naturya
            18.1.12.1. Overview
            18.1.12.2. Product Portfolio
            18.1.12.3. Profitability by Market Segments
            18.1.12.4. Sales Footprint
            18.1.12.5. Strategy Overview
                18.1.12.5.1. Marketing Strategy
                18.1.12.5.2. Product Strategy
                18.1.12.5.3. Channel Strategy
        18.1.13. ABE'S Organics
            18.1.13.1. Overview
            18.1.13.2. Product Portfolio
            18.1.13.3. Profitability by Market Segments
            18.1.13.4. Sales Footprint
            18.1.13.5. Strategy Overview
                18.1.13.5.1. Marketing Strategy
                18.1.13.5.2. Product Strategy
                18.1.13.5.3. Channel Strategy
        18.1.14. Nature Bell
            18.1.14.1. Overview
            18.1.14.2. Product Portfolio
            18.1.14.3. Profitability by Market Segments
            18.1.14.4. Sales Footprint
            18.1.14.5. Strategy Overview
                18.1.14.5.1. Marketing Strategy
                18.1.14.5.2. Product Strategy
                18.1.14.5.3. Channel Strategy
        18.1.15. Amazing Grass
            18.1.15.1. Overview
            18.1.15.2. Product Portfolio
            18.1.15.3. Profitability by Market Segments
            18.1.15.4. Sales Footprint
            18.1.15.5. Strategy Overview
                18.1.15.5.1. Marketing Strategy
                18.1.15.5.2. Product Strategy
                18.1.15.5.3. Channel Strategy
        18.1.16. Dr. Berg
            18.1.16.1. Overview
            18.1.16.2. Product Portfolio
            18.1.16.3. Profitability by Market Segments
            18.1.16.4. Sales Footprint
            18.1.16.5. Strategy Overview
                18.1.16.5.1. Marketing Strategy
                18.1.16.5.2. Product Strategy
                18.1.16.5.3. Channel Strategy
19. Assumptions & Acronyms Used
20. Research Methodology
Recommendations

Food and Beverage

Wheat Germ Oil Market

February 2024

REP-GB-2511

315 pages

Food and Beverage

Lactose-free Products Market

July 2023

REP-GB-15047

306 pages

Food and Beverage

Wheat Protein Market

January 2023

REP-GB-6395

333 pages

Food and Beverage

Soy Food Products Market

September 2022

REP-GB-105

250 pages

Explore Food and Beverage Insights

View Reports
Future Market Insights

Wheatgrass Products Market

Schedule a Call