Reports

- Global Locations -

Headquarters

Future Market Insights, Inc.

Christiana Corporate, 200
Continental Drive, Suite 401,
Newark, Delaware - 19713,
United States

T: +1-845-579-5705

Americas

Future Market Insights, Inc.

616 Corporate Way, Suite 2-9018,
Valley Cottage, NY 10989, United States

T: +1-347-918-3531

MEA

Future Market Insights

1602-6 Jumeirah Bay X2 Tower, Plot No: JLT-PH2-X2A,
Jumeirah Lakes Towers, Dubai,
United Arab Emirates

Europe

Future Market Insights

3rd Floor, 207 Regent Street,
W1B 3HH London
United Kingdom

T: + 44 (0) 20 8123 9659
D: +44 (0) 20 3287 4268

Asia Pacific

Future Market Insights

IndiaLand Global Tech Park, Unit UG-1, Behind Grand HighStreet, Phase 1, Hinjawadi, MH, Pune – 411057, India

Universal Milling Machine Market Outlook (2023 to 2033)

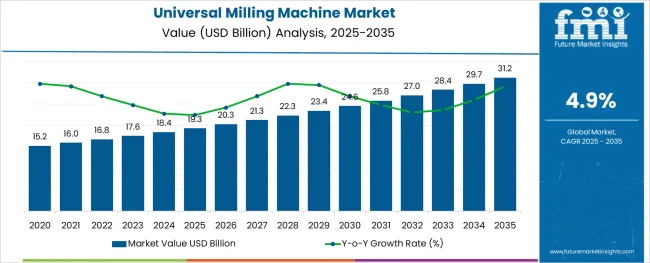
During the projected period (2023 to 2033), the global universal milling machine market is expected to grow at a CAGR of 4.9%. The market is set to surpass US$ 28,352.9 Million by the end of 2033. It is anticipated to reach a valuation of US$ 17,572.9 Million in 2023.

A universal milling machine is a machine that was primarily designed to perform a wide range of operations, including those involving polishing and sharpening tools. The machine's rotating fixture allows the table top to rotate at a precise angle, while the indexing head is useful for performing work on spiral surfaces.

An affordable type of universal milling machine is simple and is characterized by a dividing head with changing gears. This kind of machine can perform all kinds of milling operations such as smoothing surfaces to create fissures. An automatic tool changer allows a universal milling machine to be paired with all types of extremely simplified milling equipment.

The next type of universal milling machine comes with a changeable cutter head, enabling an individual to create various shapes of components. A high-quality machine can cost up to twice as much as a low-end machine. Thus, various companies nowadays prefer to purchase a used model.

However, the best alternative for one’s economic strategy is purchasing a well-priced used universal milling machine. These machines are capable of creating any component that a person needs at a superior rate.

Increasing disposable income, rising population, and easy availability of credit & financing in both developed and developing countries are projected to drive the demand for universal milling machines in the automotive industry. The market is also expected to grow at a considerable pace with high demand for commercial vehicles amid a flourishing passenger transport and logistics sector.

As per the International Organization of Motor Vehicle Manufacturers (OICA), in 2020, nearly 227082 commercial vehicles were produced in Germany, 1107532 in Japan, 6895604 in the USA, and 1048942 in Canada. High demand for light commercial vehicles (LCVs) on the back of ongoing expansion of the retail e-commerce industry is anticipated to drive the market.

Apart from that, vendors are nowadays focusing on untapped regional markets, including semi-urban and rural areas to enhance sales. Also, better financing and credit options are anticipated to support sales of universal milling machines in the next ten years.

According to the European Automobile Manufacturers Association (ACEA), in 2021, Europe accounted for around 22% of global passenger car sales. It is in the third position after Asia Pacific (48.2%) and the Americas (25.3%). Similarly, shares in the battery electric vehicles sector surged in the third quarter of 2022. Owing to the high demand for passenger cars and commercial vehicles, the need for universal milling machines is anticipated to surge in the assessment period.

Attributes Key Insights
Global Universal Milling Machine Market Estimated Size (2023E) US$ 17,572.9 Million
Projected Market Valuation (2033F) US$ 28,352.9 Million
Value-based CAGR (2023 to 2033) 4.9%
Market Share of the USA 32.7%

Don't pay for what you don't need

Customize your report by selecting specific countries or regions and save 30%!

2018 to 2022 Global Universal Milling Machine Market Outlook Compared to 2023 to 2033 Demand Forecast

According to a new report by Future Market Insights, the global universal milling machine market exhibited considerable growth at a CAGR of 4.0% during the historical period from 2018 to 2022. Increasing demand for technologically advanced mills, which is mainly being driven by rapid urbanization and industrialization is set to aid growth. Besides, the rapid expansion of the aviation and automotive industries is another crucial factor that would push sales of universal milling machines in the forecast period.

FMI states that the market is anticipated to exhibit growth at a CAGR of 4.9% in the evaluation period. Owing to increasing online activities among people, the demand for spare parts is anticipated to surge in the evaluation period. Significant improvements and technological advancements in the field of logistics would help producers to provide high-quality products quickly. Development of mobile purchasing platforms and online purchasing for automotive spare parts are also expected to boost the global universal milling market

.Universal Milling Machine Market

Market-o-nomics - Highlighting the Key Trends

A number of influential factors have been identified to stir the soup in the universal milling machine market. Besides the proliferating aspects prevailing in the market, lead analysts at FMI have also analyzed the restraining elements, lucrative opportunities, and upcoming threats that can pose a challenge to the progression of the universal milling machine market.

The drivers, restraints, opportunities, and threats (DROTs) identified are as follows:

DRIVERS

  • As engines have a shorter replacement cycle than their component equivalents, demand for the same is projected to grow, thereby pushing sales of universal milling machines.
  • Increasing demand for hybrid electric vehicles is likely to drive the need for specialist equipment and exhaust components, thus fueling demand.

RESTRAINTS

  • Compared to manual instruments, automated universal milling machines are more expensive, which may hamper sales.
  • Universal milling machines require workers who need proper training, and a lack of awareness programs in emerging nations may hinder growth.

OPPORTUNITIES

  • Automakers are set to spend more on the development of hatchbacks due to the ease of financing options, small sizes, and premium features, which would augment the demand for universal milling machines.
  • The advent of e-rickshaws in developing economies has pushed the need for unique spare parts, which would bolster companies spending on research activities.

THREATS

  • As universal milling machines start with a block of material and cut portions of it to form the finished part, they cause more material wastage than their traditional counterparts.
  • Universal milling machines are not appropriate for cutting radial cuts and they take up a lot of space, which would compel companies to go for rental services.
Nandini Roy Choudhury

Principal Consultant

Talk to Analyst

Find your sweet spots for generating winning opportunities in this market.

Country-wise Insights

How are Universal Milling Machine Firms Faring in the USA?

Increasing Demand for Electric Vehicles in the USA to Spur Sales of Universal Milling Head Machines

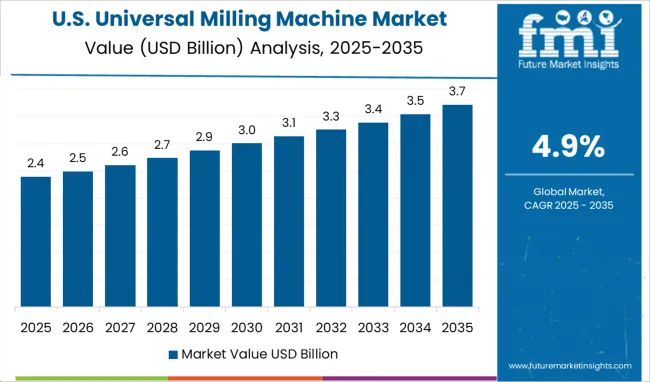
In the USA, the universal milling machine market is set to be affected by several factors. Expansion of the automotive industry is one of the major factors driving sales in the USA market. Increasing demand for electric vehicles to control pollution and global warming levels would augur well for the USA market in the evaluation period.

As per the International Energy Agency (IEA), nearly 13% of new cars sold in 2022 will be electric vehicles. In 2021, sales of electric vehicles nearly doubled to 6.6. million in 2021. Apart from that, rising demand for military equipment owing to political tension and enhancement of the Army’s strength is projected to fuel the USA market.

Will Universal Milling Machine Companies Gain New Growth Opportunities in India?

Universal Horizontal Milling Machines to Gain Impetus in India Amid Rising Automotive Manufacturing

A universal milling machine is a versatile piece of equipment that can be used for a wide variety of machining operations. India is a country with a rapidly growing manufacturing sector, and there is a high demand for universal milling machines. There are many opportunities for businesses to sell universal milling machines in India.

A universal milling machine is an important tool for many industries in India. The machine is used in the country to create various parts for everything- right from cars to airplanes. Besides, increasing production of automotive in the country is projected to drive the demand in the next ten years.

This provides ample opportunities for those who want to enter the field of milling machine manufacturing. There is a high demand for these machines from small- and medium-sized businesses. These businesses are looking for cost-effective ways to increase their production capacities. Universal milling machines are considered to be an ideal solution for these businesses.

Why is China Emerging as a High-potential Nation for Universal Milling Machine Companies?

Government Support to Accelerate ‘Made in China 2025’ Plan will Boost Sales of Universal Mill Grinders

Rising government investments in various sectors such as infrastructure and manufacturing in China are anticipated to drive the universal milling machine market during the evaluation period. The Chinese government has also been supporting the Made in China 2025 initiative, which primarily aims to expand the domestic manufacturing industry. Owing to the aforementioned factors, it is anticipated that demand for universal milling machines will increase significantly in China during the forecast period

Category-wise Insights

Which is the Highly Preferred Type of Universal Milling Machine across the Globe?

Demand for Automated Adjustable Universal Mill Grinders to Surge among Spare Parts Companies

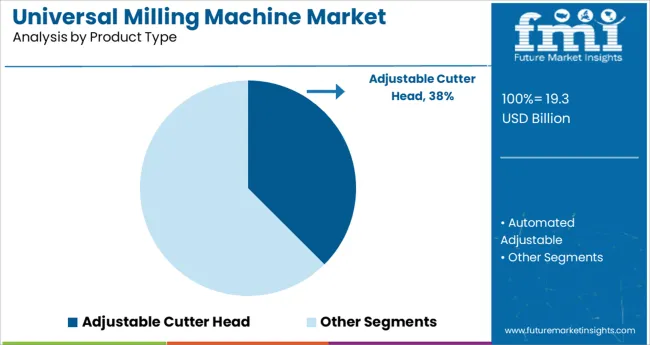
Based on product type, the automated adjustable segment is anticipated to remain at the forefront in the next ten years. This growth is attributed to the rising need for spare parts as the scrapping of engines and automobiles surges. Owing to strict norms in industrialized nations to control environmental pollution, scrap rates are high, which can result in the frequent replacement of motor vehicles, as well as their engines.

Besides, increasing the adoption of novel technologies to develop new engines such as hybrid engines would spur the growth of the segment. High demand for new vehicles with low fuel consumption, as well as rising government support to tighten emission standards is anticipated to push sales of automated adjustable universal milling machines with unique features.
Get the data you need at a Fraction of the cost

Personalize your report by choosing insights you need
and save 40%!

Competitive Landscape

The global universal milling machine market is highly competitive with the presence of a large number of manufacturers. Key players in the market are focusing on product innovation and development to gain a competitive edge. Some of the other manufacturers are also investing in research & development activities to expand their product portfolios. In addition, leading players are adopting various strategies such as mergers & acquisitions, partnerships, and joint ventures to gain a larger share of the market.

The competitive landscape of the universal milling machine market is expected to intensify in the next ten years with the entry of new players. New entrants are set to focus on offering innovative products and solutions to customers at competitive prices.

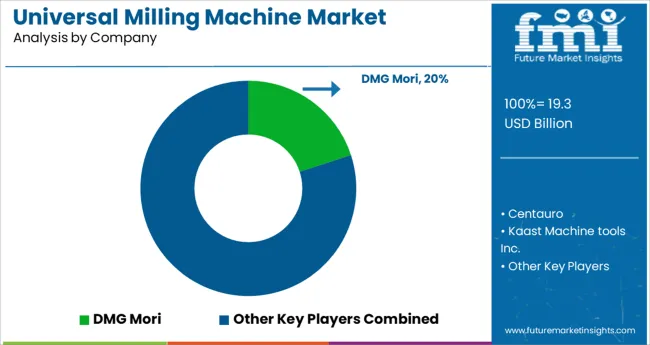
These players are investing heavily in research & development activities to come up with advanced products. Some of the key players in the global market are Centauro, Kaast Machine tools Inc., Shenzhen Joint Industry Co., Ltd, Knuth Machine tools, DMG Mori, and Kwality Machinery Export among others.

One of the leading players operating in the global market include:

  • Bhambar Automations Inc., which is an ISO 9001 Certified Unit founded and established by Mr. Gurjeet Singh Bhambar in 1962, is a manufacturer of high-quality milling machines and machining solutions. It provides automation and quality assurance services to its large client base. The company is based in Ludhiana and strives for continuous improvement in its quality management & production systems in accordance with real-time needs.

Scope of the Universal Milling Machine Market Report

Attribute Details
Estimated Market Size (2023) US$ 17,572.9 Million
Projected Market Valuation (2033) US$ 28,352.9 Million
Value-based CAGR (2023 to 2033) 4.9%
Forecast Period 2023 to 2033
Historical Data Available for 2018 to 2022
Market Analysis Value (US$ Million)
Key Regions Covered
  • North America
  • Latin America
  • Europe
  • Asia Pacific
  • Oceania
  • Middle East and Africa (MEA)
Key Countries Covered
  • USA
  • Canada
  • Mexico
  • Germany
  • UK
  • France
  • Italy
  • Spain
  • China
  • Japan
  • India
  • South Korea
  • Australia
  • Brazil
  • Argentina
  • South Africa
  • UAE
Key Segments Covered
  • Product Type
  • Number of Axis
  • Application
  • Region
Key Companies Profiled
Report Coverage Market Forecast, Company Share Analysis, Competitive Landscape, Drivers, Restraints, Opportunities and Threats Analysis, Market Dynamics and Challenges, and Strategic Growth Initiatives

Universal Milling Machine Market Outlook by Category

By Product Type:

  • Adjustable Cutter Head
  • Automated Adjustable

By Application:

  • Plastic Industry
  • Wood Industry
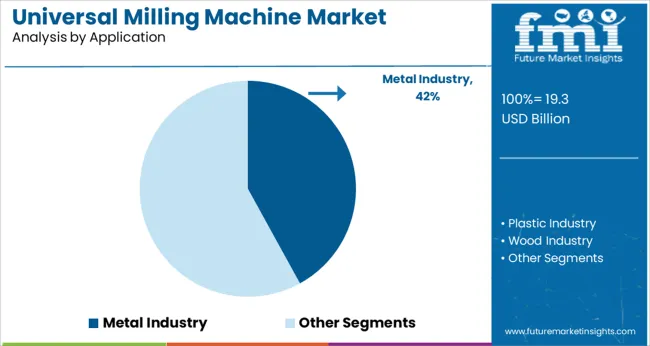
  • Metal Industry

By Number of Axis:

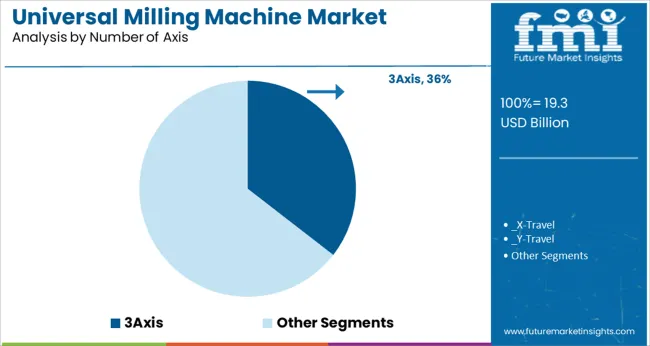
  • 3Axis
    • X-Travel
    • Y-Travel
    • Z-Travel

By Region:

  • North America
  • Latin America
  • Europe
  • East Asia
  • South Asia
  • Oceania
  • Middle East and Africa (MEA)

Frequently Asked Questions

How big is the universal milling machine market?

The universal milling machine market size is set to reach US$ 17,572.9 Million by the end of 2023.

At what rate is the universal milling machine market expected to rise?

The universal milling machine market is expected to rise at a CAGR of 4.9% in the forecast period.

What is the outlook of the market for universal milling machines in North America?

The North America universal milling machine market is expected to register an 38% CAGR between 2023 and 2033.

Which are the major countries driving demand for universal milling machines?

The USA, China, Canada, Germany, and Mexico are the major countries driving demand for universal milling machines.

At what rate will the demand for universal milling machines grow in China?

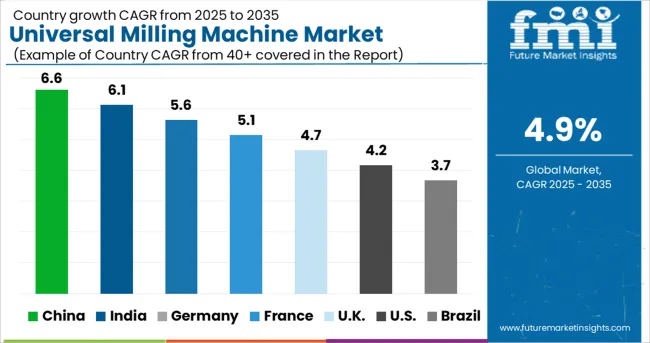
The China universal milling machine market is projected to grow at a CAGR of 5.7% in the forecast period.

At what rate will the sales of universal milling machines grow in the UK?

Sales of universal milling machines are projected to grow at a CAGR of 5.3% in the UK during the assessment period.

At what rate will sales of universal milling machines grow in India?

The India universal milling machine market is projected to grow at a CAGR of 6.3% in the evaluation period.

At what rate will sales of universal milling machines grow in the USA?

Sales of universal milling machines in Europe is expected to grow at 32.7% CAGR in 2023.

At what rate will the demand for universal milling machines grow in Japan?

The demand for universal milling machines in Japan is expected to grow at 8.0% CAGR in 2023.

At what rate will the demand for universal milling machines grow in Australia?

The demand for universal milling machines in Australia is expected to grow at 2.7% CAGR in 2023.

What is the demand outlook forecast for the universal milling machine market?

The global universal milling machine market is estimated to surpass US$ 28,352.9 Million by the end of 2033.

Table of Content

1. Executive Summary | Universal Milling Machine Market

    1.1. Global Market Outlook

    1.2. Demand-side Trends

    1.3. Supply-side Trends

    1.4. Technology Roadmap Analysis

    1.5. Analysis and Recommendations

2. Market Overview

    2.1. Market Coverage / Taxonomy

    2.2. Market Definition / Scope / Limitations

3. Market Background

    3.1. Market Dynamics

        3.1.1. Drivers

        3.1.2. Restraints

        3.1.3. Opportunity

        3.1.4. Trends

    3.2. Scenario Forecast

        3.2.1. Demand in Optimistic Scenario

        3.2.2. Demand in Likely Scenario

        3.2.3. Demand in Conservative Scenario

    3.3. Product launches & Recent Developments

    3.4. Product Life Cycle Analysis

    3.5. Value Chain Analysis

        3.5.1. Supply Side Participants and their Roles

            3.5.1.1. Producers

            3.5.1.2. Mid-Level Participants (Traders/ Agents/ Brokers)

            3.5.1.3. Wholesalers and Distributors

        3.5.2. % of Operating Margin Analysis

        3.5.3. List of Raw Material Suppliers

        3.5.4. List of Existing and Potential Buyers

    3.6. Global Market - Pricing Analysis

        3.6.1. Price Point Assessment by Region

        3.6.2. Price Point Assessment by Product Type

        3.6.3. Price Forecast till 2033

        3.6.4. Factors affecting pricing

    3.7. Forecast Factors - Relevance & Impact

    3.8. PESTLE and Porter’s Analysis

    3.9. Regulatory Landscape

        3.9.1. Packaging & Labelling Regulations

        3.9.2. Certifications and Certifying Agency Overview

        3.9.3. Import/Export Policies

    3.10. Regional Parent Market Outlook

    3.11. Production and Consumption Statistics

    3.12. Import and Export Statistics

    3.13. Consumers Survey Analysis

    3.14. Macro-Economic Factors

    3.15. Product Claims & Nutritional Information scanned by Buyers

4. Global Market Analysis 2018 to 2022 and Forecast, 2023 to 2033

    4.1. Historical Market Size Value (US$ Million) & Volume (MT) Analysis, 2018 to 2022

    4.2. Current and Future Market Size Value (US$ Million) & Volume (MT) Projections, 2023 to 2033

        4.2.1. Y-o-Y Growth Trend Analysis

        4.2.2. Absolute $ Opportunity Analysis

5. Global Market Analysis 2018 to 2022 and Forecast 2023 to 2033, By Product Type

    5.1. Introduction / Key Findings

    5.2. Historical Market Size Value (US$ Million) & Volume (MT) Analysis By Product Type, 2018 to 2022

    5.3. Current and Future Market Size Value (US$ Million) & Volume (MT) Analysis and Forecast By Product Type, 2023 to 2033

        5.3.1. Adjustable Cutter Head

        5.3.2. Automated Adjustable

    5.4. Y-o-Y Growth Trend Analysis By Product Type, 2018 to 2022

    5.5. Absolute $ Opportunity Analysis By Product Type, 2023 to 2033

6. Global Market Analysis 2018 to 2022 and Forecast 2023 to 2033, By Application

    6.1. Introduction / Key Findings

    6.2. Historical Market Size Value (US$ Million) & Volume (MT) Analysis By Application, 2018 to 2022

    6.3. Current and Future Market Size Value (US$ Million) & Volume (MT) Analysis and Forecast By Application, 2023 to 2033

        6.3.1. Plastic Industry

        6.3.2. Wood Industry

        6.3.3. Metal Industry

    6.4. Y-o-Y Growth Trend Analysis By Application, 2018 to 2022

    6.5. Absolute $ Opportunity Analysis By Application, 2023 to 2033

7. Global Market Analysis 2018 to 2022 and Forecast 2023 to 2033, By Number of Axis

    7.1. Introduction / Key Findings

    7.2. Historical Market Size Value (US$ Million) & Volume (MT) Analysis By Number of Axis, 2018 to 2022

    7.3. Current and Future Market Size Value (US$ Million) & Volume (MT) Analysis and Forecast By Number of Axis, 2023 to 2033

        7.3.1. 3Axis

            7.3.1.1. X-Travel

            7.3.1.2. Y-Travel

            7.3.1.3. Z-Travel

    7.4. Y-o-Y Growth Trend Analysis By Number of Axis, 2018 to 2022

    7.5. Absolute $ Opportunity Analysis By Number of Axis, 2023 to 2033

8. Global Market Analysis 2018 to 2022 and Forecast 2023 to 2033, By Region

    8.1. Introduction

    8.2. Historical Market Size Value (US$ Million) & Volume (MT) Analysis By Region, 2018 to 2022

    8.3. Current Market Size Value (US$ Million) & Volume (MT) Analysis and Forecast By Region, 2023 to 2033

        8.3.1. North America

        8.3.2. Latin America

        8.3.3. Europe

        8.3.4. East Asia

        8.3.5. South Asia

        8.3.6. Oceania

        8.3.7. Middle East and Africa (MEA)

    8.4. Market Attractiveness Analysis By Region

9. North America Market Analysis 2018 to 2022 and Forecast 2023 to 2033, By Country

    9.1. Historical Market Size Value (US$ Million) & Volume (MT) Trend Analysis By Market Taxonomy, 2018 to 2022

    9.2. Market Size Value (US$ Million) & Volume (MT) Forecast By Market Taxonomy, 2023 to 2033

        9.2.1. By Country

            9.2.1.1. United States of America

            9.2.1.2. Canada

        9.2.2. By Product Type

        9.2.3. By Application

        9.2.4. By Number of Axis

    9.3. Market Attractiveness Analysis

        9.3.1. By Country

        9.3.2. By Product Type

        9.3.3. By Application

        9.3.4. By Number of Axis

    9.4. Key Takeaways

10. Latin America Market Analysis 2018 to 2022 and Forecast 2023 to 2033, By Country

    10.1. Historical Market Size Value (US$ Million) & Volume (MT) Trend Analysis By Market Taxonomy, 2018 to 2022

    10.2. Market Size Value (US$ Million) & Volume (MT) Forecast By Market Taxonomy, 2023 to 2033

        10.2.1. By Country

            10.2.1.1. Brazil

            10.2.1.2. Mexico

            10.2.1.3. Argentina

            10.2.1.4. Chile

            10.2.1.5. Peru

            10.2.1.6. Rest of Latin America

        10.2.2. By Product Type

        10.2.3. By Application

        10.2.4. By Number of Axis

    10.3. Market Attractiveness Analysis

        10.3.1. By Country

        10.3.2. By Product Type

        10.3.3. By Application

        10.3.4. By Number of Axis

    10.4. Key Takeaways

11. Europe Market Analysis 2018 to 2022 and Forecast 2023 to 2033, By Country

    11.1. Historical Market Size Value (US$ Million) & Volume (MT) Trend Analysis By Market Taxonomy, 2018 to 2022

    11.2. Market Size Value (US$ Million) & Volume (MT) Forecast By Market Taxonomy, 2023 to 2033

        11.2.1. By Country

            11.2.1.1. Germany

            11.2.1.2. Italy

            11.2.1.3. France

            11.2.1.4. United Kingdom

            11.2.1.5. Spain

            11.2.1.6. Russia

            11.2.1.7. BENELUX

            11.2.1.8. Poland

            11.2.1.9. Nordic Countries

            11.2.1.10. Rest of Europe

        11.2.2. By Product Type

        11.2.3. By Application

        11.2.4. By Number of Axis

    11.3. Market Attractiveness Analysis

        11.3.1. By Country

        11.3.2. By Product Type

        11.3.3. By Application

        11.3.4. By Number of Axis

    11.4. Key Takeaways

12. East Asia Market Analysis 2018 to 2022 and Forecast 2023 to 2033, By Country

    12.1. Historical Market Size Value (US$ Million) & Volume (MT) Trend Analysis By Market Taxonomy, 2018 to 2022

    12.2. Market Size Value (US$ Million) & Volume (MT) Forecast By Market Taxonomy, 2023 to 2033

        12.2.1. By Country

            12.2.1.1. China

            12.2.1.2. Japan

            12.2.1.3. South Korea

        12.2.2. By Product Type

        12.2.3. By Application

        12.2.4. By Number of Axis

    12.3. Market Attractiveness Analysis

        12.3.1. By Country

        12.3.2. By Product Type

        12.3.3. By Application

        12.3.4. By Number of Axis

    12.4. Key Takeaways

13. South Asia Market Analysis 2018 to 2022 and Forecast 2023 to 2033, By Country

    13.1. Historical Market Size Value (US$ Million) & Volume (MT) Trend Analysis By Market Taxonomy, 2018 to 2022

    13.2. Market Size Value (US$ Million) & Volume (MT) Forecast By Market Taxonomy, 2023 to 2033

        13.2.1. By Country

            13.2.1.1. India

            13.2.1.2. Thailand

            13.2.1.3. Malaysia

            13.2.1.4. Indonesia

            13.2.1.5. Singapore

            13.2.1.6. Rest of South Asia

        13.2.2. By Product Type

        13.2.3. By Application

        13.2.4. By Number of Axis

    13.3. Market Attractiveness Analysis

        13.3.1. By Country

        13.3.2. By Product Type

        13.3.3. By Application

        13.3.4. By Number of Axis

    13.4. Key Takeaways

14. Oceania Market Analysis 2018 to 2022 and Forecast 2023 to 2033, By Country

    14.1. Historical Market Size Value (US$ Million) & Volume (MT) Trend Analysis By Market Taxonomy, 2018 to 2022

    14.2. Market Size Value (US$ Million) & Volume (MT) Forecast By Market Taxonomy, 2023 to 2033

        14.2.1. By Country

            14.2.1.1. Australia

            14.2.1.2. New Zealand

        14.2.2. By Product Type

        14.2.3. By Application

        14.2.4. By Number of Axis

    14.3. Market Attractiveness Analysis

        14.3.1. By Country

        14.3.2. By Product Type

        14.3.3. By Application

        14.3.4. By Number of Axis

    14.4. Key Takeaways

15. MEA Market Analysis 2018 to 2022 and Forecast 2023 to 2033, By Country

    15.1. Historical Market Size Value (US$ Million) & Volume (MT) Trend Analysis By Market Taxonomy, 2018 to 2022

    15.2. Market Size Value (US$ Million) & Volume (MT) Forecast By Market Taxonomy, 2023 to 2033

        15.2.1. By Country

            15.2.1.1. GCC Countries

            15.2.1.2. South Africa

            15.2.1.3. Central Africa

            15.2.1.4. North Africa

        15.2.2. By Product Type

        15.2.3. By Application

        15.2.4. By Number of Axis

    15.3. Market Attractiveness Analysis

        15.3.1. By Country

        15.3.2. By Product Type

        15.3.3. By Application

        15.3.4. By Number of Axis

    15.4. Key Takeaways

16. Key Countries Market Analysis

    16.1.United States of America

        16.1.1. Pricing Analysis

        16.1.2. Market Share Analysis, 2022

            16.1.2.1. By Product Type

            16.1.2.2. By Application

            16.1.2.3. By Number of Axis

    16.2. Canada

        16.2.1. Pricing Analysis

        16.2.2. Market Share Analysis, 2022

            16.2.2.1. By Product Type

            16.2.2.2. By Application

            16.2.2.3. By Number of Axis

    16.3. Brazil

        16.3.1. Pricing Analysis

        16.3.2. Market Share Analysis, 2022

            16.3.2.1. By Product Type

            16.3.2.2. By Application

            16.3.2.3. By Number of Axis

    16.4. Mexico

        16.4.1. Pricing Analysis

        16.4.2. Market Share Analysis, 2022

            16.4.2.1. By Product Type

            16.4.2.2. By Application

            16.4.2.3. By Number of Axis

    16.5. Argentina

        16.5.1. Pricing Analysis

        16.5.2. Market Share Analysis, 2022

            16.5.2.1. By Product Type

            16.5.2.2. By Application

            16.5.2.3. By Number of Axis

    16.6. Chile

        16.6.1. Pricing Analysis

        16.6.2. Market Share Analysis, 2022

            16.6.2.1. By Product Type

            16.6.2.2. By Application

            16.6.2.3. By Number of Axis

    16.7. Peru

        16.7.1. Pricing Analysis

        16.7.2. Market Share Analysis, 2022

            16.7.2.1. By Product Type

            16.7.2.2. By Application

            16.7.2.3. By Number of Axis

    16.8. Germany

        16.8.1. Pricing Analysis

        16.8.2. Market Share Analysis, 2022

            16.8.2.1. By Product Type

            16.8.2.2. By Application

            16.8.2.3. By Number of Axis

    16.9. Italy

        16.9.1. Pricing Analysis

        16.9.2. Market Share Analysis, 2022

            16.9.2.1. By Product Type

            16.9.2.2. By Application

            16.9.2.3. By Number of Axis

    16.10. France

        16.10.1. Pricing Analysis

        16.10.2. Market Share Analysis, 2022

            16.10.2.1. By Product Type

            16.10.2.2. By Application

            16.10.2.3. By Number of Axis

    16.11. Spain

        16.11.1. Pricing Analysis

        16.11.2. Market Share Analysis, 2022

            16.11.2.1. By Product Type

            16.11.2.2. By Application

            16.11.2.3. By Number of Axis

    16.12.United Kingdom

        16.12.1. Pricing Analysis

        16.12.2. Market Share Analysis, 2022

            16.12.2.1. By Product Type

            16.12.2.2. By Application

            16.12.2.3. By Number of Axis

    16.13. Russia

        16.13.1. Pricing Analysis

        16.13.2. Market Share Analysis, 2022

            16.13.2.1. By Product Type

            16.13.2.2. By Application

            16.13.2.3. By Number of Axis

    16.14. Poland

        16.14.1. Pricing Analysis

        16.14.2. Market Share Analysis, 2022

            16.14.2.1. By Product Type

            16.14.2.2. By Application

            16.14.2.3. By Number of Axis

    16.15. BENELUX

        16.15.1. Pricing Analysis

        16.15.2. Market Share Analysis, 2022

            16.15.2.1. By Product Type

            16.15.2.2. By Application

            16.15.2.3. By Number of Axis

    16.16. Nordic Countries

        16.16.1. Pricing Analysis

        16.16.2. Market Share Analysis, 2022

            16.16.2.1. By Product Type

            16.16.2.2. By Application

            16.16.2.3. By Number of Axis

    16.17. China

        16.17.1. Pricing Analysis

        16.17.2. Market Share Analysis, 2022

            16.17.2.1. By Product Type

            16.17.2.2. By Application

            16.17.2.3. By Number of Axis

    16.18. Japan

        16.18.1. Pricing Analysis

        16.18.2. Market Share Analysis, 2022

            16.18.2.1. By Product Type

            16.18.2.2. By Application

            16.18.2.3. By Number of Axis

    16.19. South Korea

        16.19.1. Pricing Analysis

        16.19.2. Market Share Analysis, 2022

            16.19.2.1. By Product Type

            16.19.2.2. By Application

            16.19.2.3. By Number of Axis

    16.20. India

        16.20.1. Pricing Analysis

        16.20.2. Market Share Analysis, 2022

            16.20.2.1. By Product Type

            16.20.2.2. By Application

            16.20.2.3. By Number of Axis

    16.21. Thailand

        16.21.1. Pricing Analysis

        16.21.2. Market Share Analysis, 2022

            16.21.2.1. By Product Type

            16.21.2.2. By Application

            16.21.2.3. By Number of Axis

    16.22. Indonesia

        16.22.1. Pricing Analysis

        16.22.2. Market Share Analysis, 2022

            16.22.2.1. By Product Type

            16.22.2.2. By Application

            16.22.2.3. By Number of Axis

    16.23. Malaysia

        16.23.1. Pricing Analysis

        16.23.2. Market Share Analysis, 2022

            16.23.2.1. By Product Type

            16.23.2.2. By Application

            16.23.2.3. By Number of Axis

    16.24. Singapore

        16.24.1. Pricing Analysis

        16.24.2. Market Share Analysis, 2022

            16.24.2.1. By Product Type

            16.24.2.2. By Application

            16.24.2.3. By Number of Axis

    16.25. Australia

        16.25.1. Pricing Analysis

        16.25.2. Market Share Analysis, 2022

            16.25.2.1. By Product Type

            16.25.2.2. By Application

            16.25.2.3. By Number of Axis

    16.26. New Zealand

        16.26.1. Pricing Analysis

        16.26.2. Market Share Analysis, 2022

            16.26.2.1. By Product Type

            16.26.2.2. By Application

            16.26.2.3. By Number of Axis

    16.27. GCC Countries

        16.27.1. Pricing Analysis

        16.27.2. Market Share Analysis, 2022

            16.27.2.1. By Product Type

            16.27.2.2. By Application

            16.27.2.3. By Number of Axis

    16.28. South Africa

        16.28.1. Pricing Analysis

        16.28.2. Market Share Analysis, 2022

            16.28.2.1. By Product Type

            16.28.2.2. By Application

            16.28.2.3. By Number of Axis

    16.29. North Africa

        16.29.1. Pricing Analysis

        16.29.2. Market Share Analysis, 2022

            16.29.2.1. By Product Type

            16.29.2.2. By Application

            16.29.2.3. By Number of Axis

    16.30. Central Africa

        16.30.1. Pricing Analysis

        16.30.2. Market Share Analysis, 2022

            16.30.2.1. By Product Type

            16.30.2.2. By Application

            16.30.2.3. By Number of Axis

17. Market Structure Analysis

    17.1. Competition Dashboard

    17.2. Competition Benchmarking

    17.3. Market Share Analysis of Top Players

        17.3.1. By Regional

        17.3.2. By Product Type

        17.3.3. By Application

        17.3.4. By Number of Axis

18. Competition Analysis

    18.1. Competition Deep Dive

        18.1.1. Centauro

            18.1.1.1. Overview

            18.1.1.2. Product Portfolio

            18.1.1.3. Profitability by Market Segments (Product/Age /Sales Channel/Region)

            18.1.1.4. Sales Footprint

            18.1.1.5. Strategy Overview

                18.1.1.5.1. Marketing Strategy

                18.1.1.5.2. Product Strategy

                18.1.1.5.3. Channel Strategy

        18.1.2. Kaast Machine tools Inc.

            18.1.2.1. Overview

            18.1.2.2. Product Portfolio

            18.1.2.3. Profitability by Market Segments (Product/Age /Sales Channel/Region)

            18.1.2.4. Sales Footprint

            18.1.2.5. Strategy Overview

                18.1.2.5.1. Marketing Strategy

                18.1.2.5.2. Product Strategy

                18.1.2.5.3. Channel Strategy

        18.1.3. Shenzhen Joint Industry Co., Ltd

            18.1.3.1. Overview

            18.1.3.2. Product Portfolio

            18.1.3.3. Profitability by Market Segments (Product/Age /Sales Channel/Region)

            18.1.3.4. Sales Footprint

            18.1.3.5. Strategy Overview

                18.1.3.5.1. Marketing Strategy

                18.1.3.5.2. Product Strategy

                18.1.3.5.3. Channel Strategy

        18.1.4. Knuth Machine tools

            18.1.4.1. Overview

            18.1.4.2. Product Portfolio

            18.1.4.3. Profitability by Market Segments (Product/Age /Sales Channel/Region)

            18.1.4.4. Sales Footprint

            18.1.4.5. Strategy Overview

                18.1.4.5.1. Marketing Strategy

                18.1.4.5.2. Product Strategy

                18.1.4.5.3. Channel Strategy

        18.1.5. DMG Mori

            18.1.5.1. Overview

            18.1.5.2. Product Portfolio

            18.1.5.3. Profitability by Market Segments (Product/Age /Sales Channel/Region)

            18.1.5.4. Sales Footprint

            18.1.5.5. Strategy Overview

                18.1.5.5.1. Marketing Strategy

                18.1.5.5.2. Product Strategy

                18.1.5.5.3. Channel Strategy

        18.1.6. Kwality Machinery Export

            18.1.6.1. Overview

            18.1.6.2. Product Portfolio

            18.1.6.3. Profitability by Market Segments (Product/Age /Sales Channel/Region)

            18.1.6.4. Sales Footprint

            18.1.6.5. Strategy Overview

                18.1.6.5.1. Marketing Strategy

                18.1.6.5.2. Product Strategy

                18.1.6.5.3. Channel Strategy

19. Assumptions & Acronyms Used

20. Research Methodology

Don't pay for what you don't need

Customize your report by selecting specific countries or regions and save 30%!

List of Tables

Table 1: Global Market Value (US$ Million) Forecast by Region, 2018 to 2033

Table 2: Global Market Volume (MT) Forecast by Region, 2018 to 2033

Table 3: Global Market Value (US$ Million) Forecast by Product Type, 2018 to 2033

Table 4: Global Market Volume (MT) Forecast by Product Type, 2018 to 2033

Table 5: Global Market Value (US$ Million) Forecast by Application, 2018 to 2033

Table 6: Global Market Volume (MT) Forecast by Application, 2018 to 2033

Table 7: Global Market Value (US$ Million) Forecast by Number of Axis, 2018 to 2033

Table 8: Global Market Volume (MT) Forecast by Number of Axis, 2018 to 2033

Table 9: North America Market Value (US$ Million) Forecast by Country, 2018 to 2033

Table 10: North America Market Volume (MT) Forecast by Country, 2018 to 2033

Table 11: North America Market Value (US$ Million) Forecast by Product Type, 2018 to 2033

Table 12: North America Market Volume (MT) Forecast by Product Type, 2018 to 2033

Table 13: North America Market Value (US$ Million) Forecast by Application, 2018 to 2033

Table 14: North America Market Volume (MT) Forecast by Application, 2018 to 2033

Table 15: North America Market Value (US$ Million) Forecast by Number of Axis, 2018 to 2033

Table 16: North America Market Volume (MT) Forecast by Number of Axis, 2018 to 2033

Table 17: Latin America Market Value (US$ Million) Forecast by Country, 2018 to 2033

Table 18: Latin America Market Volume (MT) Forecast by Country, 2018 to 2033

Table 19: Latin America Market Value (US$ Million) Forecast by Product Type, 2018 to 2033

Table 20: Latin America Market Volume (MT) Forecast by Product Type, 2018 to 2033

Table 21: Latin America Market Value (US$ Million) Forecast by Application, 2018 to 2033

Table 22: Latin America Market Volume (MT) Forecast by Application, 2018 to 2033

Table 23: Latin America Market Value (US$ Million) Forecast by Number of Axis, 2018 to 2033

Table 24: Latin America Market Volume (MT) Forecast by Number of Axis, 2018 to 2033

Table 25: Europe Market Value (US$ Million) Forecast by Country, 2018 to 2033

Table 26: Europe Market Volume (MT) Forecast by Country, 2018 to 2033

Table 27: Europe Market Value (US$ Million) Forecast by Product Type, 2018 to 2033

Table 28: Europe Market Volume (MT) Forecast by Product Type, 2018 to 2033

Table 29: Europe Market Value (US$ Million) Forecast by Application, 2018 to 2033

Table 30: Europe Market Volume (MT) Forecast by Application, 2018 to 2033

Table 31: Europe Market Value (US$ Million) Forecast by Number of Axis, 2018 to 2033

Table 32: Europe Market Volume (MT) Forecast by Number of Axis, 2018 to 2033

Table 33: East Asia Market Value (US$ Million) Forecast by Country, 2018 to 2033

Table 34: East Asia Market Volume (MT) Forecast by Country, 2018 to 2033

Table 35: East Asia Market Value (US$ Million) Forecast by Product Type, 2018 to 2033

Table 36: East Asia Market Volume (MT) Forecast by Product Type, 2018 to 2033

Table 37: East Asia Market Value (US$ Million) Forecast by Application, 2018 to 2033

Table 38: East Asia Market Volume (MT) Forecast by Application, 2018 to 2033

Table 39: East Asia Market Value (US$ Million) Forecast by Number of Axis, 2018 to 2033

Table 40: East Asia Market Volume (MT) Forecast by Number of Axis, 2018 to 2033

Table 41: South Asia Market Value (US$ Million) Forecast by Country, 2018 to 2033

Table 42: South Asia Market Volume (MT) Forecast by Country, 2018 to 2033

Table 43: South Asia Market Value (US$ Million) Forecast by Product Type, 2018 to 2033

Table 44: South Asia Market Volume (MT) Forecast by Product Type, 2018 to 2033

Table 45: South Asia Market Value (US$ Million) Forecast by Application, 2018 to 2033

Table 46: South Asia Market Volume (MT) Forecast by Application, 2018 to 2033

Table 47: South Asia Market Value (US$ Million) Forecast by Number of Axis, 2018 to 2033

Table 48: South Asia Market Volume (MT) Forecast by Number of Axis, 2018 to 2033

Table 49: Oceania Market Value (US$ Million) Forecast by Country, 2018 to 2033

Table 50: Oceania Market Volume (MT) Forecast by Country, 2018 to 2033

Table 51: Oceania Market Value (US$ Million) Forecast by Product Type, 2018 to 2033

Table 52: Oceania Market Volume (MT) Forecast by Product Type, 2018 to 2033

Table 53: Oceania Market Value (US$ Million) Forecast by Application, 2018 to 2033

Table 54: Oceania Market Volume (MT) Forecast by Application, 2018 to 2033

Table 55: Oceania Market Value (US$ Million) Forecast by Number of Axis, 2018 to 2033

Table 56: Oceania Market Volume (MT) Forecast by Number of Axis, 2018 to 2033

Table 57: MEA Market Value (US$ Million) Forecast by Country, 2018 to 2033

Table 58: MEA Market Volume (MT) Forecast by Country, 2018 to 2033

Table 59: MEA Market Value (US$ Million) Forecast by Product Type, 2018 to 2033

Table 60: MEA Market Volume (MT) Forecast by Product Type, 2018 to 2033

Table 61: MEA Market Value (US$ Million) Forecast by Application, 2018 to 2033

Table 62: MEA Market Volume (MT) Forecast by Application, 2018 to 2033

Table 63: MEA Market Value (US$ Million) Forecast by Number of Axis, 2018 to 2033

Table 64: MEA Market Volume (MT) Forecast by Number of Axis, 2018 to 2033
Nandini Roy Choudhury

Principal Consultant

Talk to Analyst

Find your sweet spots for generating winning opportunities in this market.

List of Charts

Figure 1: Global Market Value (US$ Million) by Product Type, 2023 to 2033

Figure 2: Global Market Value (US$ Million) by Application, 2023 to 2033

Figure 3: Global Market Value (US$ Million) by Number of Axis, 2023 to 2033

Figure 4: Global Market Value (US$ Million) by Region, 2023 to 2033

Figure 5: Global Market Value (US$ Million) Analysis by Region, 2018 to 2033

Figure 6: Global Market Volume (MT) Analysis by Region, 2018 to 2033

Figure 7: Global Market Value Share (%) and BPS Analysis by Region, 2023 to 2033

Figure 8: Global Market Y-o-Y Growth (%) Projections by Region, 2023 to 2033

Figure 9: Global Market Value (US$ Million) Analysis by Product Type, 2018 to 2033

Figure 10: Global Market Volume (MT) Analysis by Product Type, 2018 to 2033

Figure 11: Global Market Value Share (%) and BPS Analysis by Product Type, 2023 to 2033

Figure 12: Global Market Y-o-Y Growth (%) Projections by Product Type, 2023 to 2033

Figure 13: Global Market Value (US$ Million) Analysis by Application, 2018 to 2033

Figure 14: Global Market Volume (MT) Analysis by Application, 2018 to 2033

Figure 15: Global Market Value Share (%) and BPS Analysis by Application, 2023 to 2033

Figure 16: Global Market Y-o-Y Growth (%) Projections by Application, 2023 to 2033

Figure 17: Global Market Value (US$ Million) Analysis by Number of Axis, 2018 to 2033

Figure 18: Global Market Volume (MT) Analysis by Number of Axis, 2018 to 2033

Figure 19: Global Market Value Share (%) and BPS Analysis by Number of Axis, 2023 to 2033

Figure 20: Global Market Y-o-Y Growth (%) Projections by Number of Axis, 2023 to 2033

Figure 21: Global Market Attractiveness by Product Type, 2023 to 2033

Figure 22: Global Market Attractiveness by Application, 2023 to 2033

Figure 23: Global Market Attractiveness by Number of Axis, 2023 to 2033

Figure 24: Global Market Attractiveness by Region, 2023 to 2033

Figure 25: North America Market Value (US$ Million) by Product Type, 2023 to 2033

Figure 26: North America Market Value (US$ Million) by Application, 2023 to 2033

Figure 27: North America Market Value (US$ Million) by Number of Axis, 2023 to 2033

Figure 28: North America Market Value (US$ Million) by Country, 2023 to 2033

Figure 29: North America Market Value (US$ Million) Analysis by Country, 2018 to 2033

Figure 30: North America Market Volume (MT) Analysis by Country, 2018 to 2033

Figure 31: North America Market Value Share (%) and BPS Analysis by Country, 2023 to 2033

Figure 32: North America Market Y-o-Y Growth (%) Projections by Country, 2023 to 2033

Figure 33: North America Market Value (US$ Million) Analysis by Product Type, 2018 to 2033

Figure 34: North America Market Volume (MT) Analysis by Product Type, 2018 to 2033

Figure 35: North America Market Value Share (%) and BPS Analysis by Product Type, 2023 to 2033

Figure 36: North America Market Y-o-Y Growth (%) Projections by Product Type, 2023 to 2033

Figure 37: North America Market Value (US$ Million) Analysis by Application, 2018 to 2033

Figure 38: North America Market Volume (MT) Analysis by Application, 2018 to 2033

Figure 39: North America Market Value Share (%) and BPS Analysis by Application, 2023 to 2033

Figure 40: North America Market Y-o-Y Growth (%) Projections by Application, 2023 to 2033

Figure 41: North America Market Value (US$ Million) Analysis by Number of Axis, 2018 to 2033

Figure 42: North America Market Volume (MT) Analysis by Number of Axis, 2018 to 2033

Figure 43: North America Market Value Share (%) and BPS Analysis by Number of Axis, 2023 to 2033

Figure 44: North America Market Y-o-Y Growth (%) Projections by Number of Axis, 2023 to 2033

Figure 45: North America Market Attractiveness by Product Type, 2023 to 2033

Figure 46: North America Market Attractiveness by Application, 2023 to 2033

Figure 47: North America Market Attractiveness by Number of Axis, 2023 to 2033

Figure 48: North America Market Attractiveness by Country, 2023 to 2033

Figure 49: Latin America Market Value (US$ Million) by Product Type, 2023 to 2033

Figure 50: Latin America Market Value (US$ Million) by Application, 2023 to 2033

Figure 51: Latin America Market Value (US$ Million) by Number of Axis, 2023 to 2033

Figure 52: Latin America Market Value (US$ Million) by Country, 2023 to 2033

Figure 53: Latin America Market Value (US$ Million) Analysis by Country, 2018 to 2033

Figure 54: Latin America Market Volume (MT) Analysis by Country, 2018 to 2033

Figure 55: Latin America Market Value Share (%) and BPS Analysis by Country, 2023 to 2033

Figure 56: Latin America Market Y-o-Y Growth (%) Projections by Country, 2023 to 2033

Figure 57: Latin America Market Value (US$ Million) Analysis by Product Type, 2018 to 2033

Figure 58: Latin America Market Volume (MT) Analysis by Product Type, 2018 to 2033

Figure 59: Latin America Market Value Share (%) and BPS Analysis by Product Type, 2023 to 2033

Figure 60: Latin America Market Y-o-Y Growth (%) Projections by Product Type, 2023 to 2033

Figure 61: Latin America Market Value (US$ Million) Analysis by Application, 2018 to 2033

Figure 62: Latin America Market Volume (MT) Analysis by Application, 2018 to 2033

Figure 63: Latin America Market Value Share (%) and BPS Analysis by Application, 2023 to 2033

Figure 64: Latin America Market Y-o-Y Growth (%) Projections by Application, 2023 to 2033

Figure 65: Latin America Market Value (US$ Million) Analysis by Number of Axis, 2018 to 2033

Figure 66: Latin America Market Volume (MT) Analysis by Number of Axis, 2018 to 2033

Figure 67: Latin America Market Value Share (%) and BPS Analysis by Number of Axis, 2023 to 2033

Figure 68: Latin America Market Y-o-Y Growth (%) Projections by Number of Axis, 2023 to 2033

Figure 69: Latin America Market Attractiveness by Product Type, 2023 to 2033

Figure 70: Latin America Market Attractiveness by Application, 2023 to 2033

Figure 71: Latin America Market Attractiveness by Number of Axis, 2023 to 2033

Figure 72: Latin America Market Attractiveness by Country, 2023 to 2033

Figure 73: Europe Market Value (US$ Million) by Product Type, 2023 to 2033

Figure 74: Europe Market Value (US$ Million) by Application, 2023 to 2033

Figure 75: Europe Market Value (US$ Million) by Number of Axis, 2023 to 2033

Figure 76: Europe Market Value (US$ Million) by Country, 2023 to 2033

Figure 77: Europe Market Value (US$ Million) Analysis by Country, 2018 to 2033

Figure 78: Europe Market Volume (MT) Analysis by Country, 2018 to 2033

Figure 79: Europe Market Value Share (%) and BPS Analysis by Country, 2023 to 2033

Figure 80: Europe Market Y-o-Y Growth (%) Projections by Country, 2023 to 2033

Figure 81: Europe Market Value (US$ Million) Analysis by Product Type, 2018 to 2033

Figure 82: Europe Market Volume (MT) Analysis by Product Type, 2018 to 2033

Figure 83: Europe Market Value Share (%) and BPS Analysis by Product Type, 2023 to 2033

Figure 84: Europe Market Y-o-Y Growth (%) Projections by Product Type, 2023 to 2033

Figure 85: Europe Market Value (US$ Million) Analysis by Application, 2018 to 2033

Figure 86: Europe Market Volume (MT) Analysis by Application, 2018 to 2033

Figure 87: Europe Market Value Share (%) and BPS Analysis by Application, 2023 to 2033

Figure 88: Europe Market Y-o-Y Growth (%) Projections by Application, 2023 to 2033

Figure 89: Europe Market Value (US$ Million) Analysis by Number of Axis, 2018 to 2033

Figure 90: Europe Market Volume (MT) Analysis by Number of Axis, 2018 to 2033

Figure 91: Europe Market Value Share (%) and BPS Analysis by Number of Axis, 2023 to 2033

Figure 92: Europe Market Y-o-Y Growth (%) Projections by Number of Axis, 2023 to 2033

Figure 93: Europe Market Attractiveness by Product Type, 2023 to 2033

Figure 94: Europe Market Attractiveness by Application, 2023 to 2033

Figure 95: Europe Market Attractiveness by Number of Axis, 2023 to 2033

Figure 96: Europe Market Attractiveness by Country, 2023 to 2033

Figure 97: East Asia Market Value (US$ Million) by Product Type, 2023 to 2033

Figure 98: East Asia Market Value (US$ Million) by Application, 2023 to 2033

Figure 99: East Asia Market Value (US$ Million) by Number of Axis, 2023 to 2033

Figure 100: East Asia Market Value (US$ Million) by Country, 2023 to 2033

Figure 101: East Asia Market Value (US$ Million) Analysis by Country, 2018 to 2033

Figure 102: East Asia Market Volume (MT) Analysis by Country, 2018 to 2033

Figure 103: East Asia Market Value Share (%) and BPS Analysis by Country, 2023 to 2033

Figure 104: East Asia Market Y-o-Y Growth (%) Projections by Country, 2023 to 2033

Figure 105: East Asia Market Value (US$ Million) Analysis by Product Type, 2018 to 2033

Figure 106: East Asia Market Volume (MT) Analysis by Product Type, 2018 to 2033

Figure 107: East Asia Market Value Share (%) and BPS Analysis by Product Type, 2023 to 2033

Figure 108: East Asia Market Y-o-Y Growth (%) Projections by Product Type, 2023 to 2033

Figure 109: East Asia Market Value (US$ Million) Analysis by Application, 2018 to 2033

Figure 110: East Asia Market Volume (MT) Analysis by Application, 2018 to 2033

Figure 111: East Asia Market Value Share (%) and BPS Analysis by Application, 2023 to 2033

Figure 112: East Asia Market Y-o-Y Growth (%) Projections by Application, 2023 to 2033

Figure 113: East Asia Market Value (US$ Million) Analysis by Number of Axis, 2018 to 2033

Figure 114: East Asia Market Volume (MT) Analysis by Number of Axis, 2018 to 2033

Figure 115: East Asia Market Value Share (%) and BPS Analysis by Number of Axis, 2023 to 2033

Figure 116: East Asia Market Y-o-Y Growth (%) Projections by Number of Axis, 2023 to 2033

Figure 117: East Asia Market Attractiveness by Product Type, 2023 to 2033

Figure 118: East Asia Market Attractiveness by Application, 2023 to 2033

Figure 119: East Asia Market Attractiveness by Number of Axis, 2023 to 2033

Figure 120: East Asia Market Attractiveness by Country, 2023 to 2033

Figure 121: South Asia Market Value (US$ Million) by Product Type, 2023 to 2033

Figure 122: South Asia Market Value (US$ Million) by Application, 2023 to 2033

Figure 123: South Asia Market Value (US$ Million) by Number of Axis, 2023 to 2033

Figure 124: South Asia Market Value (US$ Million) by Country, 2023 to 2033

Figure 125: South Asia Market Value (US$ Million) Analysis by Country, 2018 to 2033

Figure 126: South Asia Market Volume (MT) Analysis by Country, 2018 to 2033

Figure 127: South Asia Market Value Share (%) and BPS Analysis by Country, 2023 to 2033

Figure 128: South Asia Market Y-o-Y Growth (%) Projections by Country, 2023 to 2033

Figure 129: South Asia Market Value (US$ Million) Analysis by Product Type, 2018 to 2033

Figure 130: South Asia Market Volume (MT) Analysis by Product Type, 2018 to 2033

Figure 131: South Asia Market Value Share (%) and BPS Analysis by Product Type, 2023 to 2033

Figure 132: South Asia Market Y-o-Y Growth (%) Projections by Product Type, 2023 to 2033

Figure 133: South Asia Market Value (US$ Million) Analysis by Application, 2018 to 2033

Figure 134: South Asia Market Volume (MT) Analysis by Application, 2018 to 2033

Figure 135: South Asia Market Value Share (%) and BPS Analysis by Application, 2023 to 2033

Figure 136: South Asia Market Y-o-Y Growth (%) Projections by Application, 2023 to 2033

Figure 137: South Asia Market Value (US$ Million) Analysis by Number of Axis, 2018 to 2033

Figure 138: South Asia Market Volume (MT) Analysis by Number of Axis, 2018 to 2033

Figure 139: South Asia Market Value Share (%) and BPS Analysis by Number of Axis, 2023 to 2033

Figure 140: South Asia Market Y-o-Y Growth (%) Projections by Number of Axis, 2023 to 2033

Figure 141: South Asia Market Attractiveness by Product Type, 2023 to 2033

Figure 142: South Asia Market Attractiveness by Application, 2023 to 2033

Figure 143: South Asia Market Attractiveness by Number of Axis, 2023 to 2033

Figure 144: South Asia Market Attractiveness by Country, 2023 to 2033

Figure 145: Oceania Market Value (US$ Million) by Product Type, 2023 to 2033

Figure 146: Oceania Market Value (US$ Million) by Application, 2023 to 2033

Figure 147: Oceania Market Value (US$ Million) by Number of Axis, 2023 to 2033

Figure 148: Oceania Market Value (US$ Million) by Country, 2023 to 2033

Figure 149: Oceania Market Value (US$ Million) Analysis by Country, 2018 to 2033

Figure 150: Oceania Market Volume (MT) Analysis by Country, 2018 to 2033

Figure 151: Oceania Market Value Share (%) and BPS Analysis by Country, 2023 to 2033

Figure 152: Oceania Market Y-o-Y Growth (%) Projections by Country, 2023 to 2033

Figure 153: Oceania Market Value (US$ Million) Analysis by Product Type, 2018 to 2033

Figure 154: Oceania Market Volume (MT) Analysis by Product Type, 2018 to 2033

Figure 155: Oceania Market Value Share (%) and BPS Analysis by Product Type, 2023 to 2033

Figure 156: Oceania Market Y-o-Y Growth (%) Projections by Product Type, 2023 to 2033

Figure 157: Oceania Market Value (US$ Million) Analysis by Application, 2018 to 2033

Figure 158: Oceania Market Volume (MT) Analysis by Application, 2018 to 2033

Figure 159: Oceania Market Value Share (%) and BPS Analysis by Application, 2023 to 2033

Figure 160: Oceania Market Y-o-Y Growth (%) Projections by Application, 2023 to 2033

Figure 161: Oceania Market Value (US$ Million) Analysis by Number of Axis, 2018 to 2033

Figure 162: Oceania Market Volume (MT) Analysis by Number of Axis, 2018 to 2033

Figure 163: Oceania Market Value Share (%) and BPS Analysis by Number of Axis, 2023 to 2033

Figure 164: Oceania Market Y-o-Y Growth (%) Projections by Number of Axis, 2023 to 2033

Figure 165: Oceania Market Attractiveness by Product Type, 2023 to 2033

Figure 166: Oceania Market Attractiveness by Application, 2023 to 2033

Figure 167: Oceania Market Attractiveness by Number of Axis, 2023 to 2033

Figure 168: Oceania Market Attractiveness by Country, 2023 to 2033

Figure 169: MEA Market Value (US$ Million) by Product Type, 2023 to 2033

Figure 170: MEA Market Value (US$ Million) by Application, 2023 to 2033

Figure 171: MEA Market Value (US$ Million) by Number of Axis, 2023 to 2033

Figure 172: MEA Market Value (US$ Million) by Country, 2023 to 2033

Figure 173: MEA Market Value (US$ Million) Analysis by Country, 2018 to 2033

Figure 174: MEA Market Volume (MT) Analysis by Country, 2018 to 2033

Figure 175: MEA Market Value Share (%) and BPS Analysis by Country, 2023 to 2033

Figure 176: MEA Market Y-o-Y Growth (%) Projections by Country, 2023 to 2033

Figure 177: MEA Market Value (US$ Million) Analysis by Product Type, 2018 to 2033

Figure 178: MEA Market Volume (MT) Analysis by Product Type, 2018 to 2033

Figure 179: MEA Market Value Share (%) and BPS Analysis by Product Type, 2023 to 2033

Figure 180: MEA Market Y-o-Y Growth (%) Projections by Product Type, 2023 to 2033

Figure 181: MEA Market Value (US$ Million) Analysis by Application, 2018 to 2033

Figure 182: MEA Market Volume (MT) Analysis by Application, 2018 to 2033

Figure 183: MEA Market Value Share (%) and BPS Analysis by Application, 2023 to 2033

Figure 184: MEA Market Y-o-Y Growth (%) Projections by Application, 2023 to 2033

Figure 185: MEA Market Value (US$ Million) Analysis by Number of Axis, 2018 to 2033

Figure 186: MEA Market Volume (MT) Analysis by Number of Axis, 2018 to 2033

Figure 187: MEA Market Value Share (%) and BPS Analysis by Number of Axis, 2023 to 2033

Figure 188: MEA Market Y-o-Y Growth (%) Projections by Number of Axis, 2023 to 2033

Figure 189: MEA Market Attractiveness by Product Type, 2023 to 2033

Figure 190: MEA Market Attractiveness by Application, 2023 to 2033

Figure 191: MEA Market Attractiveness by Number of Axis, 2023 to 2033

Figure 192: MEA Market Attractiveness by Country, 2023 to 2033

Explore Process Automation Insights

View Reports

Universal Milling Machine Market