The Thread Milling Machine Market is estimated to be valued at USD 19.3 billion in 2025 and is projected to reach USD 31.7 billion by 2035, registering a compound annual growth rate (CAGR) of 5.1% over the forecast period.
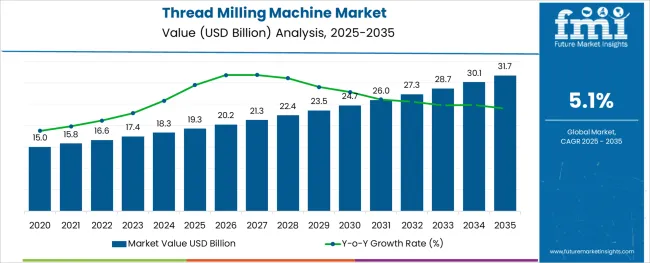
The thread milling machine market is witnessing sustained growth, underpinned by advances in machining technologies, increasing demand for precision engineering, and rising investments in manufacturing automation. The growing emphasis on cost-effective and high-quality threading solutions has driven adoption across diverse industries seeking enhanced productivity and operational efficiency.
Companies are aligning their manufacturing strategies to cater to the demand for robust, efficient, and durable machines capable of working with challenging materials. Future growth is expected to be shaped by the expansion of automotive and aerospace production, along with the shift toward Industry 4.0 and smart manufacturing practices.
The integration of advanced tooling materials, digital monitoring systems, and flexible production capabilities is paving the path for broader adoption and technological evolution in the market.
The market is segmented by Material, Application, and Distribution Channel and region. By Material, the market is divided into Stainless steel and Mild steel. In terms of Application, the market is classified into Automotive, Food Equipment, Aerospace, Power Generation, and Medical. Based on Distribution Channel, the market is segmented into Offline and Online. Regionally, the market is classified into North America, Latin America, Western Europe, Eastern Europe, Balkan & Baltic Countries, Russia & Belarus, Central Asia, East Asia, South Asia & Pacific, and the Middle East & Africa.
The market is segmented by Material, Application, and Distribution Channel and region. By Material, the market is divided into Stainless steel and Mild steel. In terms of Application, the market is classified into Automotive, Food Equipment, Aerospace, Power Generation, and Medical. Based on Distribution Channel, the market is segmented into Offline and Online. Regionally, the market is classified into North America, Latin America, Western Europe, Eastern Europe, Balkan & Baltic Countries, Russia & Belarus, Central Asia, East Asia, South Asia & Pacific, and the Middle East & Africa.
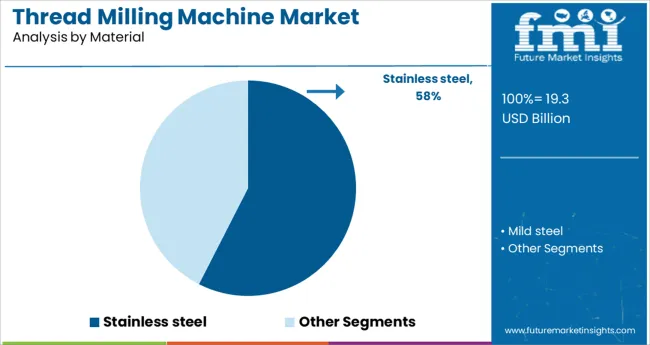
When segmented by material, stainless steel is projected to account for 57.5% of the total market revenue in 2025, making it the leading material segment. This leadership has been attributed to the growing use of stainless steel in critical components that demand high corrosion resistance and durability, particularly in industries such as automotive, aerospace, and medical devices.
The machinability of stainless steel combined with its strength characteristics has necessitated the development of thread milling machines capable of handling its specific properties effectively. Continuous improvements in cutting tool coatings and machine rigidity have enhanced productivity and reduced wear when working with stainless steel, reinforcing its dominant share.
Manufacturers have increasingly focused on optimizing machine parameters for stainless steel applications, ensuring high precision and reduced cycle times, which has further bolstered its leadership.
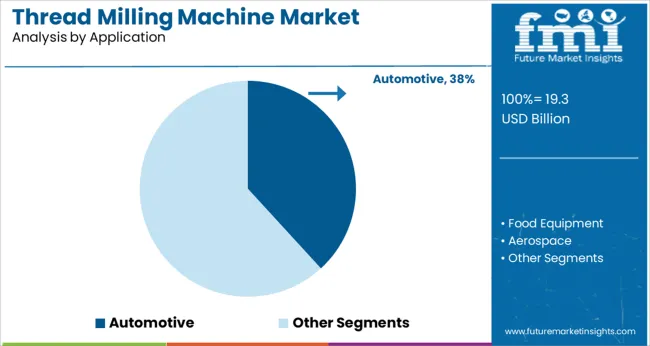
In terms of application, automotive is anticipated to hold 38.2% of the market revenue in 2025, establishing itself as the foremost application segment. This prominence has been driven by the sustained growth of global automotive production and the need for precision-threaded components in engines, transmissions, and structural parts.
Thread milling machines have been adopted extensively in the automotive sector to meet demands for higher production rates, tighter tolerances, and consistent quality across large production volumes. The adoption of lightweight materials and evolving design complexities in vehicles have increased reliance on flexible and efficient thread milling solutions.
Furthermore, investments in modernizing manufacturing facilities and expanding capacity in response to rising vehicle demand have supported the segment’s continued growth and leading position in the market.
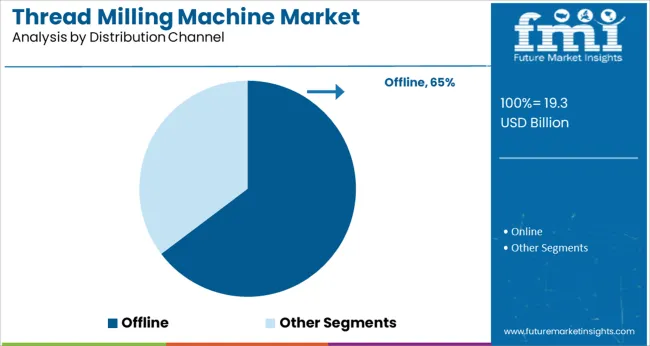
When segmented by distribution channel, offline is expected to command 64.7% of the market revenue in 2025, securing its status as the leading channel. This dominance has been shaped by the preference of buyers to engage directly with suppliers and distributors for technical guidance, demonstrations, and personalized service during the purchasing process.
Offline channels have provided customers with confidence in machine quality and after-sales support, which has remained critical for capital equipment investments. Trade shows, dealer networks, and on-site consultations have played a significant role in educating end-users about advanced features and facilitating procurement decisions.
The ability of offline channels to offer tailored solutions, negotiate pricing, and build long-term relationships has reinforced their prominence as the preferred mode of distribution within the thread milling machine market.
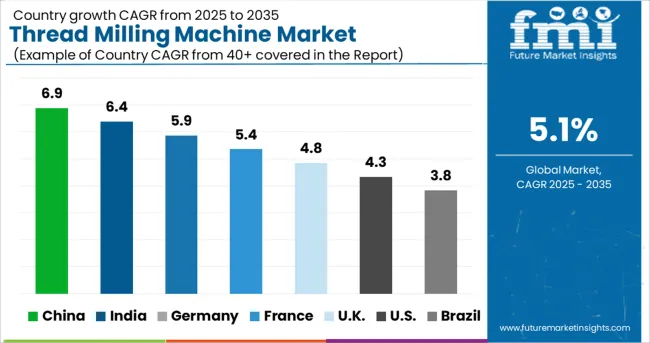
The global thread milling machine market is expected to reach USD 28,675.9 Million by 2035 and exhibit growth at a CAGR of 5.1% during the forecast period. The future of the global thread milling machine market looks bright with a historical CAGR of 3.2% from 2020 to 2025, according to a new report by FMI. The market is mainly driven by the growing demand for thread milling machines from the automotive and aerospace industries.
Historically, the global thread milling machine market has been dominated by North America and Europe due to the presence of a large number of manufacturers in these regions. However, Asia Pacific is expected to emerge as the leading market during the forecast period owing to the growing demand from China and India.
A number of influential factors have been identified to stir the soup in the thread milling machine market. Besides the proliferating aspects prevailing in the market, the analysts at FMI have also analyzed the restraining elements, lucrative opportunities, and upcoming threats that can pose a challenge to the progression of the thread-milling machine market.
The drivers, restraints, opportunities, and threats (DROTs) identified are as follows:
DRIVERS
RESTRAINTS
OPPORTUNITIES
THREATS
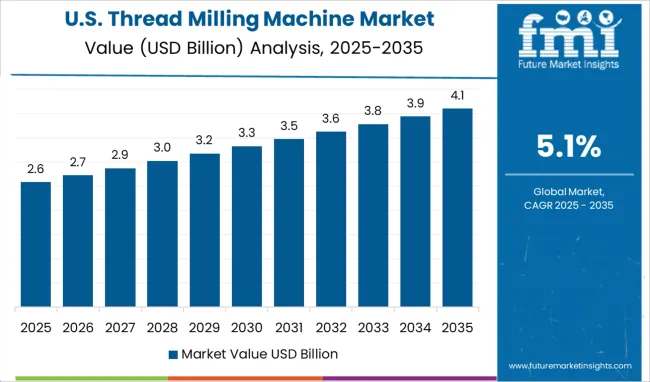
High Demand for Manufactured Goods in the USA to Boost Sales of Portable Thread Milling Machines
Sales of thread milling machines are affected in the USA market in a few ways. Firstly, the demand for these machines is largely dependent on the manufacturing industry in the country. When there is high demand for manufactured goods, there is also a higher demand for thread milling machines.
Secondly, the cost of these machines is greatly affected by the American dollar. A strong dollar makes imported thread milling machines more expensive, while a weak dollar makes them less expensive. Owing to the aforementioned factors, the thread milling machine market in the USA is expected to showcase considerable growth during the forecast period.
Demand for Horizontal Milling Machines to Surge among Indian Manufacturers by 2035
Thread milling machines are used in a wide variety of industries for various applications. In India, thread milling machines are used in the automotive, aerospace, and defense industries. These machines offer numerous advantages over traditional machining methods, including increased productivity, improved accuracy, and high flexibility. With the right thread milling machine, Indian manufacturers can increase their competitiveness in the global market.
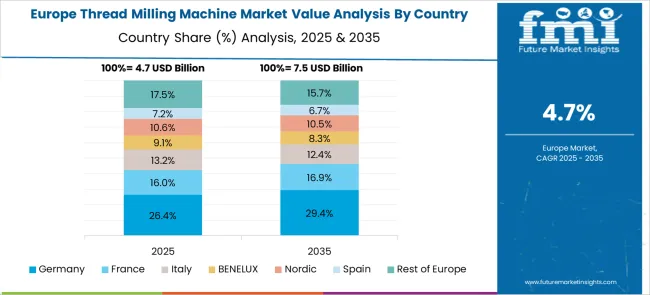
German Threaded End Mills Manufacturers to Focus on Launching Long-lasting Models
Germany is a world leader in the production of thread milling machines, with a market share of over 50%. This dominance has been achieved through a combination of factors, including a strong engineering base, high-quality manufacturing, and an excellent reputation for reliability.
Germany-based thread milling machine manufacturers have invested heavily in research & development, resulting in a continuous stream of new and improved products. This commitment to innovation ensures that German companies remain at the forefront of this highly competitive market.
The high standards of German engineering are also reflected in the quality of the country's thread-milling machines. Manufacturers such as DMG MORI and Heinz Fiedler GmbH & Co. KG offer machines that are built to last, with many models having a lifespan of 20 years or more.
The emergence of Various Chinese CNC Thread Milling Machine Companies to Spur Sales
China is emerging as a high-potential market for thread-milling machines. The country’s manufacturing sector is growing rapidly, requiring more of these machines to meet the rising demand. Chinese manufacturers are increasingly looking to purchase higher-quality machines, which they see as an essential component for producing quality products.
The Chinese government is also supportive of the thread milling machine market and has invested heavily in it. This has led to the emergence of a large number of leading Chinese manufacturers who are able to produce quality machines at competitive prices.
Demand for Tapping Milling Machines to Grow among Medical Facilities by 2035
Based on application, the medical segment is projected to remain at the forefront in the global thread milling machine market during the evaluation period. These machines are used in the medical industry to make small threads for use in face masks, curtains, bedsheets, and other accessories. These machines help to ensure rotational accuracy with small-diameter milling tools. Increasing concerns regarding hygiene and rising demand for clean healthcare products are expected to bode well for the segment.
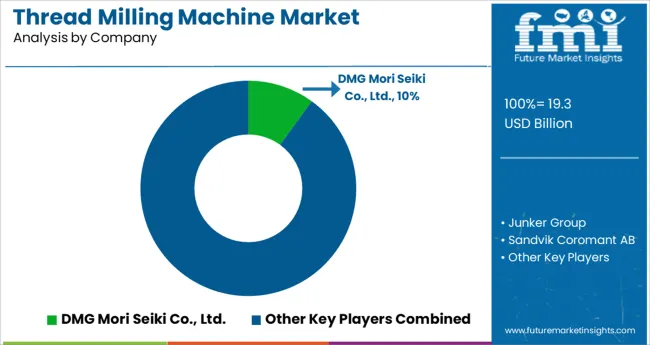
The global thread milling machine market is highly competitive. Major players in the market are Brother Industries, Hitachi, JTEKT Corporation, Mitsubishi Electric Corporation, Nakamura-Tome Precision Industry, and DMG MORI SEIKI CO., LTD. These companies have a strong presence in the market and hold a large share of the market.
The competition in the market is intense as these companies are continually striving to develop new and innovative products to gain a competitive edge. Research & development (Research and Development) is a key area of focus for these companies and they are investing heavily in it.
These companies are also engaged in aggressive marketing activities to promote their products. The global market is growing at a rapid pace due to the increasing demand from various industries such as automotive, aerospace, and others.
For instance,
| Attribute | Details |
|---|---|
| Estimated Market Size (2025) | USD 19.3 billion |
| Projected Market Valuation (2035) | USD 31.7 billion |
| Value-based CAGR (2025 to 2035) | 5.1% |
| Forecast Period | 2025 to 2035 |
| Historical Data Available for | 2020 to 2025 |
| Market Analysis | Value (million) |
| Key Regions Covered | North America; Latin America; Europe; Asia Pacific; Oceania; Middle East and Africa (MEA) |
| Key Countries Covered | USA, Canada, Mexico, Germany, UK, France, Italy, Spain, China, Japan, India, South Korea, Australia, Brazil, Argentina, South Africa, UAE |
| Key Segments Covered | Material, Application, Region |
| Key Companies Profiled | DMG Mori Seiki Co., Ltd.; Junker Group; Sandvik Coromant AB; Kennametal Inc.; Walter AG; Yamazaki Mazak Corporation; EMAG GmbH & Co.; Brother Industries; Hitachi; JTEKT Corporation; Mitsubishi Electric Corporation; Nakamura-Tome Precision Industry |
| Report Coverage | Market Forecast, Company Share Analysis, Competitive Landscape, Drivers, Restraints, Opportunities and Threats Analysis, Market Dynamics and Challenges, and Strategic Growth Initiatives |
The global thread milling machine market is estimated to be valued at USD 19.3 billion in 2025.
It is projected to reach USD 31.7 billion by 2035.
The market is expected to grow at a 5.1% CAGR between 2025 and 2035.
The key product types are stainless steel and mild steel.
automotive segment is expected to dominate with a 38.2% industry share in 2025.


Our Research Products

The "Full Research Suite" delivers actionable market intel, deep dives on markets or technologies, so clients act faster, cut risk, and unlock growth.

The Leaderboard benchmarks and ranks top vendors, classifying them as Established Leaders, Leading Challengers, or Disruptors & Challengers.

Locates where complements amplify value and substitutes erode it, forecasting net impact by horizon

We deliver granular, decision-grade intel: market sizing, 5-year forecasts, pricing, adoption, usage, revenue, and operational KPIs—plus competitor tracking, regulation, and value chains—across 60 countries broadly.

Spot the shifts before they hit your P&L. We track inflection points, adoption curves, pricing moves, and ecosystem plays to show where demand is heading, why it is changing, and what to do next across high-growth markets and disruptive tech

Real-time reads of user behavior. We track shifting priorities, perceptions of today’s and next-gen services, and provider experience, then pace how fast tech moves from trial to adoption, blending buyer, consumer, and channel inputs with social signals (#WhySwitch, #UX).

Partner with our analyst team to build a custom report designed around your business priorities. From analysing market trends to assessing competitors or crafting bespoke datasets, we tailor insights to your needs.
Supplier Intelligence
Discovery & Profiling
Capacity & Footprint
Performance & Risk
Compliance & Governance
Commercial Readiness
Who Supplies Whom
Scorecards & Shortlists
Playbooks & Docs
Category Intelligence
Definition & Scope
Demand & Use Cases
Cost Drivers
Market Structure
Supply Chain Map
Trade & Policy
Operating Norms
Deliverables
Buyer Intelligence
Account Basics
Spend & Scope
Procurement Model
Vendor Requirements
Terms & Policies
Entry Strategy
Pain Points & Triggers
Outputs
Pricing Analysis
Benchmarks
Trends
Should-Cost
Indexation
Landed Cost
Commercial Terms
Deliverables
Brand Analysis
Positioning & Value Prop
Share & Presence
Customer Evidence
Go-to-Market
Digital & Reputation
Compliance & Trust
KPIs & Gaps
Outputs
Full Research Suite comprises of:
Market outlook & trends analysis
Interviews & case studies
Strategic recommendations
Vendor profiles & capabilities analysis
5-year forecasts
8 regions and 60+ country-level data splits
Market segment data splits
12 months of continuous data updates
DELIVERED AS:
PDF EXCEL ONLINE
Thread Seal Tape Market
Thread Trimming Machine Market Size and Share Forecast Outlook 2025 to 2035
Continuous Thread Metal Cap Market
High-Strength Polyester Thread Market Size and Share Forecast Outlook 2025 to 2035
Milling Machine Market Growth – Trends & Forecast 2025 to 2035
End Milling Machine Market Report - Demand, Growth & Industry Outlook 2025 to 2035
Road Milling Machine Market Analysis and Opportunity Assessment in India Size and Share Forecast Outlook 2025 to 2035
Rice Milling Machine Market Size and Share Forecast Outlook 2025 to 2035
Tree Milling Machine Market Size and Share Forecast Outlook 2025 to 2035
Corn Milling Machine Market Size and Share Forecast Outlook 2025 to 2035
Maize Milling Machine Market Size and Share Forecast Outlook 2025 to 2035
Wheat Milling Machine Market Size and Share Forecast Outlook 2025 to 2035
Corn Wet Milling Services Market Size, Growth, and Forecast for 2025 to 2035
Portable Milling Machine Market Size and Share Forecast Outlook 2025 to 2035
Indexable Milling Cutters Market Size and Share Forecast Outlook 2025 to 2035
Universal Milling Machine Market Size and Share Forecast Outlook 2025 to 2035
Horizontal Milling Machine Market Size and Share Forecast Outlook 2025 to 2035
Desktop CNC Milling Machines Market Size and Share Forecast Outlook 2025 to 2035
Tabletop CNC Milling Machines Market Analysis - Size, Share, and Forecast Outlook 2025 to 2035
Industrial Food Milling Machine Market Size and Share Forecast Outlook 2025 to 2035

Thank you!
You will receive an email from our Business Development Manager. Please be sure to check your SPAM/JUNK folder too.
Chat With
MaRIA