Reports

- Global Locations -

Headquarters

Future Market Insights, Inc.

Christiana Corporate, 200
Continental Drive, Suite 401,
Newark, Delaware - 19713,
United States

T: +1-845-579-5705

Americas

Future Market Insights, Inc.

616 Corporate Way, Suite 2-9018,
Valley Cottage, NY 10989, United States

T: +1-347-918-3531

MEA

Future Market Insights

1602-6 Jumeirah Bay X2 Tower, Plot No: JLT-PH2-X2A,
Jumeirah Lakes Towers, Dubai,
United Arab Emirates

Europe

Future Market Insights

3rd Floor, 207 Regent Street,
W1B 3HH London
United Kingdom

T: + 44 (0) 20 8123 9659
D: +44 (0) 20 3287 4268

Asia Pacific

Future Market Insights

IndiaLand Global Tech Park, Unit UG-1, Behind Grand HighStreet, Phase 1, Hinjawadi, MH, Pune – 411057, India

Horizontal Milling Machine Market Outlook (2023 to 2033)

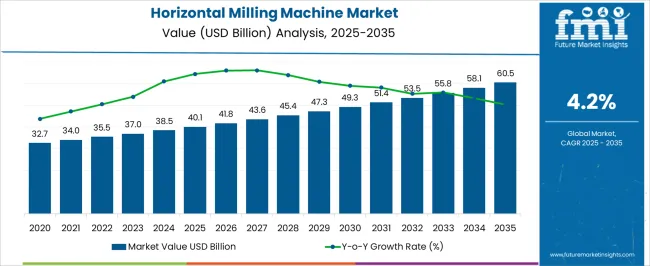
The global horizontal milling machine market is expected to grow from US$ 36,955.7 million in 2023 to US$ 55,764.6 million by 2033, with overall sales accelerating at 4.2% CAGR throughout the forecast period (2023 to 2033). The rising usage of horizontal milling machines in various commercial and industrial applications is a key factor driving the global market.

Horizontal milling machines are commonly used types of milling machines with a spindle parallel to the worktable, used to process various planes, inclined planes, and grooves with cylindrical milling cutters, forming cutters, end mills, angle cutters, disc cutters, and several other tools. These machines are a better option for complex projects than vertical milling machines.

Horizontal milling machines have gained immense traction in the last few decades due to their increasing applications across a wide range of industries. They are being extensively used to perform the functions of drilling, chamfering, turning, slot cutting, etc.

These machines cut faster and depending on the machine, can make multiple cuts simultaneously. Thanks to their increased speed and precision, they have become ideal for lengthy and large production runs.

The market is driven by the increasing demand for the machining of large and complex parts, the rising automotive industry, and the growing demand for the miniaturization of products.

Similarly, the rising application of horizontal milling machines across diverse industries and the growing need for improving the productivity of metalworking processes are expected to boost sales of horizontal milling machines during the forecast period.

Horizontal milling machines can complete a job much faster than other types of milling machines. They also take up less space and are perfect for the commercial world where space is often limited.

Attribute Key Statistics
Horizontal Milling Machine Market Value (2023) US$ 36,955.7 Million
Projected Market Value (2033) US$ 55,764.6 Million
Value-based CAGR (2023 to 2033) 4.2%
Market Share of US 32.7%

Don't pay for what you don't need

Customize your report by selecting specific countries or regions and save 30%!

2018 to 2022 Horizontal Milling Machine Market Outlook Compared to 2023 to 2033 Forecast

The global demand for horizontal milling machines is projected to grow at a steady CAGR of 4.2% between 2023 and 2033 in comparison to a 2.8% CAGR registered during the historical period from 2018 to 2022.

The rapid growth of manufacturing industries like metal, plastic, automotive, and aerospace across the world is a key factor driving the horizontal milling machine market and the trend is likely to continue during the forecast period.

Horizontal milling machine is one of the most popular types of milling machines used across various metalworking industries. These machines can produce products with high accuracy and repeatability. Further, they are very versatile and can be used for a variety of applications. Thus, the widening application of horizontal milling machines across various industries due to their ability to produce high-quality products will continue to boost the market during the forecast period.

Similarly, the development of newer and more advanced milling machines that offer greater efficiency and productivity benefits is expected to boost the global horizontal milling machine market during the forecast.

Market-o-Nomics - Highlighting the Key Trends

A number of influential factors have been identified that are expected to spur growth in the global horizontal milling machine market during the projection period (2023 to 2033). Besides the proliferating aspects prevailing in the market, the analysts at FMI have also analyzed the restraining elements, lucrative opportunities, and upcoming threats that can somehow influence horizontal milling machine sales.

The drivers, restraints, opportunities, and threats (DROTs) identified are as follows:

DRIVERS

  • The rapid growth of metalworking industries across the globe is a key factor driving the global horizontal milling machine market forward.
  • The growing need for improving productivity across end-use industries is expected to boost sales in the market.

RESTRAINTS

  • The high cost of horizontal milling machines is expected to stymie the growth of the global market, particularly in low-income regions during the forecast period.

OPPORTUNITIES

  • Rising application in industrial and commercial sectors is expected to generate lucrative opportunities for the growth of the market over the next decade.
  • Increasing demand for high-precision products across various industries will generate growth avenues for the market.
  • Technological advancements in horizontal milling machines will further boost the market during the forecast period. 

THREATS

  • High maintenance costs and a lack of skilled professionals are likely to inhibit the growth of the market during the forecast period.
Nandini Roy Choudhury

Principal Consultant

Talk to Analyst

Find your sweet spots for generating winning opportunities in this market.

Country-wise Insights

What Makes the US a Prominent Horizontal Milling Machine Market?

“Rising Demand from Automotive and Aerospace Industries Driving the US Market”

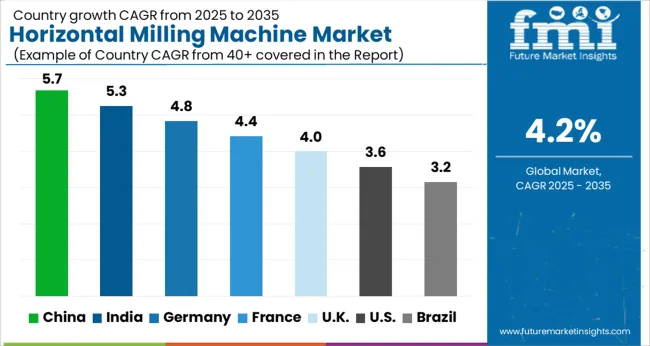
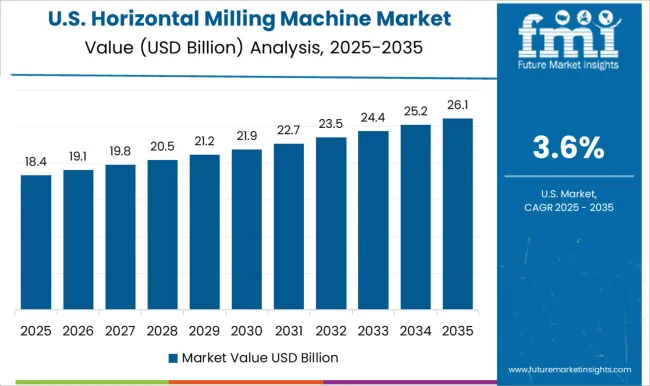
The US holds around 32.7% share of the global horizontal milling machine market and it is likely to expand at a steady pace during the next ten years. Increasing demand from the automotive and aerospace industries and the growing need for precision machining are some of the key factors driving the US horizontal milling machine market.

The United States is the largest market for horizontal milling machines in North America, followed by Canada and Mexico. As the automotive industry is the major end-user of horizontal milling machines in the country, increasing demand for electric vehicles and hybrid vehicles will eventually bolster sales of horizontal milling machines during the forecast period.

According to the International Energy Agency (IEA), over 630000 electric vehicles were sold in the US during the year 2021 and this number is likely to further surge during the next few years. This will in turn create lucrative opportunities for horizontal milling machine manufacturers.

Similarly, the growing adoption of horizontal milling machines across the thriving aerospace industry will further aid in the expansion of the US horizontal milling machine market.

Why is Demand for Horizontal Milling Machines Rising Across India?

“Increasing Government Support Generating Demand in India Market”

As per FMI, the horizontal milling machine market in India is poised to exhibit strong growth during the forecast period owing to the rising government's focus on promoting the manufacturing sector, increasing investments in infrastructure projects, and the growing automotive industry.

Over the years, the Indian government has launched various initiatives such as “Make in India” to transform the country into a global design and manufacturing hub. This has created a conducive environment for the growth of industries like metal, plastic, wood, automotive, etc. driven by this, demand for horizontal milling machines is growing at a steady pace in the country and the trend is likely to continue during the projection period.

Why is China Emerging as a High-Potential Market for Horizontal Milling Machines?

“Rapid Growth of Metal Industry Boosting Market in China”

As the "Make in China" campaign continues to gather steam, the country is emerging as a high-potential market for horizontal milling machines. This is due to a number of factors, including the growing demand for metal industry resources and the rapid growth of the Chinese economy.

Horizontal milling machines are an essential piece of equipment for any metalworking shop. They are versatile tools that can be used to create a variety of parts and products. In recent years, they have become increasingly popular in China due to the rapid expansion of the metalworking industries.

There are a number of reasons why China is an attractive market for horizontal milling machines. First, the country has a rapidly growing economy. This has led to increased demand for all types of manufacturing equipment, including milling machines. Second, China is home to a large number of metal industry resources.

Category-wise Insights

Which is the Most Lucrative Application for Horizontal Milling Machines?

“Industrial Segment Likely to Generate the Highest Revenues”

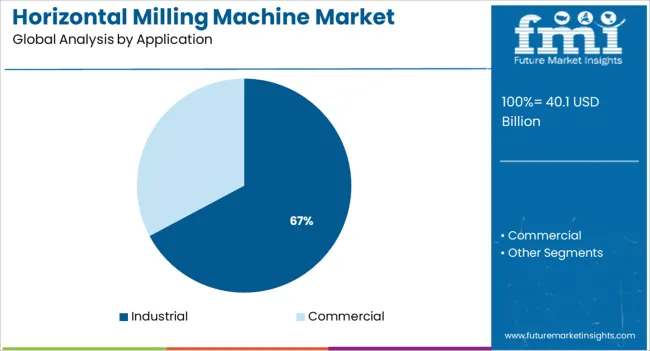
Based on application, the global horizontal milling machines market is segmented into commercial and industrial segments. Among these, the industrial segment is likely to generate maximum revenues during the forecast period.

This can be attributed to the rising usage of horizontal milling machines across metal, wood, and plastic industries. Similarly, increasing metalworking operations across the globe along with growing demand for high-precision metal products and parts is expected to boost the growth of the target segment during the projection period.
Get the data you need at a Fraction of the cost

Personalize your report by choosing insights you need
and save 40%!

Competitive Landscape

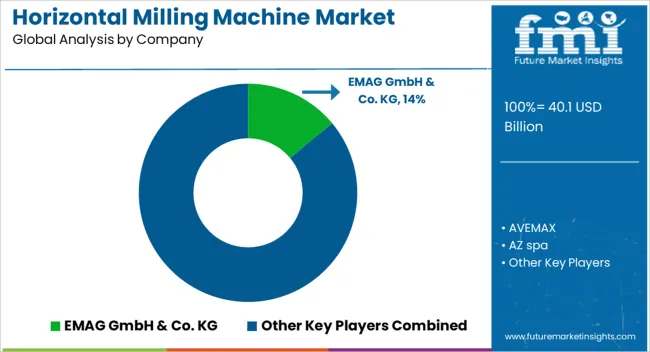
Key manufacturers of horizontal milling machines include AVEMAX, AZ spa, AHP PLASTIK MAKINA, Boygo, CAMAM, CAZENEUVE, EMISSA, EMAG GmbH&Co.KG, EURACRYL GmbH, GEORG KESEL, Normaco tools OU, TORNOS, and SIBO ENGINEERING among others.

These players are continuously focusing on increasing their customer base by adopting strategies such as new product launches, mergers, acquisitions, partnerships, and collaborations. For instance,

  • In 2019, Expand Machinery acquired the GENMILL, GENTURN, and GANESH product lines.
  • In July 2022, Okuma America Corporation introduced the MA-8000H, the latest addition to the company’s horizontal machining center lineup.
  • In 2018, Zimmermann, one of the world’s leading manufacturers of high-tech portal milling machines introduced a new FZH model range, useful for the efficient machining of standard components for the aerospace industry.

Select the Right Milling Tool for Any Machining Task with Makino and AVEMAX’s Advanced Solutions!

With the growing need for precision machining, the popularity of horizontal milling machines has skyrocketed during the last few decades. Companies use horizontal milling machines to fabricate or manufacture various components or equipment. Various companies develop and supply these machine tools, among which Makino and AVEMAX lead from the forefront.

A world leader in metal cutting and manufacturing technology, Makino has become an ideal destination for users looking to get advanced horizontal milling machines. The company manufactures horizontal machining centers, vertical machining centers, wire EDM and ram EDM machines, and graphite machining centers, among other tools.

With its most accurate and highest quality metal cutting and fabricating tools, Makino helps the world’s businesses transform their business. The company is constantly launching new products to solidify its stance and expand its customer base. For instance, in September 2022 Makino Inc. introduced a800Z, another new high-performance machining center design. The new five-axis horizontal machining center expands upon the best features of the Makino nx-Series four-axis horizontal machining centers by fully integrating a “Z-type” fifth axis. It will be an asset to part and component manufacturers serving market areas including semiconductor, aero structural, industrial equipment, and automotive.

Another leading manufacturer and supplier of horizontal milling machines are AVEMAX. Initially, AVEMAX was the milling machine department of Manford. However, in 2006, it became independent and is now a sister company of Manford.

AVEMAX has become one of the world’s top brands that offer quality milling solutions to various end-use industries. The company continues to focus on producing high-quality products while adhering to the MIT (made in Taiwan) principle of production.

AVEMAX offers a wide range of machine tools like CNC milling machines, CNC vertical machining centers, iPRO Mill, etc. It has become a reliable player for industries to get the right choice of horizontal milling solutions.

Horizontal Milling Machine Market Report Scope

Attribute Details
Estimated Market Size (2023) US$ 36,955.7 Million
Projected Market Size (2033) US$ 55,764.6 Million
Anticipated Growth Rate (2023 to 2033) 4.2% CAGR
Forecast Period 2023 to 2033
Historical Data Available for 2018 to 2022
Market Analysis US$ Million for Value and Units for Volume
Key Regions Covered
  • North America
  • Latin America
  • Europe
  • Asia Pacific
  • Oceania
  • Middle East & Africa (MEA)
Key Countries Covered
  • The US
  • Canada
  • Mexico
  • Germany
  • The UK
  • France
  • Italy
  • Spain
  • China
  • Japan
  • India
  • South Korea
  • Australia
  • Brazil
  • Argentina
  • South Africa
  • UAE
Key Segments Covered
  • Product
  • Number of Axis
  • Application
  • Distribution Channel
  • Region
Key Companies Profiled
  • AVEMAX
  • AZ spa
  • AHP PLASTIK MAKINA
  • Boygo
  • CAMAM
  • CAZENEUVE
  • EMISSA
  • EMAG GmbH&Co.KG
  • EURACRYL GmbH
  • GEORG KESEL
  • Normaco tools OU
  • TORNOS
  • SIBO ENGINEERING
Report Coverage Market Forecast, Company Share Analysis, Competitive Landscape, DROT Analysis, Market Dynamics and Challenges, and Strategic Growth Initiatives

Horizontal Milling Machine Market by Category

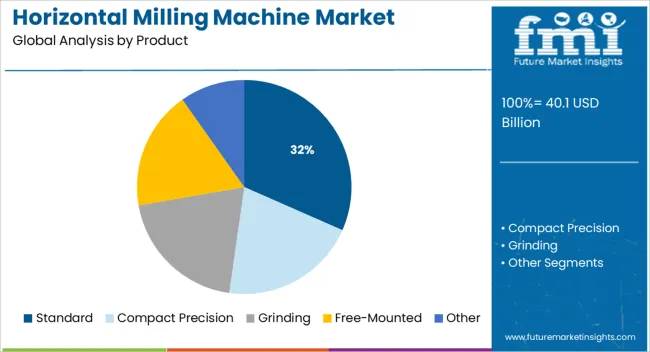
By Product:

  • Compact Precision
  • Standard
  • Grinding
  • Free-Mounted
  • Other

By Application:

  • Commercial
  • Industrial
    • Plastic Industry
    • Wood Industry
    • Metal Industry

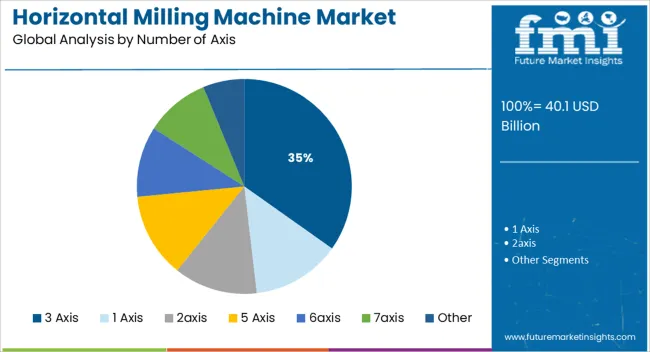
By Number of Axis:

  • 1 Axis
  • 2axis
  • 3 Axis
  • 5 Axis
  • 6axis
  • 7axis
  • Other

By Distribution Channel:

  • Online
  • Offline

By Region:

  • North America
  • Latin America
  • Europe
  • East Asia
  • South Asia
  • Oceania
  • Middle East & Africa (MEA)

Frequently Asked Questions

How big is the global horizontal milling machine market?

The global horizontal milling machine market size is expected to reach US$ 36,955.7 Million in 2023.

At what rate will the horizontal milling machine market grow during the forecast period?

The worldwide horizontal milling machine market is expected to grow at a CAGR of 4.2% during the forecast period.

What is the projected valuation for the horizontal milling machine market?

The global horizontal milling machine market is projected to surpass a valuation of US$ 55,764.6 Million by 2033.

What is the North America horizontal milling machine market outlook?

North America is likely to hold over 38% share of the global horizontal milling machine market in 2023.

Which are the major countries driving demand for horizontal milling machines?

The US, China, Canada, Germany, and Mexico are the major countries driving demand for horizontal milling machines.

At what rate will the China horizontal mill machine market grow?

China’s horizontal mill machine market is projected to grow at a CAGR of 5.7% during the forecast period.

At what rate will the UK horizontal mill machine market grow during the forecast period?

The UK horizontal mill machine market is projected to grow at a CAGR of 5.3% during the forecast period.

What is the growth projection for the India horizontal mill machine market?

India’s horizontal mill machine market is projected to grow at 6.3% CAGR during the next ten years.

How big is the Europe horizontal mill machine market?

Europe is expected to hold around 32.7% share of the worldwide horizontal milling machine market in 2023.

At what rate will demand for horizontal mill machines grow in Japan?

Demand for horizontal mill machines across Japan is expected to grow at 8.0% CAGR through 2033.

Table of Content

1. Executive Summary | Horizontal Milling Machine Market

    1.1. Global Market Outlook

    1.2. Demand-side Trends

    1.3. Supply-side Trends

    1.4. Technology Roadmap Analysis

    1.5. Analysis and Recommendations

2. Market Overview

    2.1. Market Coverage / Taxonomy

    2.2. Market Definition / Scope / Limitations

3. Market Background

    3.1. Market Dynamics

        3.1.1. Drivers

        3.1.2. Restraints

        3.1.3. Opportunity

        3.1.4. Trends

    3.2. Scenario Forecast

        3.2.1. Demand in Optimistic Scenario

        3.2.2. Demand in Likely Scenario

        3.2.3. Demand in Conservative Scenario

    3.3. Product launches & Recent Developments

    3.4. Product Life Cycle Analysis

    3.5. Value Chain Analysis

        3.5.1. Supply Side Participants and their Roles

            3.5.1.1. Producers

            3.5.1.2. Mid-Level Participants (Traders / Agents / Brokers)

            3.5.1.3. Wholesalers and Distributors

        3.5.2. % of Operating Margin Analysis

        3.5.3. List of Raw Material Suppliers

        3.5.4. List of Existing and Potential Buyers

    3.6. Global Market - Pricing Analysis

        3.6.1. Price Point Assessment by Region

        3.6.2. Price Point Assessment by, Product

        3.6.3. Price Forecast till 2033

        3.6.4. Factors affecting pricing

    3.7. Forecast Factors - Relevance & Impact

    3.8. PESTLE and Porter’s Analysis

    3.9. Regulatory Landscape

        3.9.1. Packaging & Labelling Regulations

        3.9.2. Certifications and Certifying Agency Overview

        3.9.3. Import/Export Policies

    3.10. Regional Parent Market Outlook

    3.11. Production and Consumption Statistics

    3.12. Import and Export Statistics

    3.13. Consumers Survey Analysis

    3.14. Macro-Economic Factors

    3.15. Product Claims & Nutritional Information scanned by Buyers

4. Global Analysis 2018 to 2022 and Forecast, 2023 to 2033 

    4.1. Historical Market Size Value (US$ Million) & Volume (MT) Analysis, 2018 to 2022

    4.2. Current and Future Market Size Value (US$ Million) & Volume (MT) Projections, 2023 to 2033

        4.2.1. Y-o-Y Growth Trend Analysis

        4.2.2. Absolute $ Opportunity Analysis

5. Global Analysis 2018 to 2022 and Forecast 2023 to 2033, By Product

    5.1. Introduction / Key Findings

    5.2. Historical Market Size Value (US$ Million) & Volume (MT) Analysis By Product, 2018 to 2022

    5.3. Current and Future Market Size Value (US$ Million) & Volume (MT) Analysis and Forecast By Product, 2023 to 2033

        5.3.1. Compact Precision

        5.3.2. Standard

        5.3.3. Grinding

        5.3.4. Free-Mounted

        5.3.5. Other

    5.4. Y-o-Y Growth Trend Analysis By Product, 2018 to 2022

    5.5. Absolute $ Opportunity Analysis By Product, 2023 to 2033

6. Global Analysis 2018 to 2022 and Forecast 2023 to 2033, By Application

    6.1. Introduction / Key Findings

    6.2. Historical Market Size Value (US$ Million) & Volume (MT) Analysis By Application, 2018 to 2022

    6.3. Current and Future Market Size Value (US$ Million) & Volume (MT) Analysis and Forecast By Application, 2023 to 2033

        6.3.1. Commercial

        6.3.2. Industrial

            6.3.2.1. Plastic Industry

            6.3.2.2. Wood Industry

            6.3.2.3. Metal Industry

    6.4. Y-o-Y Growth Trend Analysis By Application, 2018 to 2022

    6.5. Absolute $ Opportunity Analysis By Application, 2023 to 2033

7. Global Analysis 2018 to 2022 and Forecast 2023 to 2033, By Number of Axis

    7.1. Introduction / Key Findings

    7.2. Historical Market Size Value (US$ Million) & Volume (MT) Analysis By Number of Axis, 2018 to 2022

    7.3. Current and Future Market Size Value (US$ Million) & Volume (MT) Analysis and Forecast By Number of Axis, 2023 to 2033

        7.3.1. 1Axis

            7.3.1.1. X-Travel

            7.3.1.2. Y-Travel

            7.3.1.3. Z-Travel

        7.3.2. 2axis

            7.3.2.1. X-Travel

            7.3.2.2. Y-Travel

            7.3.2.3. Z-Travel

        7.3.3. 3Axis

            7.3.3.1. X-Travel

            7.3.3.2. Y-Travel

            7.3.3.3. Z-Travel

        7.3.4. 5 Axis

        7.3.5. 6axis

        7.3.6. 7axis

        7.3.7. Other

    7.4. Y-o-Y Growth Trend Analysis By Number of Axis, 2018 to 2022

    7.5. Absolute $ Opportunity Analysis By Number of Axis, 2023 to 2033

8. Global Analysis 2018 to 2022 and Forecast 2023 to 2033, By Region

    8.1. Introduction

    8.2. Historical Market Size Value (US$ Million) & Volume (MT) Analysis By Region, 2018 to 2022

    8.3. Current Market Size Value (US$ Million) & Volume (MT) Analysis and Forecast By Region, 2023 to 2033

        8.3.1. North America

        8.3.2. Latin America

        8.3.3. Europe

        8.3.4. East Asia

        8.3.5. South Asia

        8.3.6. Oceania

        8.3.7. Middle East & Africa (MEA)

    8.4. Market Attractiveness Analysis By Region

9. North America Analysis 2018 to 2022 and Forecast 2023 to 2033, By Country

    9.1. Historical Market Size Value (US$ Million) & Volume (MT) Trend Analysis By Market Taxonomy, 2018 to 2022

    9.2. Market Size Value (US$ Million) & Volume (MT) Forecast By Market Taxonomy, 2023 to 2033

        9.2.1. By Country

            9.2.1.1. The US

            9.2.1.2. Canada

        9.2.2. By, Product

        9.2.3. By Application

        9.2.4. By Number of Axis

    9.3. Market Attractiveness Analysis

        9.3.1. By Country

        9.3.2. By, Product

        9.3.3. By Application

        9.3.4. By Number of Axis

    9.4. Key Takeaways

10. Latin America Analysis 2018 to 2022 and Forecast 2023 to 2033, By Country

    10.1. Historical Market Size Value (US$ Million) & Volume (MT) Trend Analysis By Market Taxonomy, 2018 to 2022

    10.2. Market Size Value (US$ Million) & Volume (MT) Forecast By Market Taxonomy, 2023 to 2033

        10.2.1. By Country

            10.2.1.1. Brazil

            10.2.1.2. Mexico

            10.2.1.3. Argentina

            10.2.1.4. Chile

            10.2.1.5. Peru

            10.2.1.6. Rest of Latin America

        10.2.2. By, Product

        10.2.3. By Application

        10.2.4. By Number of Axis

    10.3. Market Attractiveness Analysis

        10.3.1. By Country

        10.3.2. By, Product

        10.3.3. By Application

        10.3.4. By Number of Axis

    10.4. Key Takeaways

11. Europe Analysis 2018 to 2022 and Forecast 2023 to 2033, By Country

    11.1. Historical Market Size Value (US$ Million) & Volume (MT) Trend Analysis By Market Taxonomy, 2018 to 2022

    11.2. Market Size Value (US$ Million) & Volume (MT) Forecast By Market Taxonomy, 2023 to 2033

        11.2.1. By Country

            11.2.1.1. Germany

            11.2.1.2. Italy

            11.2.1.3. France

            11.2.1.4. The UK

            11.2.1.5. Spain

            11.2.1.6. Russia

            11.2.1.7. BENELUX

            11.2.1.8. Poland

            11.2.1.9. Nordic Countries

            11.2.1.10. Rest of Europe

        11.2.2. By, Product

        11.2.3. By Application

        11.2.4. By Number of Axis

    11.3. Market Attractiveness Analysis

        11.3.1. By Country

        11.3.2. By, Product

        11.3.3. By Application

        11.3.4. By Number of Axis

    11.4. Key Takeaways

12. East Asia Analysis 2018 to 2022 and Forecast 2023 to 2033, By Country

    12.1. Historical Market Size Value (US$ Million) & Volume (MT) Trend Analysis By Market Taxonomy, 2018 to 2022

    12.2. Market Size Value (US$ Million) & Volume (MT) Forecast By Market Taxonomy, 2023 to 2033

        12.2.1. By Country

            12.2.1.1. China

            12.2.1.2. Japan

            12.2.1.3. South Korea

        12.2.2. By, Product

        12.2.3. By Application

        12.2.4. By Number of Axis

    12.3. Market Attractiveness Analysis

        12.3.1. By Country

        12.3.2. By, Product

        12.3.3. By Application

        12.3.4. By Number of Axis

    12.4. Key Takeaways

13. South Asia Analysis 2018 to 2022 and Forecast 2023 to 2033, By Country

    13.1. Historical Market Size Value (US$ Million) & Volume (MT) Trend Analysis By Market Taxonomy, 2018 to 2022

    13.2. Market Size Value (US$ Million) & Volume (MT) Forecast By Market Taxonomy, 2023 to 2033

        13.2.1. By Country

            13.2.1.1. India

            13.2.1.2. Thailand

            13.2.1.3. Malaysia

            13.2.1.4. Indonesia

            13.2.1.5. Singapore

            13.2.1.6. Rest of South Asia

        13.2.2. By, Product

        13.2.3. By Application

        13.2.4. By Number of Axis

    13.3. Market Attractiveness Analysis

        13.3.1. By Country

        13.3.2. By, Product

        13.3.3. By Application

        13.3.4. By Number of Axis

    13.4. Key Takeaways

14. Oceania Analysis 2018 to 2022 and Forecast 2023 to 2033, By Country

    14.1. Historical Market Size Value (US$ Million) & Volume (MT) Trend Analysis By Market Taxonomy, 2018 to 2022

    14.2. Market Size Value (US$ Million) & Volume (MT) Forecast By Market Taxonomy, 2023 to 2033

        14.2.1. By Country

            14.2.1.1. Australia

            14.2.1.2. New Zealand

        14.2.2. By Product

        14.2.3. By Application

        14.2.4. By Number of Axis

    14.3. Market Attractiveness Analysis

        14.3.1. By Country

        14.3.2. By Product

        14.3.3. By Application

        14.3.4. By Number of Axis

    14.4. Key Takeaways

15. MEA Analysis 2018 to 2022 and Forecast 2023 to 2033, By Country

    15.1. Historical Market Size Value (US$ Million) & Volume (MT) Trend Analysis By Market Taxonomy, 2018 to 2022

    15.2. Market Size Value (US$ Million) & Volume (MT) Forecast By Market Taxonomy, 2023 to 2033

        15.2.1. By Country

            15.2.1.1. GCC Countries

            15.2.1.2. South Africa

            15.2.1.3. Central Africa

            15.2.1.4. North Africa

        15.2.2. By Product

        15.2.3. By Application

        15.2.4. By Number of Axis

    15.3. Market Attractiveness Analysis

        15.3.1. By Country

        15.3.2. By Product

        15.3.3. By Application

        15.3.4. By Number of Axis

    15.4. Key Takeaways

16. Key Countries Analysis

    16.1. The US

        16.1.1. Pricing Analysis

        16.1.2. Market Share Analysis, 2023

            16.1.2.1. By Product

            16.1.2.2. By Application

            16.1.2.3. By Number of Axis

    16.2. Canada

        16.2.1. Pricing Analysis

        16.2.2. Market Share Analysis, 2023

            16.2.2.1. By Product

            16.2.2.2. By Application

            16.2.2.3. By Number of Axis

    16.3. Brazil

        16.3.1. Pricing Analysis

        16.3.2. Market Share Analysis, 2023

            16.3.2.1. By Product

            16.3.2.2. By Application

            16.3.2.3. By Number of Axis

    16.4. Mexico

        16.4.1. Pricing Analysis

        16.4.2. Market Share Analysis, 2023

            16.4.2.1. By Product

            16.4.2.2. By Application

            16.4.2.3. By Number of Axis

    16.5. Argentina

        16.5.1. Pricing Analysis

        16.5.2. Market Share Analysis, 2023

            16.5.2.1. By Product

            16.5.2.2. By Application

            16.5.2.3. By Number of Axis

    16.6. Chile

        16.6.1. Pricing Analysis

        16.6.2. Market Share Analysis, 2023

            16.6.2.1. By Product

            16.6.2.2. By Application

            16.6.2.3. By Number of Axis

    16.7. Peru

        16.7.1. Pricing Analysis

        16.7.2. Market Share Analysis, 2023

            16.7.2.1. By Product

            16.7.2.2. By Application

            16.7.2.3. By Number of Axis

    16.8. Germany

        16.8.1. Pricing Analysis

        16.8.2. Market Share Analysis, 2023

            16.8.2.1. By Product

            16.8.2.2. By Application

            16.8.2.3. By Number of Axis

    16.9. Italy

        16.9.1. Pricing Analysis

        16.9.2. Market Share Analysis, 2023

            16.9.2.1. By Product

            16.9.2.2. By Application

            16.9.2.3. By Number of Axis

    16.10. France

        16.10.1. Pricing Analysis

        16.10.2. Market Share Analysis, 2023

            16.10.2.1. By Product

            16.10.2.2. By Application

            16.10.2.3. By Number of Axis

    16.11. Spain

        16.11.1. Pricing Analysis

        16.11.2. Market Share Analysis, 2023

            16.11.2.1. By Product

            16.11.2.2. By Application

            16.11.2.3. By Number of Axis

    16.12. The UK

        16.12.1. Pricing Analysis

        16.12.2. Market Share Analysis, 2023

            16.12.2.1. By Product

            16.12.2.2. By Application

            16.12.2.3. By Number of Axis

    16.13. Russia

        16.13.1. Pricing Analysis

        16.13.2. Market Share Analysis, 2023

            16.13.2.1. By Product

            16.13.2.2. By Application

            16.13.2.3. By Number of Axis

    16.14. Poland

        16.14.1. Pricing Analysis

        16.14.2. Market Share Analysis, 2023

            16.14.2.1. By Product

            16.14.2.2. By Application

            16.14.2.3. By Number of Axis

    16.15. BENELUX

        16.15.1. Pricing Analysis

        16.15.2. Market Share Analysis, 2023

            16.15.2.1. By Product

            16.15.2.2. By Application

            16.15.2.3. By Number of Axis

    16.16. Nordic Countries

        16.16.1. Pricing Analysis

        16.16.2. Market Share Analysis, 2023

            16.16.2.1. By Product

            16.16.2.2. By Application

            16.16.2.3. By Number of Axis

    16.17. China

        16.17.1. Pricing Analysis

        16.17.2. Market Share Analysis, 2023

            16.17.2.1. By Product

            16.17.2.2. By Application

            16.17.2.3. By Number of Axis

    16.18. Japan

        16.18.1. Pricing Analysis

        16.18.2. Market Share Analysis, 2023

            16.18.2.1. By Product

            16.18.2.2. By Application

            16.18.2.3. By Number of Axis

    16.19. South Korea

        16.19.1. Pricing Analysis

        16.19.2. Market Share Analysis, 2023

            16.19.2.1. By Product

            16.19.2.2. By Application

            16.19.2.3. By Number of Axis

    16.20. India

        16.20.1. Pricing Analysis

        16.20.2. Market Share Analysis, 2023

            16.20.2.1. By Product

            16.20.2.2. By Application

            16.20.2.3. By Number of Axis

    16.21. Thailand

        16.21.1. Pricing Analysis

        16.21.2. Market Share Analysis, 2023

            16.21.2.1. By Product

            16.21.2.2. By Application

            16.21.2.3. By Number of Axis

    16.22. Indonesia

        16.22.1. Pricing Analysis

        16.22.2. Market Share Analysis, 2023

            16.22.2.1. By Product

            16.22.2.2. By Application

            16.22.2.3. By Number of Axis

    16.23. Malaysia

        16.23.1. Pricing Analysis

        16.23.2. Market Share Analysis, 2023

            16.23.2.1. By Product

            16.23.2.2. By Application

            16.23.2.3. By Number of Axis

    16.24. Singapore

        16.24.1. Pricing Analysis

        16.24.2. Market Share Analysis, 2023

            16.24.2.1. By Product

            16.24.2.2. By Application

            16.24.2.3. By Number of Axis

    16.25. Australia

        16.25.1. Pricing Analysis

        16.25.2. Market Share Analysis, 2023

            16.25.2.1. By Product

            16.25.2.2. By Application

            16.25.2.3. By Number of Axis

    16.26. New Zealand

        16.26.1. Pricing Analysis

        16.26.2. Market Share Analysis, 2023

            16.26.2.1. By Product

            16.26.2.2. By Application

            16.26.2.3. By Number of Axis

    16.27. GCC Countries

        16.27.1. Pricing Analysis

        16.27.2. Market Share Analysis, 2023

            16.27.2.1. By Product

            16.27.2.2. By Application

            16.27.2.3. By Number of Axis

    16.28. South Africa

        16.28.1. Pricing Analysis

        16.28.2. Market Share Analysis, 2023

            16.28.2.1. By Product

            16.28.2.2. By Application

            16.28.2.3. By Number of Axis

    16.29. North Africa

        16.29.1. Pricing Analysis

        16.29.2. Market Share Analysis, 2023

            16.29.2.1. By Product

            16.29.2.2. By Application

            16.29.2.3. By Number of Axis

    16.30. Central Africa

        16.30.1. Pricing Analysis

        16.30.2. Market Share Analysis, 2023

            16.30.2.1. By Product

            16.30.2.2. By Application

            16.30.2.3. By Number of Axis

17. Market Structure Analysis

    17.1. Competition Dashboard

    17.2. Competition Benchmarking

    17.3. Market Share Analysis of Top Players

        17.3.1. By Regional

        17.3.2. By Product

        17.3.3. By Application

        17.3.4. By Number of Axis

18. Competition Analysis

    18.1. Competition Deep Dive

        18.1.1. AVEMAX

            18.1.1.1. Overview

            18.1.1.2. Product Portfolio

            18.1.1.3. Profitability by Market Segments (Product / Age / Sales Channel / Region)

            18.1.1.4. Sales Footprint

            18.1.1.5. Strategy Overview

                18.1.1.5.1. Marketing Strategy

                18.1.1.5.2. Product Strategy

                18.1.1.5.3. Channel Strategy

        18.1.2. AZ spa

            18.1.2.1. Overview

            18.1.2.2. Product Portfolio

            18.1.2.3. Profitability by Market Segments (Product / Age / Sales Channel / Region)

            18.1.2.4. Sales Footprint

            18.1.2.5. Strategy Overview

                18.1.2.5.1. Marketing Strategy

                18.1.2.5.2. Product Strategy

                18.1.2.5.3. Channel Strategy

        18.1.3. AHP PLASTIK MAKINA

            18.1.3.1. Overview

            18.1.3.2. Product Portfolio

            18.1.3.3. Profitability by Market Segments (Product / Age / Sales Channel / Region)

            18.1.3.4. Sales Footprint

            18.1.3.5. Strategy Overview

                18.1.3.5.1. Marketing Strategy

                18.1.3.5.2. Product Strategy

                18.1.3.5.3. Channel Strategy

        18.1.4. Boygo

            18.1.4.1. Overview

            18.1.4.2. Product Portfolio

            18.1.4.3. Profitability by Market Segments (Product / Age / Sales Channel / Region)

            18.1.4.4. Sales Footprint

            18.1.4.5. Strategy Overview

                18.1.4.5.1. Marketing Strategy

                18.1.4.5.2. Product Strategy

                18.1.4.5.3. Channel Strategy

        18.1.5. CAMAM

            18.1.5.1. Overview

            18.1.5.2. Product Portfolio

            18.1.5.3. Profitability by Market Segments (Product / Age / Sales Channel / Region)

            18.1.5.4. Sales Footprint

            18.1.5.5. Strategy Overview

                18.1.5.5.1. Marketing Strategy

                18.1.5.5.2. Product Strategy

                18.1.5.5.3. Channel Strategy

        18.1.6. CAZENEUVE

            18.1.6.1. Overview

            18.1.6.2. Product Portfolio

            18.1.6.3. Profitability by Market Segments (Product / Age / Sales Channel / Region)

            18.1.6.4. Sales Footprint

            18.1.6.5. Strategy Overview

                18.1.6.5.1. Marketing Strategy

                18.1.6.5.2. Product Strategy

                18.1.6.5.3. Channel Strategy

        18.1.7. EMISSA

            18.1.7.1. Overview

            18.1.7.2. Product Portfolio

            18.1.7.3. Profitability by Market Segments (Product / Age / Sales Channel / Region)

            18.1.7.4. Sales Footprint

            18.1.7.5. Strategy Overview

                18.1.7.5.1. Marketing Strategy

                18.1.7.5.2. Product Strategy

                18.1.7.5.3. Channel Strategy

        18.1.8. EMAG GmbH&Co.KG

            18.1.8.1. Overview

            18.1.8.2. Product Portfolio

            18.1.8.3. Profitability by Market Segments (Product / Age / Sales Channel / Region)

            18.1.8.4. Sales Footprint

            18.1.8.5. Strategy Overview

                18.1.8.5.1. Marketing Strategy

                18.1.8.5.2. Product Strategy

                18.1.8.5.3. Channel Strategy

        18.1.9. EURACRYL GmbH

            18.1.9.1. Overview

            18.1.9.2. Product Portfolio

            18.1.9.3. Profitability by Market Segments (Product / Age / Sales Channel / Region)

            18.1.9.4. Sales Footprint

            18.1.9.5. Strategy Overview

                18.1.9.5.1. Marketing Strategy

                18.1.9.5.2. Product Strategy

                18.1.9.5.3. Channel Strategy

        18.1.10. GEORG KESEL

            18.1.10.1. Overview

            18.1.10.2. Product Portfolio

            18.1.10.3. Profitability by Market Segments (Product / Age / Sales Channel / Region)

            18.1.10.4. Sales Footprint

            18.1.10.5. Strategy Overview

                18.1.10.5.1. Marketing Strategy

                18.1.10.5.2. Product Strategy

                18.1.10.5.3. Channel Strategy

        18.1.11. Normaco tools OU

            18.1.11.1. Overview

            18.1.11.2. Product Portfolio

            18.1.11.3. Profitability by Market Segments (Product / Age / Sales Channel / Region)

            18.1.11.4. Sales Footprint

            18.1.11.5. Strategy Overview

                18.1.11.5.1. Marketing Strategy

                18.1.11.5.2. Product Strategy

                18.1.11.5.3. Channel Strategy

        18.1.12. TORNOS

            18.1.12.1. Overview

            18.1.12.2. Product Portfolio

            18.1.12.3. Profitability by Market Segments (Product / Age / Sales Channel / Region)

            18.1.12.4. Sales Footprint

            18.1.12.5. Strategy Overview

                18.1.12.5.1. Marketing Strategy

                18.1.12.5.2. Product Strategy

                18.1.12.5.3. Channel Strategy

        18.1.13. SIBO ENGINEERING

            18.1.13.1. Overview

            18.1.13.2. Product Portfolio

            18.1.13.3. Profitability by Market Segments (Product / Age / Sales Channel / Region)

            18.1.13.4. Sales Footprint

            18.1.13.5. Strategy Overview

                18.1.13.5.1. Marketing Strategy

                18.1.13.5.2. Product Strategy

                18.1.13.5.3. Channel Strategy

19. Assumptions & Acronyms Used

20. Research Methodology

Don't pay for what you don't need

Customize your report by selecting specific countries or regions and save 30%!

List of Tables

Table 1: Global Value (US$ Million) Forecast by Region, 2018 to 2033

Table 2: Global Volume (MT) Forecast by Region, 2018 to 2033

Table 3: Global Value (US$ Million) Forecast by Product, 2018 to 2033

Table 4: Global Volume (MT) Forecast by Product, 2018 to 2033

Table 5: Global Value (US$ Million) Forecast by Application, 2018 to 2033

Table 6: Global Volume (MT) Forecast by Application, 2018 to 2033

Table 7: Global Value (US$ Million) Forecast by Number of Axis, 2018 to 2033

Table 8: Global Volume (MT) Forecast by Number of Axis, 2018 to 2033

Table 9: North America Value (US$ Million) Forecast by Country, 2018 to 2033

Table 10: North America Volume (MT) Forecast by Country, 2018 to 2033

Table 11: North America Value (US$ Million) Forecast by Product, 2018 to 2033

Table 12: North America Volume (MT) Forecast by Product, 2018 to 2033

Table 13: North America Value (US$ Million) Forecast by Application, 2018 to 2033

Table 14: North America Volume (MT) Forecast by Application, 2018 to 2033

Table 15: North America Value (US$ Million) Forecast by Number of Axis, 2018 to 2033

Table 16: North America Volume (MT) Forecast by Number of Axis, 2018 to 2033

Table 17: Latin America Value (US$ Million) Forecast by Country, 2018 to 2033

Table 18: Latin America Volume (MT) Forecast by Country, 2018 to 2033

Table 19: Latin America Value (US$ Million) Forecast by Product, 2018 to 2033

Table 20: Latin America Volume (MT) Forecast by Product, 2018 to 2033

Table 21: Latin America Value (US$ Million) Forecast by Application, 2018 to 2033

Table 22: Latin America Volume (MT) Forecast by Application, 2018 to 2033

Table 23: Latin America Value (US$ Million) Forecast by Number of Axis, 2018 to 2033

Table 24: Latin America Volume (MT) Forecast by Number of Axis, 2018 to 2033

Table 25: Europe Value (US$ Million) Forecast by Country, 2018 to 2033

Table 26: Europe Volume (MT) Forecast by Country, 2018 to 2033

Table 27: Europe Value (US$ Million) Forecast by Product, 2018 to 2033

Table 28: Europe Volume (MT) Forecast by Product, 2018 to 2033

Table 29: Europe Value (US$ Million) Forecast by Application, 2018 to 2033

Table 30: Europe Volume (MT) Forecast by Application, 2018 to 2033

Table 31: Europe Value (US$ Million) Forecast by Number of Axis, 2018 to 2033

Table 32: Europe Volume (MT) Forecast by Number of Axis, 2018 to 2033

Table 33: East Asia Value (US$ Million) Forecast by Country, 2018 to 2033

Table 34: East Asia Volume (MT) Forecast by Country, 2018 to 2033

Table 35: East Asia Value (US$ Million) Forecast by Product, 2018 to 2033

Table 36: East Asia Volume (MT) Forecast by Product, 2018 to 2033

Table 37: East Asia Value (US$ Million) Forecast by Application, 2018 to 2033

Table 38: East Asia Volume (MT) Forecast by Application, 2018 to 2033

Table 39: East Asia Value (US$ Million) Forecast by Number of Axis, 2018 to 2033

Table 40: East Asia Volume (MT) Forecast by Number of Axis, 2018 to 2033

Table 41: South Asia Value (US$ Million) Forecast by Country, 2018 to 2033

Table 42: South Asia Volume (MT) Forecast by Country, 2018 to 2033

Table 43: South Asia Value (US$ Million) Forecast by Product, 2018 to 2033

Table 44: South Asia Volume (MT) Forecast by Product, 2018 to 2033

Table 45: South Asia Value (US$ Million) Forecast by Application, 2018 to 2033

Table 46: South Asia Volume (MT) Forecast by Application, 2018 to 2033

Table 47: South Asia Value (US$ Million) Forecast by Number of Axis, 2018 to 2033

Table 48: South Asia Volume (MT) Forecast by Number of Axis, 2018 to 2033

Table 49: Oceania Value (US$ Million) Forecast by Country, 2018 to 2033

Table 50: Oceania Volume (MT) Forecast by Country, 2018 to 2033

Table 51: Oceania Value (US$ Million) Forecast by Product, 2018 to 2033

Table 52: Oceania Volume (MT) Forecast by Product, 2018 to 2033

Table 53: Oceania Value (US$ Million) Forecast by Application, 2018 to 2033

Table 54: Oceania Volume (MT) Forecast by Application, 2018 to 2033

Table 55: Oceania Value (US$ Million) Forecast by Number of Axis, 2018 to 2033

Table 56: Oceania Volume (MT) Forecast by Number of Axis, 2018 to 2033

Table 57: MEA Value (US$ Million) Forecast by Country, 2018 to 2033

Table 58: MEA Volume (MT) Forecast by Country, 2018 to 2033

Table 59: MEA Value (US$ Million) Forecast by Product, 2018 to 2033

Table 60: MEA Volume (MT) Forecast by Product, 2018 to 2033

Table 61: MEA Value (US$ Million) Forecast by Application, 2018 to 2033

Table 62: MEA Volume (MT) Forecast by Application, 2018 to 2033

Table 63: MEA Value (US$ Million) Forecast by Number of Axis, 2018 to 2033

Table 64: MEA Volume (MT) Forecast by Number of Axis, 2018 to 2033
Nandini Roy Choudhury

Principal Consultant

Talk to Analyst

Find your sweet spots for generating winning opportunities in this market.

List of Charts

Figure 1: Global Value (US$ Million) by Product, 2023 to 2033

Figure 2: Global Value (US$ Million) by Application, 2023 to 2033

Figure 3: Global Value (US$ Million) by Number of Axis, 2023 to 2033

Figure 4: Global Value (US$ Million) by Region, 2023 to 2033

Figure 5: Global Value (US$ Million) Analysis by Region, 2018 to 2033

Figure 6: Global Volume (MT) Analysis by Region, 2018 to 2033

Figure 7: Global Value Share (%) and BPS Analysis by Region, 2023 to 2033

Figure 8: Global Y-o-Y Growth (%) Projections by Region, 2023 to 2033

Figure 9: Global Value (US$ Million) Analysis by Product, 2018 to 2033

Figure 10: Global Volume (MT) Analysis by Product, 2018 to 2033

Figure 11: Global Value Share (%) and BPS Analysis by Product, 2023 to 2033

Figure 12: Global Y-o-Y Growth (%) Projections by Product, 2023 to 2033

Figure 13: Global Value (US$ Million) Analysis by Application, 2018 to 2033

Figure 14: Global Volume (MT) Analysis by Application, 2018 to 2033

Figure 15: Global Value Share (%) and BPS Analysis by Application, 2023 to 2033

Figure 16: Global Y-o-Y Growth (%) Projections by Application, 2023 to 2033

Figure 17: Global Value (US$ Million) Analysis by Number of Axis, 2018 to 2033

Figure 18: Global Volume (MT) Analysis by Number of Axis, 2018 to 2033

Figure 19: Global Value Share (%) and BPS Analysis by Number of Axis, 2023 to 2033

Figure 20: Global Y-o-Y Growth (%) Projections by Number of Axis, 2023 to 2033

Figure 21: Global Attractiveness by Product, 2023 to 2033

Figure 22: Global Attractiveness by Application, 2023 to 2033

Figure 23: Global Attractiveness by Number of Axis, 2023 to 2033

Figure 24: Global Attractiveness by Region, 2023 to 2033

Figure 25: North America Value (US$ Million) by Product, 2023 to 2033

Figure 26: North America Value (US$ Million) by Application, 2023 to 2033

Figure 27: North America Value (US$ Million) by Number of Axis, 2023 to 2033

Figure 28: North America Value (US$ Million) by Country, 2023 to 2033

Figure 29: North America Value (US$ Million) Analysis by Country, 2018 to 2033

Figure 30: North America Volume (MT) Analysis by Country, 2018 to 2033

Figure 31: North America Value Share (%) and BPS Analysis by Country, 2023 to 2033

Figure 32: North America Y-o-Y Growth (%) Projections by Country, 2023 to 2033

Figure 33: North America Value (US$ Million) Analysis by Product, 2018 to 2033

Figure 34: North America Volume (MT) Analysis by Product, 2018 to 2033

Figure 35: North America Value Share (%) and BPS Analysis by Product, 2023 to 2033

Figure 36: North America Y-o-Y Growth (%) Projections by Product, 2023 to 2033

Figure 37: North America Value (US$ Million) Analysis by Application, 2018 to 2033

Figure 38: North America Volume (MT) Analysis by Application, 2018 to 2033

Figure 39: North America Value Share (%) and BPS Analysis by Application, 2023 to 2033

Figure 40: North America Y-o-Y Growth (%) Projections by Application, 2023 to 2033

Figure 41: North America Value (US$ Million) Analysis by Number of Axis, 2018 to 2033

Figure 42: North America Volume (MT) Analysis by Number of Axis, 2018 to 2033

Figure 43: North America Value Share (%) and BPS Analysis by Number of Axis, 2023 to 2033

Figure 44: North America Y-o-Y Growth (%) Projections by Number of Axis, 2023 to 2033

Figure 45: North America Attractiveness by Product, 2023 to 2033

Figure 46: North America Attractiveness by Application, 2023 to 2033

Figure 47: North America Attractiveness by Number of Axis, 2023 to 2033

Figure 48: North America Attractiveness by Country, 2023 to 2033

Figure 49: Latin America Value (US$ Million) by Product, 2023 to 2033

Figure 50: Latin America Value (US$ Million) by Application, 2023 to 2033

Figure 51: Latin America Value (US$ Million) by Number of Axis, 2023 to 2033

Figure 52: Latin America Value (US$ Million) by Country, 2023 to 2033

Figure 53: Latin America Value (US$ Million) Analysis by Country, 2018 to 2033

Figure 54: Latin America Volume (MT) Analysis by Country, 2018 to 2033

Figure 55: Latin America Value Share (%) and BPS Analysis by Country, 2023 to 2033

Figure 56: Latin America Y-o-Y Growth (%) Projections by Country, 2023 to 2033

Figure 57: Latin America Value (US$ Million) Analysis by Product, 2018 to 2033

Figure 58: Latin America Volume (MT) Analysis by Product, 2018 to 2033

Figure 59: Latin America Value Share (%) and BPS Analysis by Product, 2023 to 2033

Figure 60: Latin America Y-o-Y Growth (%) Projections by Product, 2023 to 2033

Figure 61: Latin America Value (US$ Million) Analysis by Application, 2018 to 2033

Figure 62: Latin America Volume (MT) Analysis by Application, 2018 to 2033

Figure 63: Latin America Value Share (%) and BPS Analysis by Application, 2023 to 2033

Figure 64: Latin America Y-o-Y Growth (%) Projections by Application, 2023 to 2033

Figure 65: Latin America Value (US$ Million) Analysis by Number of Axis, 2018 to 2033

Figure 66: Latin America Volume (MT) Analysis by Number of Axis, 2018 to 2033

Figure 67: Latin America Value Share (%) and BPS Analysis by Number of Axis, 2023 to 2033

Figure 68: Latin America Y-o-Y Growth (%) Projections by Number of Axis, 2023 to 2033

Figure 69: Latin America Attractiveness by Product, 2023 to 2033

Figure 70: Latin America Attractiveness by Application, 2023 to 2033

Figure 71: Latin America Attractiveness by Number of Axis, 2023 to 2033

Figure 72: Latin America Attractiveness by Country, 2023 to 2033

Figure 73: Europe Value (US$ Million) by Product, 2023 to 2033

Figure 74: Europe Value (US$ Million) by Application, 2023 to 2033

Figure 75: Europe Value (US$ Million) by Number of Axis, 2023 to 2033

Figure 76: Europe Value (US$ Million) by Country, 2023 to 2033

Figure 77: Europe Value (US$ Million) Analysis by Country, 2018 to 2033

Figure 78: Europe Volume (MT) Analysis by Country, 2018 to 2033

Figure 79: Europe Value Share (%) and BPS Analysis by Country, 2023 to 2033

Figure 80: Europe Y-o-Y Growth (%) Projections by Country, 2023 to 2033

Figure 81: Europe Value (US$ Million) Analysis by Product, 2018 to 2033

Figure 82: Europe Volume (MT) Analysis by Product, 2018 to 2033

Figure 83: Europe Value Share (%) and BPS Analysis by Product, 2023 to 2033

Figure 84: Europe Y-o-Y Growth (%) Projections by Product, 2023 to 2033

Figure 85: Europe Value (US$ Million) Analysis by Application, 2018 to 2033

Figure 86: Europe Volume (MT) Analysis by Application, 2018 to 2033

Figure 87: Europe Value Share (%) and BPS Analysis by Application, 2023 to 2033

Figure 88: Europe Y-o-Y Growth (%) Projections by Application, 2023 to 2033

Figure 89: Europe Value (US$ Million) Analysis by Number of Axis, 2018 to 2033

Figure 90: Europe Volume (MT) Analysis by Number of Axis, 2018 to 2033

Figure 91: Europe Value Share (%) and BPS Analysis by Number of Axis, 2023 to 2033

Figure 92: Europe Y-o-Y Growth (%) Projections by Number of Axis, 2023 to 2033

Figure 93: Europe Attractiveness by Product, 2023 to 2033

Figure 94: Europe Attractiveness by Application, 2023 to 2033

Figure 95: Europe Attractiveness by Number of Axis, 2023 to 2033

Figure 96: Europe Attractiveness by Country, 2023 to 2033

Figure 97: East Asia Value (US$ Million) by Product, 2023 to 2033

Figure 98: East Asia Value (US$ Million) by Application, 2023 to 2033

Figure 99: East Asia Value (US$ Million) by Number of Axis, 2023 to 2033

Figure 100: East Asia Value (US$ Million) by Country, 2023 to 2033

Figure 101: East Asia Value (US$ Million) Analysis by Country, 2018 to 2033

Figure 102: East Asia Volume (MT) Analysis by Country, 2018 to 2033

Figure 103: East Asia Value Share (%) and BPS Analysis by Country, 2023 to 2033

Figure 104: East Asia Y-o-Y Growth (%) Projections by Country, 2023 to 2033

Figure 105: East Asia Value (US$ Million) Analysis by Product, 2018 to 2033

Figure 106: East Asia Volume (MT) Analysis by Product, 2018 to 2033

Figure 107: East Asia Value Share (%) and BPS Analysis by Product, 2023 to 2033

Figure 108: East Asia Y-o-Y Growth (%) Projections by Product, 2023 to 2033

Figure 109: East Asia Value (US$ Million) Analysis by Application, 2018 to 2033

Figure 110: East Asia Volume (MT) Analysis by Application, 2018 to 2033

Figure 111: East Asia Value Share (%) and BPS Analysis by Application, 2023 to 2033

Figure 112: East Asia Y-o-Y Growth (%) Projections by Application, 2023 to 2033

Figure 113: East Asia Value (US$ Million) Analysis by Number of Axis, 2018 to 2033

Figure 114: East Asia Volume (MT) Analysis by Number of Axis, 2018 to 2033

Figure 115: East Asia Value Share (%) and BPS Analysis by Number of Axis, 2023 to 2033

Figure 116: East Asia Y-o-Y Growth (%) Projections by Number of Axis, 2023 to 2033

Figure 117: East Asia Attractiveness by Product, 2023 to 2033

Figure 118: East Asia Attractiveness by Application, 2023 to 2033

Figure 119: East Asia Attractiveness by Number of Axis, 2023 to 2033

Figure 120: East Asia Attractiveness by Country, 2023 to 2033

Figure 121: South Asia Value (US$ Million) by Product, 2023 to 2033

Figure 122: South Asia Value (US$ Million) by Application, 2023 to 2033

Figure 123: South Asia Value (US$ Million) by Number of Axis, 2023 to 2033

Figure 124: South Asia Value (US$ Million) by Country, 2023 to 2033

Figure 125: South Asia Value (US$ Million) Analysis by Country, 2018 to 2033

Figure 126: South Asia Volume (MT) Analysis by Country, 2018 to 2033

Figure 127: South Asia Value Share (%) and BPS Analysis by Country, 2023 to 2033

Figure 128: South Asia Y-o-Y Growth (%) Projections by Country, 2023 to 2033

Figure 129: South Asia Value (US$ Million) Analysis by Product, 2018 to 2033

Figure 130: South Asia Volume (MT) Analysis by Product, 2018 to 2033

Figure 131: South Asia Value Share (%) and BPS Analysis by Product, 2023 to 2033

Figure 132: South Asia Y-o-Y Growth (%) Projections by Product, 2023 to 2033

Figure 133: South Asia Value (US$ Million) Analysis by Application, 2018 to 2033

Figure 134: South Asia Volume (MT) Analysis by Application, 2018 to 2033

Figure 135: South Asia Value Share (%) and BPS Analysis by Application, 2023 to 2033

Figure 136: South Asia Y-o-Y Growth (%) Projections by Application, 2023 to 2033

Figure 137: South Asia Value (US$ Million) Analysis by Number of Axis, 2018 to 2033

Figure 138: South Asia Volume (MT) Analysis by Number of Axis, 2018 to 2033

Figure 139: South Asia Value Share (%) and BPS Analysis by Number of Axis, 2023 to 2033

Figure 140: South Asia Y-o-Y Growth (%) Projections by Number of Axis, 2023 to 2033

Figure 141: South Asia Attractiveness by Product, 2023 to 2033

Figure 142: South Asia Attractiveness by Application, 2023 to 2033

Figure 143: South Asia Attractiveness by Number of Axis, 2023 to 2033

Figure 144: South Asia Attractiveness by Country, 2023 to 2033

Figure 145: Oceania Value (US$ Million) by Product, 2023 to 2033

Figure 146: Oceania Value (US$ Million) by Application, 2023 to 2033

Figure 147: Oceania Value (US$ Million) by Number of Axis, 2023 to 2033

Figure 148: Oceania Value (US$ Million) by Country, 2023 to 2033

Figure 149: Oceania Value (US$ Million) Analysis by Country, 2018 to 2033

Figure 150: Oceania Volume (MT) Analysis by Country, 2018 to 2033

Figure 151: Oceania Value Share (%) and BPS Analysis by Country, 2023 to 2033

Figure 152: Oceania Y-o-Y Growth (%) Projections by Country, 2023 to 2033

Figure 153: Oceania Value (US$ Million) Analysis by Product, 2018 to 2033

Figure 154: Oceania Volume (MT) Analysis by Product, 2018 to 2033

Figure 155: Oceania Value Share (%) and BPS Analysis by Product, 2023 to 2033

Figure 156: Oceania Y-o-Y Growth (%) Projections by Product, 2023 to 2033

Figure 157: Oceania Value (US$ Million) Analysis by Application, 2018 to 2033

Figure 158: Oceania Volume (MT) Analysis by Application, 2018 to 2033

Figure 159: Oceania Value Share (%) and BPS Analysis by Application, 2023 to 2033

Figure 160: Oceania Y-o-Y Growth (%) Projections by Application, 2023 to 2033

Figure 161: Oceania Value (US$ Million) Analysis by Number of Axis, 2018 to 2033

Figure 162: Oceania Volume (MT) Analysis by Number of Axis, 2018 to 2033

Figure 163: Oceania Value Share (%) and BPS Analysis by Number of Axis, 2023 to 2033

Figure 164: Oceania Y-o-Y Growth (%) Projections by Number of Axis, 2023 to 2033

Figure 165: Oceania Attractiveness by Product, 2023 to 2033

Figure 166: Oceania Attractiveness by Application, 2023 to 2033

Figure 167: Oceania Attractiveness by Number of Axis, 2023 to 2033

Figure 168: Oceania Attractiveness by Country, 2023 to 2033

Figure 169: MEA Value (US$ Million) by Product, 2023 to 2033

Figure 170: MEA Value (US$ Million) by Application, 2023 to 2033

Figure 171: MEA Value (US$ Million) by Number of Axis, 2023 to 2033

Figure 172: MEA Value (US$ Million) by Country, 2023 to 2033

Figure 173: MEA Value (US$ Million) Analysis by Country, 2018 to 2033

Figure 174: MEA Volume (MT) Analysis by Country, 2018 to 2033

Figure 175: MEA Value Share (%) and BPS Analysis by Country, 2023 to 2033

Figure 176: MEA Y-o-Y Growth (%) Projections by Country, 2023 to 2033

Figure 177: MEA Value (US$ Million) Analysis by Product, 2018 to 2033

Figure 178: MEA Volume (MT) Analysis by Product, 2018 to 2033

Figure 179: MEA Value Share (%) and BPS Analysis by Product, 2023 to 2033

Figure 180: MEA Y-o-Y Growth (%) Projections by Product, 2023 to 2033

Figure 181: MEA Value (US$ Million) Analysis by Application, 2018 to 2033

Figure 182: MEA Volume (MT) Analysis by Application, 2018 to 2033

Figure 183: MEA Value Share (%) and BPS Analysis by Application, 2023 to 2033

Figure 184: MEA Y-o-Y Growth (%) Projections by Application, 2023 to 2033

Figure 185: MEA Value (US$ Million) Analysis by Number of Axis, 2018 to 2033

Figure 186: MEA Volume (MT) Analysis by Number of Axis, 2018 to 2033

Figure 187: MEA Value Share (%) and BPS Analysis by Number of Axis, 2023 to 2033

Figure 188: MEA Y-o-Y Growth (%) Projections by Number of Axis, 2023 to 2033

Figure 189: MEA Attractiveness by Product, 2023 to 2033

Figure 190: MEA Attractiveness by Application, 2023 to 2033

Figure 191: MEA Attractiveness by Number of Axis, 2023 to 2033

Figure 192: MEA Attractiveness by Country, 2023 to 2033

Explore Process Automation Insights

View Reports

Horizontal Milling Machine Market