Reports

- Global Locations -

Headquarters

Future Market Insights, Inc.

Christiana Corporate, 200
Continental Drive, Suite 401,
Newark, Delaware - 19713,
United States

T: +1-845-579-5705

Americas

Future Market Insights, Inc.

616 Corporate Way, Suite 2-9018,
Valley Cottage, NY 10989, United States

T: +1-347-918-3531

MEA

Future Market Insights

1602-6 Jumeirah Bay X2 Tower, Plot No: JLT-PH2-X2A,
Jumeirah Lakes Towers, Dubai,
United Arab Emirates

Europe

Future Market Insights

3rd Floor, 207 Regent Street,
W1B 3HH London
United Kingdom

T: + 44 (0) 20 8123 9659
D: +44 (0) 20 3287 4268

Asia Pacific

Future Market Insights

IndiaLand Global Tech Park, Unit UG-1, Behind Grand HighStreet, Phase 1, Hinjawadi, MH, Pune – 411057, India

Clamshell Packaging Market Outlook from 2024 to 2034

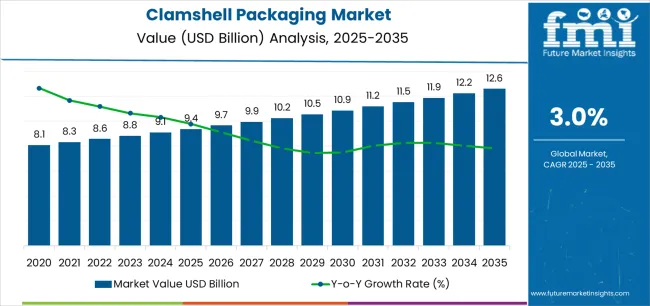
The clamshell packaging market is predicted to thrive at a sluggish CAGR of 3.0% from 2024 to 2034. Key forces anticipated to advance the global clamshell packaging market expansion include the food industry's sharp increase in demand. Additionally, there is a growing shift in manufacturers' and customers' preferences for transparent clamshell packaging, which improves consumer engagement.

The demand revenue of clamshell packaging is estimated to be valued at US$ 9.1 billion in 2024 and is envisioned to achieve a worth of US$ 12.2 billion by 2034. The clamshell packaging solution market is projected to rise favorably due to the increasing demand for different kinds of convenience food services brought on by consumer eating and lifestyle changes.

Attributes Details
Market Value for 2024 US$ 9.1 billion
Market Value for 2034 US$ 12.2 billion
Market CAGR from 2024 to 2034 3.0%

Don't pay for what you don't need

Customize your report by selecting specific countries or regions and save 30%!

Consumer Lifestyles Trends Spur Demand for Clamshell Packaging

Adherence to packaging standards and regulations primarily governs the market growth of clamshell packaging. Clamshell packaging manufacturers work hard to meet regulatory criteria for safety, hygiene, and product information to guarantee that their packaging solutions comply with industry standards.

As consumer habits change, convenient and user-friendly clamshell packaging is in higher demand. Clamshell packaging's easy opening and closing characteristics add to consumer convenience, which fosters market expansion of clamshell packaging.

In October 2021, the United States-based thermoformed end-user manufacturer Jamestown Plastics developed a durable and eco-friendly replacement for clamshell packaging. The container, called Clamtainer, has a one-snap closing mechanism because of patented Click-It Closure technology.

Flexible Packaging Trends Threaten Clamshell Packaging Market’s Competitive Position

The need for environmentally friendly packaging solutions has grown as people's understanding and concern about environmental sustainability have increased. The market acceptability of clamshell packaging is inhibited by criticism that it contributes to plastic waste and pollution because it is frequently composed of non-biodegradable materials.

Packaging design trends and consumer preferences are always changing. Flexible packaging is one such alternative that is preferred because it is more cost-effective, lighter, and more flexible. Due to this shift in preference, the clamshell packaging solution market faces an obstacle in staying competitive.

Attributes Details
Market Value for 2019 US$ 8.1 billion
Market Value for 2023 US$ 8.8 billion
Market CAGR from 2019 to 2023 1.8%
Ismail Sutaria
Ismail Sutaria

Principal Consultant

Talk to Analyst

Find your sweet spots for generating winning opportunities in this market.

Comparative View of the Adjacent Clamshell Packaging Market

Our analyst has studied the stock clamshell packaging market and the protective packaging market in addition to the clamshell packaging market. The data depict the projected market growth of clamshell packaging from 2024 to 2034 with regard to other markets and showcase the potential for revenue in the additional markets.

Clamshell Packaging Market:

Attributes Clamshell Packaging Industry
Value-based CAGR (2024 to 2034) 3.0%
Growth Factor The rise of online shopping is increasing the demand for sturdy shipment packaging, escalating the clamshell packaging demand.
Market Trend More emphasis on packaging materials' recyclability and sustainability surges sales of clamshell packaging.
Market Restraint Materials used in clamshell packaging have high production costs inhibiting the widespread adoption of clamshell packaging.

Stock Clamshell Packaging Market:

Attributes Stock Clamshell Packaging Industry
Value-based CAGR (2024 to 2034) 4.7%
Growth Factor Increasing eCommerce needs safe packaging options to sustain sales of stock clamshell packaging.
Market Trend Customers like goods with obvious packaging, so they are confident of the quality, boosting the demand for stock clamshell packaging.
Market Restraint Negative customer perception brought on by products' accessibility issues hinders the market expansion for stock clamshell packaging.

Protective Packaging Market:

Attributes Protective Packaging Market
Value-based CAGR (2024 to 2034) 4.7%
Growth Factor Increasing online commerce demands the safe transportation of delicate items and spurs protective packaging market growth.
Market Trend Increasing focus on ensuring product quality and safety during transportation escalates the demand for protective packaging.
Market Restraint Environmental issues with using protective materials that don't break down naturally hamper the expansion of the protective packaging market

Category-wise Outlook

The preceding subsection includes the segmented clamshell packaging market analysis. Based on exhaustive analysis, the 2-piece clamshells sector controls the product type category, and the food segment dominates the end use category.

Companies Leverage Clamshell Packaging for Food Packaging as a Branding Tool

Segment Food
Market Share (2024) 62.8%

Clamshell packaging designs provide enough space for product labeling and branding components, improving visibility and identification on crowded store shelves. Food packaging sector frequently use this type of packaging as a branding strategy.

Easy access to pre-packaged food products and accessibility and handling are essential for busy individuals and families. This makes clamshell packaging a convenient option for fast-paced consumers. The food segment takes precedence over the clamshell packaging sales. This is due to the steady need for packaged goods that meet the needs of consumers who are always on the go and for everyday household necessities.

Manufacturers Offer Eye-catching 2-Piece Clamshell to Boost Sales

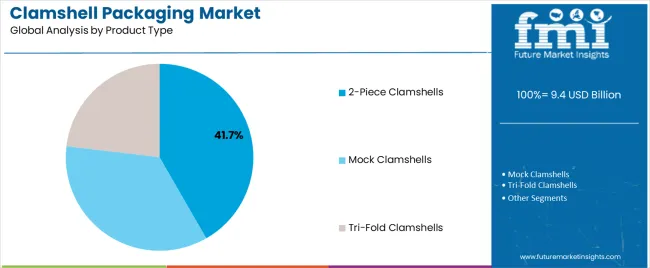
Segment 2-Piece Clamshells
Market Share (2024) 54.2%

Users like to utilize 2-piece clamshells because of their simple, handy design, which makes opening them a pleasure. In response to the growing demand for sustainable packaging, there are increasingly environmentally friendly 2-piece clamshell packaging solutions that satisfy both commercial and environmental goals. For clamshell packaging vendors concerned with optimizing their profit margins, 2-piece clamshells are an economical packaging option.

Get the data you need at a Fraction of the cost

Personalize your report by choosing insights you need
and save 40%!

Country-wise Analysis

The subsequent tables focus on the clamshell packaging market in leading regions, which includes North America, Europe, and Asia Pacific. A comprehensive evaluation demonstrates that Asia Pacific has enormous market opportunities for clamshell packaging.

A Holistic Outlook on the Clamshell Packaging Market in Asia Pacific

Countries Forecasted CAGR (2024 to 2034)
India 6.1%
China 4.7%
Thailand 4.3%
South Korea 2.3%
Japan 1.8%

India Industry Outlook

The India clamshell packaging market is shaped by government programs that support environmentally friendly packaging techniques. The food and beverage industry's reliance on creative packaging solutions compels the demand for clamshell packaging in India. The booming eCommerce sector in India is generating opportunities to expand the clamshell packaging market.

China Industry Outlook

China is an integral provider of packaging materials, and its manufacturing dominance is influencing the market dynamics of clamshell packaging. The China clamshell packaging industry is changing due to strict laws on food safety and packaging standards, emphasizing quality and compliance.

Thailand Industry Outlook

In Thailand, there is a growing demand for portable and convenient clamshell packaging solutions due to consumers' inclination to eat on the go. Changes in consumer lifestyles and Thailand's expanding retail sector accelerate the demand for clamshell packaging.
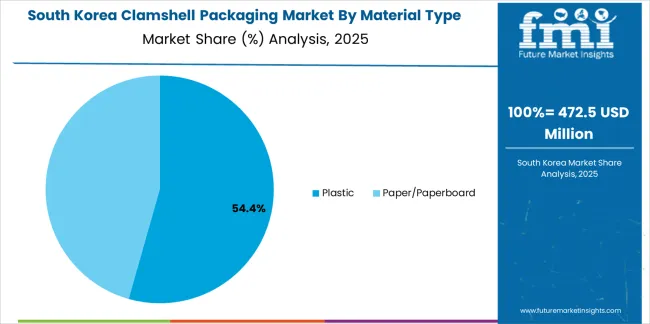
South Korea Industry Outlook

Technological developments in packaging equipment and materials strengthen the effectiveness and quality of clamshell packaging in South Korea. Strict government laws governing the management of packaging trash promote the adoption of recyclable and biodegradable materials in clamshell packaging.
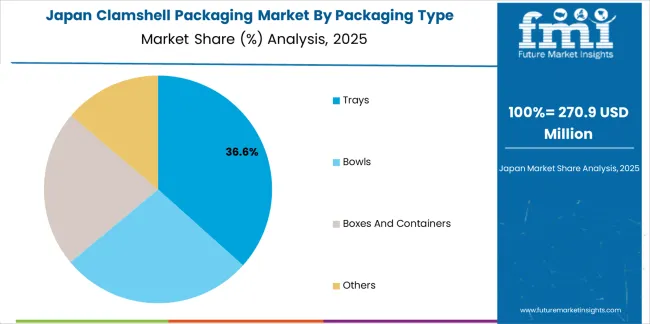
Japan Industry Outlook

Japan's elderly population positively affects trends in packaging design, particularly when it comes to senior-friendly and easily opened clamshell packaging options. A growing focus on eco-friendly and simple packaging designs is transforming the Japan clamshell packaging market.

Dynamics of the North American Clamshell Packaging Sector

Countries Forecasted CAGR (2024 to 2034)
United States 1.8%
Canada 1.2%

The United States Industry Outlook

Innovation in clamshell package designs is stimulated by the United States market's growing inclination toward convenience and on-the-go consumption. The United States clamshell container market is expanding due to increased eCommerce and online shopping, emphasizing safe and durable packaging options.

Canada Industry Outlook

Clamshell packaging is becoming progressively prevalent for online retail, highlighting ease and product safety during transit due to Canada's booming eCommerce industry. The Canada clamshell packaging solution market is shaped by developments in sustainable packaging materials, which are prompted by customer demands for green solutions.

Opportunities for Clamshell Packaging in Europe

Countries Forecasted CAGR (2024 to 2034)
Spain 2.1%
Italy 1.7%
United Kingdom 1.6%
Germany 1.5%
France 1.3%

Spain Industry Outlook

Spain's tourism industry propels the demand for single-serving clamshell packaging for snacks and on-the-go meals. The thriving retail sector in Spain, which encompasses fashion and electronics, plays a significant role in expanding the applications of clamshell packaging beyond food items.

Italy Industry Outlook

In the Italy luxury goods market, cosmetics, fragrances, and fashion accessories require high-end, aesthetically beautiful clamshell packaging. Due to the growth of online food delivery services in Italy, opportunities for safe and tamper-evident clamshell packaging for takeaway and delivery meals have arisen.

The United Kingdom Industry Outlook

The growth of online grocery shopping in the United Kingdom spurs the need for robust and safe clamshell packaging for fresh produce and meal packages. Due to the United Kingdom's thriving pet care industry, there is also a growing need for sturdy, pet-safe clamshell packaging for treats and accessories.
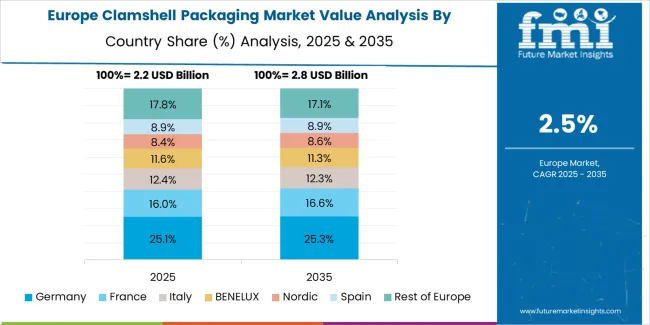
Germany Industry Outlook

The pharmaceutical industry in Germany is booming, so clamshell packaging that is both child- and tamper-proof is required for pharmaceuticals and healthcare items. In Germany's competitive market scenario, the retail premiumization trend drives the use of aesthetically pleasing and customizable clamshell packaging solutions.

France Industry Outlook

Premium and aesthetically pleasing clamshell packaging solutions are in high demand in France due to the country's cosmetics and personal care industry. Consumers' convenience-driven preferences escalate the demand for portion-controlled, resealable clamshell packaging in France for fresh fruit and gourmet goods.
Competitive Analysis

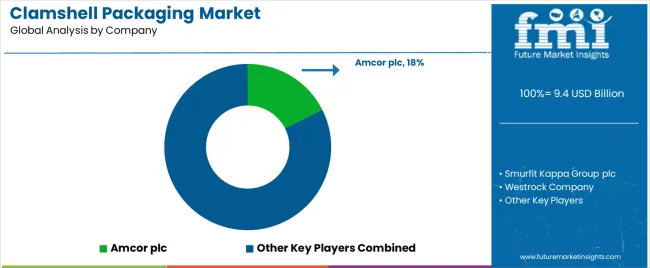
Several key clamshell packaging vendors vie for prominence and market share. Notable clamshell packaging manufacturers form the backbone of the industry, bringing unique expertise and capabilities to the market.

Smurfit Kappa Group plc and Westrock Company are leaders, leveraging their extensive experience and innovative solutions to propel the market growth of clamshell packaging. Parksons Packaging Ltd. and VisiPak Inc. also play significant roles, offering diverse packaging options customized to meet customer needs.

With their specialized solutions and dedication to quality, Prime Packaging LLC, Sonoco Products Company, and Universal Plastics Corporation add to the competitive scene. Amcor plc and Placon Corporation Inc. prioritize their technological innovations and global reach, while Dordan Manufacturing Company, Footprint US, and Novolex Company concentrate on sustainability and environmentally friendly solutions.

The market is distinguished by fierce rivalry and inventiveness, and these major clamshell packaging vendors are paving the path for its future development. As consumer preferences change and the need for effective packaging solutions rises, these clamshell packaging producers are going to be essential to meet industry expectations and thrust the market expansion.

Latest Advancements

Company Details
Sustainable Packaging Coalition (SPC) In November 2023, The Sustainable Packaging Coalition (SPC) released its "Clamshell Recycling Guide" to strengthen the clamshell packaging recycling infrastructure. This project aims to improve the circularity of these materials and solve recycling issues.
Huhtamaki Major packaging solutions provider Huhtamaki debuted Forma paper-based clamshell packaging for fresh fruit in October 2023. Because of its compostability and recyclability, this paper-based solution appeals to environmentally aware customers.
NatureWorks Leading biopolymer manufacturer NatureWorks announced in August 2023 that it is going to collaborate with PAC Packaging to create bio-based clamshell packaging for fruits and vegetables. This action attempts to lessen packaging's negative environmental effects and our reliance on fossil fuels.
WestRock Company WestRock Company announced in February 2022 that it built a new corrugated box manufacturing facility in the Pacific Northwest. The new plant helped the company better meet the growing demand for corrugated packaging, particularly corrugated clamshells.

Top Clamshell Packaging Manufacturers

  • Smurfit Kappa Group plc
  • Westrock Company
  • Parksons Packaging Ltd.
  • VisiPak Inc.
  • Prime Packaging LLC
  • Sonoco Products Company
  • Universal Plastics Corporation
  • Amcor plc
  • Placon Corporation Inc.
  • Dordan Manufacturing Company
  • Footprint USA
  • Novolex Company

Key Coverage in Clamshell Packaging Market Report

  • Significant Changes in Clamshell Packaging Solution Market Dynamics.
  • The Historical, Current, And Projected Size of The Clamshell Packaging Market
  • Evaluation Of Recent Industry Developments of The Clamshell Packaging Industry
  • Adjacent Study on Clamshell Packaging Market, Stock Clamshell Packaging Market, and Protective Packaging Market.
  • Competitive Analysis of Leading Clamshell Packaging Providers with a Focus on Sustainable Packaging Coalition (SPC), Huhtamaki, and Others.

Key Segments

By Packaging Type:

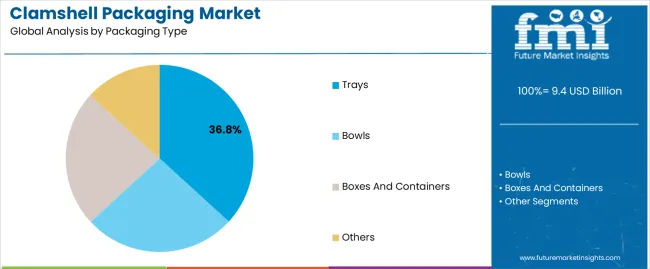
  • Trays
  • Bowls
  • Boxes and Containers
  • Others

By Material Type:

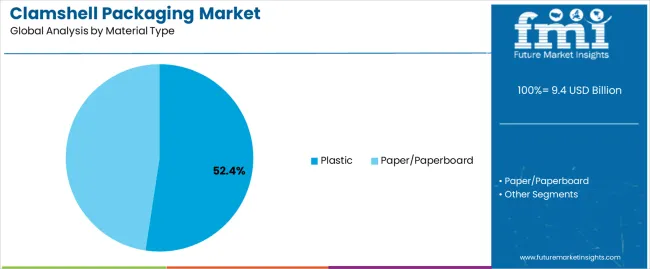
  • Plastic
    • PET
    • PVC
    • PP
    • PS
    • Others
  • Paper/Paperboard

By Product Type:

  • Mock Clamshells
  • 2-Piece Clamshells
  • Tri-Fold Clamshells

By End Use:

  • Food
    • Fruits and Vegetables
    • Ready-to-Eat Food
    • Bakery and Confectionery
    • Frozen Food
    • Others
  • Electrical and Electronics
  • Cosmetics and Personal Care
  • Household Goods
  • Gifts, Toys and Stationery
  • Pharmaceuticals
  • Others

By Region:

  • North America
  • Latin America
  • Western Europe
  • Eastern Europe
  • Asia Pacific excluding Japan (APEJ)
  • Middle East and Africa (MEA)
  • Japan

Frequently Asked Questions

What is the Current Clamshell Packaging Market Valuation?

The clamshell packaging solution market is projected to secure a worth US$ 9.1 billion in 2024.

How Big Can the Clamshell Packaging Market Be by 2034?

The clamshell packaging solution market is estimated to hit US$ 12.2 billion by 2034.

What is the Growth Potential of the Clamshell Packaging Market?

Through 2034, the clamshell packaging solution industry is anticipated to develop at a sluggish CAGR of 3.0%.

What Was the Historical Outlook of The Clamshell Packaging Market?

From 2019 to 2023, the clamshell packaging solution market developed at a slow 1.80% CAGR.

Which Product Type Segment to Lead in the Clamshell Packaging Market?

The 2-piece clamshells sector is projected to possess a market share of 54.2% in 2024.

Which End Use Segment to Command the Clamshell Packaging Market?

A 62.8% market share is expected for the food sector in 2024.

Table of Content

1. Executive Summary

    1.1. Global Market Outlook

    1.2. Demand-side Trends

    1.3. Supply-side Trends

    1.4. Technology Roadmap Analysis

    1.5. Analysis and Recommendations

2. Market Overview

    2.1. Market Coverage / Taxonomy

    2.2. Market Definition / Scope / Limitations

3. Market Background

    3.1. Market Dynamics

        3.1.1. Drivers

        3.1.2. Restraints

        3.1.3. Opportunity

        3.1.4. Trends

    3.2. Scenario Forecast

        3.2.1. Demand in Optimistic Scenario

        3.2.2. Demand in Likely Scenario

        3.2.3. Demand in Conservative Scenario

    3.3. Opportunity Map Analysis

    3.4. Product Life Cycle Analysis

    3.5. Supply Chain Analysis

        3.5.1. Supply Side Participants and their Roles

            3.5.1.1. Manufacturer

            3.5.1.2. Mid-Level Participants (Traders)

            3.5.1.3. Wholesalers and Distributors

        3.5.2. Value Added and Value Created at Node in the Supply Chain

        3.5.3. List of Raw Material Suppliers

        3.5.4. List of Existing and Potential Buyer’s

    3.6. Investment Feasibility Matrix

    3.7. Value Chain Analysis

        3.7.1. Profit Margin Analysis

        3.7.2. Wholesalers and Distributors

        3.7.3. Retailers

    3.8. PESTLE and Porter’s Analysis

    3.9. Regulatory Landscape

        3.9.1. By Key Regions

        3.9.2. By Key Countries

    3.10. Regional Parent Market Outlook

    3.11. Production and Consumption Statistics

    3.12. Import and Export Statistics

4. Global Market Analysis 2019 to 2023 and Forecast, 2024 to 2034

    4.1. Historical Market Size Value (US$ Million) & Volume (Units) Analysis, 2019 to 2023

    4.2. Current and Future Market Size Value (US$ Million) & Volume (Units) Projections, 2024 to 2034

        4.2.1. Y-o-Y Growth Trend Analysis

        4.2.2. Absolute $ Opportunity Analysis

5. Global Market Analysis 2019 to 2023 and Forecast 2024 to 2034, By Packaging Type

    5.1. Introduction / Key Findings

    5.2. Historical Market Size Value (US$ Million) & Volume (Units) Analysis By Packaging Type, 2019 to 2023

    5.3. Current and Future Market Size Value (US$ Million) & Volume (Units) Analysis and Forecast By Packaging Type, 2024 to 2034

        5.3.1. Trays

        5.3.2. Bowls

        5.3.3. Boxes & Containers

        5.3.4. Others

    5.4. Y-o-Y Growth Trend Analysis By Packaging Type, 2019 to 2023

    5.5. Absolute $ Opportunity Analysis By Packaging Type, 2024 to 2034

6. Global Market Analysis 2019 to 2023 and Forecast 2024 to 2034, By Material Type

    6.1. Introduction / Key Findings

    6.2. Historical Market Size Value (US$ Million) & Volume (Units) Analysis By Material Type, 2019 to 2023

    6.3. Current and Future Market Size Value (US$ Million) & Volume (Units) Analysis and Forecast By Material Type, 2024 to 2034

        6.3.1. Plastic

            6.3.1.1. PET

            6.3.1.2. PVC

            6.3.1.3. PP

            6.3.1.4. PS

            6.3.1.5. Others

        6.3.2. Paper/Paperboard

    6.4. Y-o-Y Growth Trend Analysis By Material Type, 2019 to 2023

    6.5. Absolute $ Opportunity Analysis By Material Type, 2024 to 2034

7. Global Market Analysis 2019 to 2023 and Forecast 2024 to 2034, By Product Type

    7.1. Introduction / Key Findings

    7.2. Historical Market Size Value (US$ Million) & Volume (Units) Analysis By Product Type, 2019 to 2023

    7.3. Current and Future Market Size Value (US$ Million) & Volume (Units) Analysis and Forecast By Product Type, 2024 to 2034

        7.3.1. Mock Clamshells

        7.3.2. 2-Piece Clamshells

        7.3.3. Tri-Fold Clamshells

    7.4. Y-o-Y Growth Trend Analysis By Product Type, 2019 to 2023

    7.5. Absolute $ Opportunity Analysis By Product Type, 2024 to 2034

8. Global Market Analysis 2019 to 2023 and Forecast 2024 to 2034, By End User

    8.1. Introduction / Key Findings

    8.2. Historical Market Size Value (US$ Million) & Volume (Units) Analysis By End User, 2019 to 2023

    8.3. Current and Future Market Size Value (US$ Million) & Volume (Units) Analysis and Forecast By End User, 2024 to 2034

        8.3.1. Food

            8.3.1.1. Fruits & Vegetables

            8.3.1.2. Ready-to-Eat Food

            8.3.1.3. Bakery & Confectionery

            8.3.1.4. Frozen Food

            8.3.1.5. Others

        8.3.2. Electrical & Electronics

        8.3.3. Cosmetics & Personal Care

        8.3.4. Household Goods

        8.3.5. Gifts, Toys & Stationery

        8.3.6. Pharmaceuticals

        8.3.7. Others

    8.4. Y-o-Y Growth Trend Analysis By End User, 2019 to 2023

    8.5. Absolute $ Opportunity Analysis By End User, 2024 to 2034

9. Global Market Analysis 2019 to 2023 and Forecast 2024 to 2034, By Region

    9.1. Introduction

    9.2. Historical Market Size Value (US$ Million) & Volume (Units) Analysis By Region, 2019 to 2023

    9.3. Current Market Size Value (US$ Million) & Volume (Units) Analysis and Forecast By Region, 2024 to 2034

        9.3.1. North America

        9.3.2. Latin America

        9.3.3. Western Europe

        9.3.4. Eastern Europe

        9.3.5. South Asia and Pacific

        9.3.6. East Asia

        9.3.7. Middle East and Africa

    9.4. Market Attractiveness Analysis By Region

10. North America Market Analysis 2019 to 2023 and Forecast 2024 to 2034, By Country

    10.1. Historical Market Size Value (US$ Million) & Volume (Units) Trend Analysis By Market Taxonomy, 2019 to 2023

    10.2. Market Size Value (US$ Million) & Volume (Units) Forecast By Market Taxonomy, 2024 to 2034

        10.2.1. By Country

            10.2.1.1. USA

            10.2.1.2. Canada

        10.2.2. By Packaging Type

        10.2.3. By Material Type

        10.2.4. By Product Type

        10.2.5. By End User

    10.3. Market Attractiveness Analysis

        10.3.1. By Country

        10.3.2. By Packaging Type

        10.3.3. By Material Type

        10.3.4. By Product Type

        10.3.5. By End User

    10.4. Key Takeaways

11. Latin America Market Analysis 2019 to 2023 and Forecast 2024 to 2034, By Country

    11.1. Historical Market Size Value (US$ Million) & Volume (Units) Trend Analysis By Market Taxonomy, 2019 to 2023

    11.2. Market Size Value (US$ Million) & Volume (Units) Forecast By Market Taxonomy, 2024 to 2034

        11.2.1. By Country

            11.2.1.1. Brazil

            11.2.1.2. Mexico

            11.2.1.3. Rest of Latin America

        11.2.2. By Packaging Type

        11.2.3. By Material Type

        11.2.4. By Product Type

        11.2.5. By End User

    11.3. Market Attractiveness Analysis

        11.3.1. By Country

        11.3.2. By Packaging Type

        11.3.3. By Material Type

        11.3.4. By Product Type

        11.3.5. By End User

    11.4. Key Takeaways

12. Western Europe Market Analysis 2019 to 2023 and Forecast 2024 to 2034, By Country

    12.1. Historical Market Size Value (US$ Million) & Volume (Units) Trend Analysis By Market Taxonomy, 2019 to 2023

    12.2. Market Size Value (US$ Million) & Volume (Units) Forecast By Market Taxonomy, 2024 to 2034

        12.2.1. By Country

            12.2.1.1. Germany

            12.2.1.2. UK

            12.2.1.3. France

            12.2.1.4. Spain

            12.2.1.5. Italy

            12.2.1.6. Rest of Western Europe

        12.2.2. By Packaging Type

        12.2.3. By Material Type

        12.2.4. By Product Type

        12.2.5. By End User

    12.3. Market Attractiveness Analysis

        12.3.1. By Country

        12.3.2. By Packaging Type

        12.3.3. By Material Type

        12.3.4. By Product Type

        12.3.5. By End User

    12.4. Key Takeaways

13. Eastern Europe Market Analysis 2019 to 2023 and Forecast 2024 to 2034, By Country

    13.1. Historical Market Size Value (US$ Million) & Volume (Units) Trend Analysis By Market Taxonomy, 2019 to 2023

    13.2. Market Size Value (US$ Million) & Volume (Units) Forecast By Market Taxonomy, 2024 to 2034

        13.2.1. By Country

            13.2.1.1. Poland

            13.2.1.2. Russia

            13.2.1.3. Czech Republic

            13.2.1.4. Romania

            13.2.1.5. Rest of Eastern Europe

        13.2.2. By Packaging Type

        13.2.3. By Material Type

        13.2.4. By Product Type

        13.2.5. By End User

    13.3. Market Attractiveness Analysis

        13.3.1. By Country

        13.3.2. By Packaging Type

        13.3.3. By Material Type

        13.3.4. By Product Type

        13.3.5. By End User

    13.4. Key Takeaways

14. South Asia and Pacific Market Analysis 2019 to 2023 and Forecast 2024 to 2034, By Country

    14.1. Historical Market Size Value (US$ Million) & Volume (Units) Trend Analysis By Market Taxonomy, 2019 to 2023

    14.2. Market Size Value (US$ Million) & Volume (Units) Forecast By Market Taxonomy, 2024 to 2034

        14.2.1. By Country

            14.2.1.1. India

            14.2.1.2. Bangladesh

            14.2.1.3. Australia

            14.2.1.4. New Zealand

            14.2.1.5. Rest of South Asia and Pacific

        14.2.2. By Packaging Type

        14.2.3. By Material Type

        14.2.4. By Product Type

        14.2.5. By End User

    14.3. Market Attractiveness Analysis

        14.3.1. By Country

        14.3.2. By Packaging Type

        14.3.3. By Material Type

        14.3.4. By Product Type

        14.3.5. By End User

    14.4. Key Takeaways

15. East Asia Market Analysis 2019 to 2023 and Forecast 2024 to 2034, By Country

    15.1. Historical Market Size Value (US$ Million) & Volume (Units) Trend Analysis By Market Taxonomy, 2019 to 2023

    15.2. Market Size Value (US$ Million) & Volume (Units) Forecast By Market Taxonomy, 2024 to 2034

        15.2.1. By Country

            15.2.1.1. China

            15.2.1.2. Japan

            15.2.1.3. South Korea

        15.2.2. By Packaging Type

        15.2.3. By Material Type

        15.2.4. By Product Type

        15.2.5. By End User

    15.3. Market Attractiveness Analysis

        15.3.1. By Country

        15.3.2. By Packaging Type

        15.3.3. By Material Type

        15.3.4. By Product Type

        15.3.5. By End User

    15.4. Key Takeaways

16. Middle East and Africa Market Analysis 2019 to 2023 and Forecast 2024 to 2034, By Country

    16.1. Historical Market Size Value (US$ Million) & Volume (Units) Trend Analysis By Market Taxonomy, 2019 to 2023

    16.2. Market Size Value (US$ Million) & Volume (Units) Forecast By Market Taxonomy, 2024 to 2034

        16.2.1. By Country

            16.2.1.1. GCC Countries

            16.2.1.2. South Africa

            16.2.1.3. Israel

            16.2.1.4. Rest of MEA

        16.2.2. By Packaging Type

        16.2.3. By Material Type

        16.2.4. By Product Type

        16.2.5. By End User

    16.3. Market Attractiveness Analysis

        16.3.1. By Country

        16.3.2. By Packaging Type

        16.3.3. By Material Type

        16.3.4. By Product Type

        16.3.5. By End User

    16.4. Key Takeaways

17. Key Countries Market Analysis

    17.1. USA

        17.1.1. Pricing Analysis

        17.1.2. Market Share Analysis, 2023

            17.1.2.1. By Packaging Type

            17.1.2.2. By Material Type

            17.1.2.3. By Product Type

            17.1.2.4. By End User

    17.2. Canada

        17.2.1. Pricing Analysis

        17.2.2. Market Share Analysis, 2023

            17.2.2.1. By Packaging Type

            17.2.2.2. By Material Type

            17.2.2.3. By Product Type

            17.2.2.4. By End User

    17.3. Brazil

        17.3.1. Pricing Analysis

        17.3.2. Market Share Analysis, 2023

            17.3.2.1. By Packaging Type

            17.3.2.2. By Material Type

            17.3.2.3. By Product Type

            17.3.2.4. By End User

    17.4. Mexico

        17.4.1. Pricing Analysis

        17.4.2. Market Share Analysis, 2023

            17.4.2.1. By Packaging Type

            17.4.2.2. By Material Type

            17.4.2.3. By Product Type

            17.4.2.4. By End User

    17.5. Germany

        17.5.1. Pricing Analysis

        17.5.2. Market Share Analysis, 2023

            17.5.2.1. By Packaging Type

            17.5.2.2. By Material Type

            17.5.2.3. By Product Type

            17.5.2.4. By End User

    17.6. UK

        17.6.1. Pricing Analysis

        17.6.2. Market Share Analysis, 2023

            17.6.2.1. By Packaging Type

            17.6.2.2. By Material Type

            17.6.2.3. By Product Type

            17.6.2.4. By End User

    17.7. France

        17.7.1. Pricing Analysis

        17.7.2. Market Share Analysis, 2023

            17.7.2.1. By Packaging Type

            17.7.2.2. By Material Type

            17.7.2.3. By Product Type

            17.7.2.4. By End User

    17.8. Spain

        17.8.1. Pricing Analysis

        17.8.2. Market Share Analysis, 2023

            17.8.2.1. By Packaging Type

            17.8.2.2. By Material Type

            17.8.2.3. By Product Type

            17.8.2.4. By End User

    17.9. Italy

        17.9.1. Pricing Analysis

        17.9.2. Market Share Analysis, 2023

            17.9.2.1. By Packaging Type

            17.9.2.2. By Material Type

            17.9.2.3. By Product Type

            17.9.2.4. By End User

    17.10. Poland

        17.10.1. Pricing Analysis

        17.10.2. Market Share Analysis, 2023

            17.10.2.1. By Packaging Type

            17.10.2.2. By Material Type

            17.10.2.3. By Product Type

            17.10.2.4. By End User

    17.11. Russia

        17.11.1. Pricing Analysis

        17.11.2. Market Share Analysis, 2023

            17.11.2.1. By Packaging Type

            17.11.2.2. By Material Type

            17.11.2.3. By Product Type

            17.11.2.4. By End User

    17.12. Czech Republic

        17.12.1. Pricing Analysis

        17.12.2. Market Share Analysis, 2023

            17.12.2.1. By Packaging Type

            17.12.2.2. By Material Type

            17.12.2.3. By Product Type

            17.12.2.4. By End User

    17.13. Romania

        17.13.1. Pricing Analysis

        17.13.2. Market Share Analysis, 2023

            17.13.2.1. By Packaging Type

            17.13.2.2. By Material Type

            17.13.2.3. By Product Type

            17.13.2.4. By End User

    17.14. India

        17.14.1. Pricing Analysis

        17.14.2. Market Share Analysis, 2023

            17.14.2.1. By Packaging Type

            17.14.2.2. By Material Type

            17.14.2.3. By Product Type

            17.14.2.4. By End User

    17.15. Bangladesh

        17.15.1. Pricing Analysis

        17.15.2. Market Share Analysis, 2023

            17.15.2.1. By Packaging Type

            17.15.2.2. By Material Type

            17.15.2.3. By Product Type

            17.15.2.4. By End User

    17.16. Australia

        17.16.1. Pricing Analysis

        17.16.2. Market Share Analysis, 2023

            17.16.2.1. By Packaging Type

            17.16.2.2. By Material Type

            17.16.2.3. By Product Type

            17.16.2.4. By End User

    17.17. New Zealand

        17.17.1. Pricing Analysis

        17.17.2. Market Share Analysis, 2023

            17.17.2.1. By Packaging Type

            17.17.2.2. By Material Type

            17.17.2.3. By Product Type

            17.17.2.4. By End User

    17.18. China

        17.18.1. Pricing Analysis

        17.18.2. Market Share Analysis, 2023

            17.18.2.1. By Packaging Type

            17.18.2.2. By Material Type

            17.18.2.3. By Product Type

            17.18.2.4. By End User

    17.19. Japan

        17.19.1. Pricing Analysis

        17.19.2. Market Share Analysis, 2023

            17.19.2.1. By Packaging Type

            17.19.2.2. By Material Type

            17.19.2.3. By Product Type

            17.19.2.4. By End User

    17.20. South Korea

        17.20.1. Pricing Analysis

        17.20.2. Market Share Analysis, 2023

            17.20.2.1. By Packaging Type

            17.20.2.2. By Material Type

            17.20.2.3. By Product Type

            17.20.2.4. By End User

    17.21. GCC Countries

        17.21.1. Pricing Analysis

        17.21.2. Market Share Analysis, 2023

            17.21.2.1. By Packaging Type

            17.21.2.2. By Material Type

            17.21.2.3. By Product Type

            17.21.2.4. By End User

    17.22. South Africa

        17.22.1. Pricing Analysis

        17.22.2. Market Share Analysis, 2023

            17.22.2.1. By Packaging Type

            17.22.2.2. By Material Type

            17.22.2.3. By Product Type

            17.22.2.4. By End User

    17.23. Israel

        17.23.1. Pricing Analysis

        17.23.2. Market Share Analysis, 2023

            17.23.2.1. By Packaging Type

            17.23.2.2. By Material Type

            17.23.2.3. By Product Type

            17.23.2.4. By End User

18. Market Structure Analysis

    18.1. Competition Dashboard

    18.2. Competition Benchmarking

    18.3. Market Share Analysis of Top Players

        18.3.1. By Regional

        18.3.2. By Packaging Type

        18.3.3. By Material Type

        18.3.4. By Product Type

        18.3.5. By End User

19. Competition Analysis

    19.1. Competition Deep Dive

        19.1.1. Smurfit Kappa Group plc

            19.1.1.1. Overview

            19.1.1.2. Product Portfolio

            19.1.1.3. Profitability by Market Segments

            19.1.1.4. Sales Footprint

            19.1.1.5. Strategy Overview

                19.1.1.5.1. Marketing Strategy

                19.1.1.5.2. Product Strategy

                19.1.1.5.3. Channel Strategy

        19.1.2. Westrock Company

            19.1.2.1. Overview

            19.1.2.2. Product Portfolio

            19.1.2.3. Profitability by Market Segments

            19.1.2.4. Sales Footprint

            19.1.2.5. Strategy Overview

                19.1.2.5.1. Marketing Strategy

                19.1.2.5.2. Product Strategy

                19.1.2.5.3. Channel Strategy

        19.1.3. Parksons Packaging Ltd.

            19.1.3.1. Overview

            19.1.3.2. Product Portfolio

            19.1.3.3. Profitability by Market Segments

            19.1.3.4. Sales Footprint

            19.1.3.5. Strategy Overview

                19.1.3.5.1. Marketing Strategy

                19.1.3.5.2. Product Strategy

                19.1.3.5.3. Channel Strategy

        19.1.4. VisiPak Inc.

            19.1.4.1. Overview

            19.1.4.2. Product Portfolio

            19.1.4.3. Profitability by Market Segments

            19.1.4.4. Sales Footprint

            19.1.4.5. Strategy Overview

                19.1.4.5.1. Marketing Strategy

                19.1.4.5.2. Product Strategy

                19.1.4.5.3. Channel Strategy

        19.1.5. Prime Packaging LLC

            19.1.5.1. Overview

            19.1.5.2. Product Portfolio

            19.1.5.3. Profitability by Market Segments

            19.1.5.4. Sales Footprint

            19.1.5.5. Strategy Overview

                19.1.5.5.1. Marketing Strategy

                19.1.5.5.2. Product Strategy

                19.1.5.5.3. Channel Strategy

        19.1.6. Sonoco Products Company

            19.1.6.1. Overview

            19.1.6.2. Product Portfolio

            19.1.6.3. Profitability by Market Segments

            19.1.6.4. Sales Footprint

            19.1.6.5. Strategy Overview

                19.1.6.5.1. Marketing Strategy

                19.1.6.5.2. Product Strategy

                19.1.6.5.3. Channel Strategy

        19.1.7. Universal Plastics Corporation

            19.1.7.1. Overview

            19.1.7.2. Product Portfolio

            19.1.7.3. Profitability by Market Segments

            19.1.7.4. Sales Footprint

            19.1.7.5. Strategy Overview

                19.1.7.5.1. Marketing Strategy

                19.1.7.5.2. Product Strategy

                19.1.7.5.3. Channel Strategy

        19.1.8. Amcor plc

            19.1.8.1. Overview

            19.1.8.2. Product Portfolio

            19.1.8.3. Profitability by Market Segments

            19.1.8.4. Sales Footprint

            19.1.8.5. Strategy Overview

                19.1.8.5.1. Marketing Strategy

                19.1.8.5.2. Product Strategy

                19.1.8.5.3. Channel Strategy

        19.1.9. Placon Corporation Inc.

            19.1.9.1. Overview

            19.1.9.2. Product Portfolio

            19.1.9.3. Profitability by Market Segments

            19.1.9.4. Sales Footprint

            19.1.9.5. Strategy Overview

                19.1.9.5.1. Marketing Strategy

                19.1.9.5.2. Product Strategy

                19.1.9.5.3. Channel Strategy

        19.1.10. Dordan Manufacturing Company

            19.1.10.1. Overview

            19.1.10.2. Product Portfolio

            19.1.10.3. Profitability by Market Segments

            19.1.10.4. Sales Footprint

            19.1.10.5. Strategy Overview

                19.1.10.5.1. Marketing Strategy

                19.1.10.5.2. Product Strategy

                19.1.10.5.3. Channel Strategy

        19.1.11. Footprint USA

            19.1.11.1. Overview

            19.1.11.2. Product Portfolio

            19.1.11.3. Profitability by Market Segments

            19.1.11.4. Sales Footprint

            19.1.11.5. Strategy Overview

                19.1.11.5.1. Marketing Strategy

                19.1.11.5.2. Product Strategy

                19.1.11.5.3. Channel Strategy

        19.1.12. Novolex Company

            19.1.12.1. Overview

            19.1.12.2. Product Portfolio

            19.1.12.3. Profitability by Market Segments

            19.1.12.4. Sales Footprint

            19.1.12.5. Strategy Overview

                19.1.12.5.1. Marketing Strategy

                19.1.12.5.2. Product Strategy

                19.1.12.5.3. Channel Strategy

20. Assumptions & Acronyms Used

21. Research Methodology

Don't pay for what you don't need

Customize your report by selecting specific countries or regions and save 30%!

List of Tables

Table 1: Global Market Value (US$ Million) Forecast by Region, 2019 to 2034

Table 2: Global Market Volume (Units) Forecast by Region, 2019 to 2034

Table 3: Global Market Value (US$ Million) Forecast by Packaging Type, 2019 to 2034

Table 4: Global Market Volume (Units) Forecast by Packaging Type, 2019 to 2034

Table 5: Global Market Value (US$ Million) Forecast by Material Type, 2019 to 2034

Table 6: Global Market Volume (Units) Forecast by Material Type, 2019 to 2034

Table 7: Global Market Value (US$ Million) Forecast by Product Type, 2019 to 2034

Table 8: Global Market Volume (Units) Forecast by Product Type, 2019 to 2034

Table 9: Global Market Value (US$ Million) Forecast by End User, 2019 to 2034

Table 10: Global Market Volume (Units) Forecast by End User, 2019 to 2034

Table 11: North America Market Value (US$ Million) Forecast by Country, 2019 to 2034

Table 12: North America Market Volume (Units) Forecast by Country, 2019 to 2034

Table 13: North America Market Value (US$ Million) Forecast by Packaging Type, 2019 to 2034

Table 14: North America Market Volume (Units) Forecast by Packaging Type, 2019 to 2034

Table 15: North America Market Value (US$ Million) Forecast by Material Type, 2019 to 2034

Table 16: North America Market Volume (Units) Forecast by Material Type, 2019 to 2034

Table 17: North America Market Value (US$ Million) Forecast by Product Type, 2019 to 2034

Table 18: North America Market Volume (Units) Forecast by Product Type, 2019 to 2034

Table 19: North America Market Value (US$ Million) Forecast by End User, 2019 to 2034

Table 20: North America Market Volume (Units) Forecast by End User, 2019 to 2034

Table 21: Latin America Market Value (US$ Million) Forecast by Country, 2019 to 2034

Table 22: Latin America Market Volume (Units) Forecast by Country, 2019 to 2034

Table 23: Latin America Market Value (US$ Million) Forecast by Packaging Type, 2019 to 2034

Table 24: Latin America Market Volume (Units) Forecast by Packaging Type, 2019 to 2034

Table 25: Latin America Market Value (US$ Million) Forecast by Material Type, 2019 to 2034

Table 26: Latin America Market Volume (Units) Forecast by Material Type, 2019 to 2034

Table 27: Latin America Market Value (US$ Million) Forecast by Product Type, 2019 to 2034

Table 28: Latin America Market Volume (Units) Forecast by Product Type, 2019 to 2034

Table 29: Latin America Market Value (US$ Million) Forecast by End User, 2019 to 2034

Table 30: Latin America Market Volume (Units) Forecast by End User, 2019 to 2034

Table 31: Western Europe Market Value (US$ Million) Forecast by Country, 2019 to 2034

Table 32: Western Europe Market Volume (Units) Forecast by Country, 2019 to 2034

Table 33: Western Europe Market Value (US$ Million) Forecast by Packaging Type, 2019 to 2034

Table 34: Western Europe Market Volume (Units) Forecast by Packaging Type, 2019 to 2034

Table 35: Western Europe Market Value (US$ Million) Forecast by Material Type, 2019 to 2034

Table 36: Western Europe Market Volume (Units) Forecast by Material Type, 2019 to 2034

Table 37: Western Europe Market Value (US$ Million) Forecast by Product Type, 2019 to 2034

Table 38: Western Europe Market Volume (Units) Forecast by Product Type, 2019 to 2034

Table 39: Western Europe Market Value (US$ Million) Forecast by End User, 2019 to 2034

Table 40: Western Europe Market Volume (Units) Forecast by End User, 2019 to 2034

Table 41: Eastern Europe Market Value (US$ Million) Forecast by Country, 2019 to 2034

Table 42: Eastern Europe Market Volume (Units) Forecast by Country, 2019 to 2034

Table 43: Eastern Europe Market Value (US$ Million) Forecast by Packaging Type, 2019 to 2034

Table 44: Eastern Europe Market Volume (Units) Forecast by Packaging Type, 2019 to 2034

Table 45: Eastern Europe Market Value (US$ Million) Forecast by Material Type, 2019 to 2034

Table 46: Eastern Europe Market Volume (Units) Forecast by Material Type, 2019 to 2034

Table 47: Eastern Europe Market Value (US$ Million) Forecast by Product Type, 2019 to 2034

Table 48: Eastern Europe Market Volume (Units) Forecast by Product Type, 2019 to 2034

Table 49: Eastern Europe Market Value (US$ Million) Forecast by End User, 2019 to 2034

Table 50: Eastern Europe Market Volume (Units) Forecast by End User, 2019 to 2034

Table 51: South Asia and Pacific Market Value (US$ Million) Forecast by Country, 2019 to 2034

Table 52: South Asia and Pacific Market Volume (Units) Forecast by Country, 2019 to 2034

Table 53: South Asia and Pacific Market Value (US$ Million) Forecast by Packaging Type, 2019 to 2034

Table 54: South Asia and Pacific Market Volume (Units) Forecast by Packaging Type, 2019 to 2034

Table 55: South Asia and Pacific Market Value (US$ Million) Forecast by Material Type, 2019 to 2034

Table 56: South Asia and Pacific Market Volume (Units) Forecast by Material Type, 2019 to 2034

Table 57: South Asia and Pacific Market Value (US$ Million) Forecast by Product Type, 2019 to 2034

Table 58: South Asia and Pacific Market Volume (Units) Forecast by Product Type, 2019 to 2034

Table 59: South Asia and Pacific Market Value (US$ Million) Forecast by End User, 2019 to 2034

Table 60: South Asia and Pacific Market Volume (Units) Forecast by End User, 2019 to 2034

Table 61: East Asia Market Value (US$ Million) Forecast by Country, 2019 to 2034

Table 62: East Asia Market Volume (Units) Forecast by Country, 2019 to 2034

Table 63: East Asia Market Value (US$ Million) Forecast by Packaging Type, 2019 to 2034

Table 64: East Asia Market Volume (Units) Forecast by Packaging Type, 2019 to 2034

Table 65: East Asia Market Value (US$ Million) Forecast by Material Type, 2019 to 2034

Table 66: East Asia Market Volume (Units) Forecast by Material Type, 2019 to 2034

Table 67: East Asia Market Value (US$ Million) Forecast by Product Type, 2019 to 2034

Table 68: East Asia Market Volume (Units) Forecast by Product Type, 2019 to 2034

Table 69: East Asia Market Value (US$ Million) Forecast by End User, 2019 to 2034

Table 70: East Asia Market Volume (Units) Forecast by End User, 2019 to 2034

Table 71: Middle East and Africa Market Value (US$ Million) Forecast by Country, 2019 to 2034

Table 72: Middle East and Africa Market Volume (Units) Forecast by Country, 2019 to 2034

Table 73: Middle East and Africa Market Value (US$ Million) Forecast by Packaging Type, 2019 to 2034

Table 74: Middle East and Africa Market Volume (Units) Forecast by Packaging Type, 2019 to 2034

Table 75: Middle East and Africa Market Value (US$ Million) Forecast by Material Type, 2019 to 2034

Table 76: Middle East and Africa Market Volume (Units) Forecast by Material Type, 2019 to 2034

Table 77: Middle East and Africa Market Value (US$ Million) Forecast by Product Type, 2019 to 2034

Table 78: Middle East and Africa Market Volume (Units) Forecast by Product Type, 2019 to 2034

Table 79: Middle East and Africa Market Value (US$ Million) Forecast by End User, 2019 to 2034

Table 80: Middle East and Africa Market Volume (Units) Forecast by End User, 2019 to 2034
Ismail Sutaria
Ismail Sutaria

Principal Consultant

Talk to Analyst

Find your sweet spots for generating winning opportunities in this market.

List of Charts

Figure 1: Global Market Value (US$ Million) by Packaging Type, 2024 to 2034

Figure 2: Global Market Value (US$ Million) by Material Type, 2024 to 2034

Figure 3: Global Market Value (US$ Million) by Product Type, 2024 to 2034

Figure 4: Global Market Value (US$ Million) by End User, 2024 to 2034

Figure 5: Global Market Value (US$ Million) by Region, 2024 to 2034

Figure 6: Global Market Value (US$ Million) Analysis by Region, 2019 to 2034

Figure 7: Global Market Volume (Units) Analysis by Region, 2019 to 2034

Figure 8: Global Market Value Share (%) and BPS Analysis by Region, 2024 to 2034

Figure 9: Global Market Y-o-Y Growth (%) Projections by Region, 2024 to 2034

Figure 10: Global Market Value (US$ Million) Analysis by Packaging Type, 2019 to 2034

Figure 11: Global Market Volume (Units) Analysis by Packaging Type, 2019 to 2034

Figure 12: Global Market Value Share (%) and BPS Analysis by Packaging Type, 2024 to 2034

Figure 13: Global Market Y-o-Y Growth (%) Projections by Packaging Type, 2024 to 2034

Figure 14: Global Market Value (US$ Million) Analysis by Material Type, 2019 to 2034

Figure 15: Global Market Volume (Units) Analysis by Material Type, 2019 to 2034

Figure 16: Global Market Value Share (%) and BPS Analysis by Material Type, 2024 to 2034

Figure 17: Global Market Y-o-Y Growth (%) Projections by Material Type, 2024 to 2034

Figure 18: Global Market Value (US$ Million) Analysis by Product Type, 2019 to 2034

Figure 19: Global Market Volume (Units) Analysis by Product Type, 2019 to 2034

Figure 20: Global Market Value Share (%) and BPS Analysis by Product Type, 2024 to 2034

Figure 21: Global Market Y-o-Y Growth (%) Projections by Product Type, 2024 to 2034

Figure 22: Global Market Value (US$ Million) Analysis by End User, 2019 to 2034

Figure 23: Global Market Volume (Units) Analysis by End User, 2019 to 2034

Figure 24: Global Market Value Share (%) and BPS Analysis by End User, 2024 to 2034

Figure 25: Global Market Y-o-Y Growth (%) Projections by End User, 2024 to 2034

Figure 26: Global Market Attractiveness by Packaging Type, 2024 to 2034

Figure 27: Global Market Attractiveness by Material Type, 2024 to 2034

Figure 28: Global Market Attractiveness by Product Type, 2024 to 2034

Figure 29: Global Market Attractiveness by End User, 2024 to 2034

Figure 30: Global Market Attractiveness by Region, 2024 to 2034

Figure 31: North America Market Value (US$ Million) by Packaging Type, 2024 to 2034

Figure 32: North America Market Value (US$ Million) by Material Type, 2024 to 2034

Figure 33: North America Market Value (US$ Million) by Product Type, 2024 to 2034

Figure 34: North America Market Value (US$ Million) by End User, 2024 to 2034

Figure 35: North America Market Value (US$ Million) by Country, 2024 to 2034

Figure 36: North America Market Value (US$ Million) Analysis by Country, 2019 to 2034

Figure 37: North America Market Volume (Units) Analysis by Country, 2019 to 2034

Figure 38: North America Market Value Share (%) and BPS Analysis by Country, 2024 to 2034

Figure 39: North America Market Y-o-Y Growth (%) Projections by Country, 2024 to 2034

Figure 40: North America Market Value (US$ Million) Analysis by Packaging Type, 2019 to 2034

Figure 41: North America Market Volume (Units) Analysis by Packaging Type, 2019 to 2034

Figure 42: North America Market Value Share (%) and BPS Analysis by Packaging Type, 2024 to 2034

Figure 43: North America Market Y-o-Y Growth (%) Projections by Packaging Type, 2024 to 2034

Figure 44: North America Market Value (US$ Million) Analysis by Material Type, 2019 to 2034

Figure 45: North America Market Volume (Units) Analysis by Material Type, 2019 to 2034

Figure 46: North America Market Value Share (%) and BPS Analysis by Material Type, 2024 to 2034

Figure 47: North America Market Y-o-Y Growth (%) Projections by Material Type, 2024 to 2034

Figure 48: North America Market Value (US$ Million) Analysis by Product Type, 2019 to 2034

Figure 49: North America Market Volume (Units) Analysis by Product Type, 2019 to 2034

Figure 50: North America Market Value Share (%) and BPS Analysis by Product Type, 2024 to 2034

Figure 51: North America Market Y-o-Y Growth (%) Projections by Product Type, 2024 to 2034

Figure 52: North America Market Value (US$ Million) Analysis by End User, 2019 to 2034

Figure 53: North America Market Volume (Units) Analysis by End User, 2019 to 2034

Figure 54: North America Market Value Share (%) and BPS Analysis by End User, 2024 to 2034

Figure 55: North America Market Y-o-Y Growth (%) Projections by End User, 2024 to 2034

Figure 56: North America Market Attractiveness by Packaging Type, 2024 to 2034

Figure 57: North America Market Attractiveness by Material Type, 2024 to 2034

Figure 58: North America Market Attractiveness by Product Type, 2024 to 2034

Figure 59: North America Market Attractiveness by End User, 2024 to 2034

Figure 60: North America Market Attractiveness by Country, 2024 to 2034

Figure 61: Latin America Market Value (US$ Million) by Packaging Type, 2024 to 2034

Figure 62: Latin America Market Value (US$ Million) by Material Type, 2024 to 2034

Figure 63: Latin America Market Value (US$ Million) by Product Type, 2024 to 2034

Figure 64: Latin America Market Value (US$ Million) by End User, 2024 to 2034

Figure 65: Latin America Market Value (US$ Million) by Country, 2024 to 2034

Figure 66: Latin America Market Value (US$ Million) Analysis by Country, 2019 to 2034

Figure 67: Latin America Market Volume (Units) Analysis by Country, 2019 to 2034

Figure 68: Latin America Market Value Share (%) and BPS Analysis by Country, 2024 to 2034

Figure 69: Latin America Market Y-o-Y Growth (%) Projections by Country, 2024 to 2034

Figure 70: Latin America Market Value (US$ Million) Analysis by Packaging Type, 2019 to 2034

Figure 71: Latin America Market Volume (Units) Analysis by Packaging Type, 2019 to 2034

Figure 72: Latin America Market Value Share (%) and BPS Analysis by Packaging Type, 2024 to 2034

Figure 73: Latin America Market Y-o-Y Growth (%) Projections by Packaging Type, 2024 to 2034

Figure 74: Latin America Market Value (US$ Million) Analysis by Material Type, 2019 to 2034

Figure 75: Latin America Market Volume (Units) Analysis by Material Type, 2019 to 2034

Figure 76: Latin America Market Value Share (%) and BPS Analysis by Material Type, 2024 to 2034

Figure 77: Latin America Market Y-o-Y Growth (%) Projections by Material Type, 2024 to 2034

Figure 78: Latin America Market Value (US$ Million) Analysis by Product Type, 2019 to 2034

Figure 79: Latin America Market Volume (Units) Analysis by Product Type, 2019 to 2034

Figure 80: Latin America Market Value Share (%) and BPS Analysis by Product Type, 2024 to 2034

Figure 81: Latin America Market Y-o-Y Growth (%) Projections by Product Type, 2024 to 2034

Figure 82: Latin America Market Value (US$ Million) Analysis by End User, 2019 to 2034

Figure 83: Latin America Market Volume (Units) Analysis by End User, 2019 to 2034

Figure 84: Latin America Market Value Share (%) and BPS Analysis by End User, 2024 to 2034

Figure 85: Latin America Market Y-o-Y Growth (%) Projections by End User, 2024 to 2034

Figure 86: Latin America Market Attractiveness by Packaging Type, 2024 to 2034

Figure 87: Latin America Market Attractiveness by Material Type, 2024 to 2034

Figure 88: Latin America Market Attractiveness by Product Type, 2024 to 2034

Figure 89: Latin America Market Attractiveness by End User, 2024 to 2034

Figure 90: Latin America Market Attractiveness by Country, 2024 to 2034

Figure 91: Western Europe Market Value (US$ Million) by Packaging Type, 2024 to 2034

Figure 92: Western Europe Market Value (US$ Million) by Material Type, 2024 to 2034

Figure 93: Western Europe Market Value (US$ Million) by Product Type, 2024 to 2034

Figure 94: Western Europe Market Value (US$ Million) by End User, 2024 to 2034

Figure 95: Western Europe Market Value (US$ Million) by Country, 2024 to 2034

Figure 96: Western Europe Market Value (US$ Million) Analysis by Country, 2019 to 2034

Figure 97: Western Europe Market Volume (Units) Analysis by Country, 2019 to 2034

Figure 98: Western Europe Market Value Share (%) and BPS Analysis by Country, 2024 to 2034

Figure 99: Western Europe Market Y-o-Y Growth (%) Projections by Country, 2024 to 2034

Figure 100: Western Europe Market Value (US$ Million) Analysis by Packaging Type, 2019 to 2034

Figure 101: Western Europe Market Volume (Units) Analysis by Packaging Type, 2019 to 2034

Figure 102: Western Europe Market Value Share (%) and BPS Analysis by Packaging Type, 2024 to 2034

Figure 103: Western Europe Market Y-o-Y Growth (%) Projections by Packaging Type, 2024 to 2034

Figure 104: Western Europe Market Value (US$ Million) Analysis by Material Type, 2019 to 2034

Figure 105: Western Europe Market Volume (Units) Analysis by Material Type, 2019 to 2034

Figure 106: Western Europe Market Value Share (%) and BPS Analysis by Material Type, 2024 to 2034

Figure 107: Western Europe Market Y-o-Y Growth (%) Projections by Material Type, 2024 to 2034

Figure 108: Western Europe Market Value (US$ Million) Analysis by Product Type, 2019 to 2034

Figure 109: Western Europe Market Volume (Units) Analysis by Product Type, 2019 to 2034

Figure 110: Western Europe Market Value Share (%) and BPS Analysis by Product Type, 2024 to 2034

Figure 111: Western Europe Market Y-o-Y Growth (%) Projections by Product Type, 2024 to 2034

Figure 112: Western Europe Market Value (US$ Million) Analysis by End User, 2019 to 2034

Figure 113: Western Europe Market Volume (Units) Analysis by End User, 2019 to 2034

Figure 114: Western Europe Market Value Share (%) and BPS Analysis by End User, 2024 to 2034

Figure 115: Western Europe Market Y-o-Y Growth (%) Projections by End User, 2024 to 2034

Figure 116: Western Europe Market Attractiveness by Packaging Type, 2024 to 2034

Figure 117: Western Europe Market Attractiveness by Material Type, 2024 to 2034

Figure 118: Western Europe Market Attractiveness by Product Type, 2024 to 2034

Figure 119: Western Europe Market Attractiveness by End User, 2024 to 2034

Figure 120: Western Europe Market Attractiveness by Country, 2024 to 2034

Figure 121: Eastern Europe Market Value (US$ Million) by Packaging Type, 2024 to 2034

Figure 122: Eastern Europe Market Value (US$ Million) by Material Type, 2024 to 2034

Figure 123: Eastern Europe Market Value (US$ Million) by Product Type, 2024 to 2034

Figure 124: Eastern Europe Market Value (US$ Million) by End User, 2024 to 2034

Figure 125: Eastern Europe Market Value (US$ Million) by Country, 2024 to 2034

Figure 126: Eastern Europe Market Value (US$ Million) Analysis by Country, 2019 to 2034

Figure 127: Eastern Europe Market Volume (Units) Analysis by Country, 2019 to 2034

Figure 128: Eastern Europe Market Value Share (%) and BPS Analysis by Country, 2024 to 2034

Figure 129: Eastern Europe Market Y-o-Y Growth (%) Projections by Country, 2024 to 2034

Figure 130: Eastern Europe Market Value (US$ Million) Analysis by Packaging Type, 2019 to 2034

Figure 131: Eastern Europe Market Volume (Units) Analysis by Packaging Type, 2019 to 2034

Figure 132: Eastern Europe Market Value Share (%) and BPS Analysis by Packaging Type, 2024 to 2034

Figure 133: Eastern Europe Market Y-o-Y Growth (%) Projections by Packaging Type, 2024 to 2034

Figure 134: Eastern Europe Market Value (US$ Million) Analysis by Material Type, 2019 to 2034

Figure 135: Eastern Europe Market Volume (Units) Analysis by Material Type, 2019 to 2034

Figure 136: Eastern Europe Market Value Share (%) and BPS Analysis by Material Type, 2024 to 2034

Figure 137: Eastern Europe Market Y-o-Y Growth (%) Projections by Material Type, 2024 to 2034

Figure 138: Eastern Europe Market Value (US$ Million) Analysis by Product Type, 2019 to 2034

Figure 139: Eastern Europe Market Volume (Units) Analysis by Product Type, 2019 to 2034

Figure 140: Eastern Europe Market Value Share (%) and BPS Analysis by Product Type, 2024 to 2034

Figure 141: Eastern Europe Market Y-o-Y Growth (%) Projections by Product Type, 2024 to 2034

Figure 142: Eastern Europe Market Value (US$ Million) Analysis by End User, 2019 to 2034

Figure 143: Eastern Europe Market Volume (Units) Analysis by End User, 2019 to 2034

Figure 144: Eastern Europe Market Value Share (%) and BPS Analysis by End User, 2024 to 2034

Figure 145: Eastern Europe Market Y-o-Y Growth (%) Projections by End User, 2024 to 2034

Figure 146: Eastern Europe Market Attractiveness by Packaging Type, 2024 to 2034

Figure 147: Eastern Europe Market Attractiveness by Material Type, 2024 to 2034

Figure 148: Eastern Europe Market Attractiveness by Product Type, 2024 to 2034

Figure 149: Eastern Europe Market Attractiveness by End User, 2024 to 2034

Figure 150: Eastern Europe Market Attractiveness by Country, 2024 to 2034

Figure 151: South Asia and Pacific Market Value (US$ Million) by Packaging Type, 2024 to 2034

Figure 152: South Asia and Pacific Market Value (US$ Million) by Material Type, 2024 to 2034

Figure 153: South Asia and Pacific Market Value (US$ Million) by Product Type, 2024 to 2034

Figure 154: South Asia and Pacific Market Value (US$ Million) by End User, 2024 to 2034

Figure 155: South Asia and Pacific Market Value (US$ Million) by Country, 2024 to 2034

Figure 156: South Asia and Pacific Market Value (US$ Million) Analysis by Country, 2019 to 2034

Figure 157: South Asia and Pacific Market Volume (Units) Analysis by Country, 2019 to 2034

Figure 158: South Asia and Pacific Market Value Share (%) and BPS Analysis by Country, 2024 to 2034

Figure 159: South Asia and Pacific Market Y-o-Y Growth (%) Projections by Country, 2024 to 2034

Figure 160: South Asia and Pacific Market Value (US$ Million) Analysis by Packaging Type, 2019 to 2034

Figure 161: South Asia and Pacific Market Volume (Units) Analysis by Packaging Type, 2019 to 2034

Figure 162: South Asia and Pacific Market Value Share (%) and BPS Analysis by Packaging Type, 2024 to 2034

Figure 163: South Asia and Pacific Market Y-o-Y Growth (%) Projections by Packaging Type, 2024 to 2034

Figure 164: South Asia and Pacific Market Value (US$ Million) Analysis by Material Type, 2019 to 2034

Figure 165: South Asia and Pacific Market Volume (Units) Analysis by Material Type, 2019 to 2034

Figure 166: South Asia and Pacific Market Value Share (%) and BPS Analysis by Material Type, 2024 to 2034

Figure 167: South Asia and Pacific Market Y-o-Y Growth (%) Projections by Material Type, 2024 to 2034

Figure 168: South Asia and Pacific Market Value (US$ Million) Analysis by Product Type, 2019 to 2034

Figure 169: South Asia and Pacific Market Volume (Units) Analysis by Product Type, 2019 to 2034

Figure 170: South Asia and Pacific Market Value Share (%) and BPS Analysis by Product Type, 2024 to 2034

Figure 171: South Asia and Pacific Market Y-o-Y Growth (%) Projections by Product Type, 2024 to 2034

Figure 172: South Asia and Pacific Market Value (US$ Million) Analysis by End User, 2019 to 2034

Figure 173: South Asia and Pacific Market Volume (Units) Analysis by End User, 2019 to 2034

Figure 174: South Asia and Pacific Market Value Share (%) and BPS Analysis by End User, 2024 to 2034

Figure 175: South Asia and Pacific Market Y-o-Y Growth (%) Projections by End User, 2024 to 2034

Figure 176: South Asia and Pacific Market Attractiveness by Packaging Type, 2024 to 2034

Figure 177: South Asia and Pacific Market Attractiveness by Material Type, 2024 to 2034

Figure 178: South Asia and Pacific Market Attractiveness by Product Type, 2024 to 2034

Figure 179: South Asia and Pacific Market Attractiveness by End User, 2024 to 2034

Figure 180: South Asia and Pacific Market Attractiveness by Country, 2024 to 2034

Figure 181: East Asia Market Value (US$ Million) by Packaging Type, 2024 to 2034

Figure 182: East Asia Market Value (US$ Million) by Material Type, 2024 to 2034

Figure 183: East Asia Market Value (US$ Million) by Product Type, 2024 to 2034

Figure 184: East Asia Market Value (US$ Million) by End User, 2024 to 2034

Figure 185: East Asia Market Value (US$ Million) by Country, 2024 to 2034

Figure 186: East Asia Market Value (US$ Million) Analysis by Country, 2019 to 2034

Figure 187: East Asia Market Volume (Units) Analysis by Country, 2019 to 2034

Figure 188: East Asia Market Value Share (%) and BPS Analysis by Country, 2024 to 2034

Figure 189: East Asia Market Y-o-Y Growth (%) Projections by Country, 2024 to 2034

Figure 190: East Asia Market Value (US$ Million) Analysis by Packaging Type, 2019 to 2034

Figure 191: East Asia Market Volume (Units) Analysis by Packaging Type, 2019 to 2034

Figure 192: East Asia Market Value Share (%) and BPS Analysis by Packaging Type, 2024 to 2034

Figure 193: East Asia Market Y-o-Y Growth (%) Projections by Packaging Type, 2024 to 2034

Figure 194: East Asia Market Value (US$ Million) Analysis by Material Type, 2019 to 2034

Figure 195: East Asia Market Volume (Units) Analysis by Material Type, 2019 to 2034

Figure 196: East Asia Market Value Share (%) and BPS Analysis by Material Type, 2024 to 2034

Figure 197: East Asia Market Y-o-Y Growth (%) Projections by Material Type, 2024 to 2034

Figure 198: East Asia Market Value (US$ Million) Analysis by Product Type, 2019 to 2034

Figure 199: East Asia Market Volume (Units) Analysis by Product Type, 2019 to 2034

Figure 200: East Asia Market Value Share (%) and BPS Analysis by Product Type, 2024 to 2034

Figure 201: East Asia Market Y-o-Y Growth (%) Projections by Product Type, 2024 to 2034

Figure 202: East Asia Market Value (US$ Million) Analysis by End User, 2019 to 2034

Figure 203: East Asia Market Volume (Units) Analysis by End User, 2019 to 2034

Figure 204: East Asia Market Value Share (%) and BPS Analysis by End User, 2024 to 2034

Figure 205: East Asia Market Y-o-Y Growth (%) Projections by End User, 2024 to 2034

Figure 206: East Asia Market Attractiveness by Packaging Type, 2024 to 2034

Figure 207: East Asia Market Attractiveness by Material Type, 2024 to 2034

Figure 208: East Asia Market Attractiveness by Product Type, 2024 to 2034

Figure 209: East Asia Market Attractiveness by End User, 2024 to 2034

Figure 210: East Asia Market Attractiveness by Country, 2024 to 2034

Figure 211: Middle East and Africa Market Value (US$ Million) by Packaging Type, 2024 to 2034

Figure 212: Middle East and Africa Market Value (US$ Million) by Material Type, 2024 to 2034

Figure 213: Middle East and Africa Market Value (US$ Million) by Product Type, 2024 to 2034

Figure 214: Middle East and Africa Market Value (US$ Million) by End User, 2024 to 2034

Figure 215: Middle East and Africa Market Value (US$ Million) by Country, 2024 to 2034

Figure 216: Middle East and Africa Market Value (US$ Million) Analysis by Country, 2019 to 2034

Figure 217: Middle East and Africa Market Volume (Units) Analysis by Country, 2019 to 2034

Figure 218: Middle East and Africa Market Value Share (%) and BPS Analysis by Country, 2024 to 2034

Figure 219: Middle East and Africa Market Y-o-Y Growth (%) Projections by Country, 2024 to 2034

Figure 220: Middle East and Africa Market Value (US$ Million) Analysis by Packaging Type, 2019 to 2034

Figure 221: Middle East and Africa Market Volume (Units) Analysis by Packaging Type, 2019 to 2034

Figure 222: Middle East and Africa Market Value Share (%) and BPS Analysis by Packaging Type, 2024 to 2034

Figure 223: Middle East and Africa Market Y-o-Y Growth (%) Projections by Packaging Type, 2024 to 2034

Figure 224: Middle East and Africa Market Value (US$ Million) Analysis by Material Type, 2019 to 2034

Figure 225: Middle East and Africa Market Volume (Units) Analysis by Material Type, 2019 to 2034

Figure 226: Middle East and Africa Market Value Share (%) and BPS Analysis by Material Type, 2024 to 2034

Figure 227: Middle East and Africa Market Y-o-Y Growth (%) Projections by Material Type, 2024 to 2034

Figure 228: Middle East and Africa Market Value (US$ Million) Analysis by Product Type, 2019 to 2034

Figure 229: Middle East and Africa Market Volume (Units) Analysis by Product Type, 2019 to 2034

Figure 230: Middle East and Africa Market Value Share (%) and BPS Analysis by Product Type, 2024 to 2034

Figure 231: Middle East and Africa Market Y-o-Y Growth (%) Projections by Product Type, 2024 to 2034

Figure 232: Middle East and Africa Market Value (US$ Million) Analysis by End User, 2019 to 2034

Figure 233: Middle East and Africa Market Volume (Units) Analysis by End User, 2019 to 2034

Figure 234: Middle East and Africa Market Value Share (%) and BPS Analysis by End User, 2024 to 2034

Figure 235: Middle East and Africa Market Y-o-Y Growth (%) Projections by End User, 2024 to 2034

Figure 236: Middle East and Africa Market Attractiveness by Packaging Type, 2024 to 2034

Figure 237: Middle East and Africa Market Attractiveness by Material Type, 2024 to 2034

Figure 238: Middle East and Africa Market Attractiveness by Product Type, 2024 to 2034

Figure 239: Middle East and Africa Market Attractiveness by End User, 2024 to 2034

Figure 240: Middle East and Africa Market Attractiveness by Country, 2024 to 2034

Recommendations

Packaging

Protective Packaging Market

Published : November 2023

Packaging

Clamshell Labelling Machines Market

Published : December 2022

Packaging

Stock Clamshell Packaging Market

Published : October 2022

Packaging

ESD Clamshell Market

Published : October 2022

Explore Packaging Insights

View Reports

Clamshell Packaging Market