Cloud Billing Market Outlook (2023 to 2033)

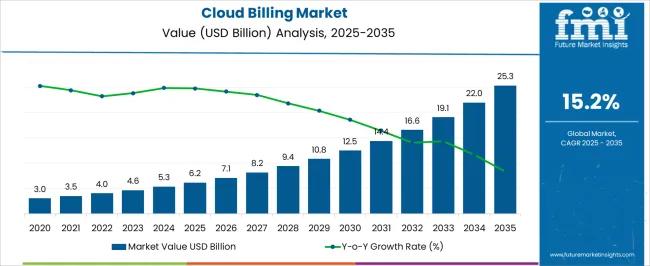
The global cloud billing market is poised to increase at a steady CAGR of 15.2%, reaching USD 19,023.6 million by 2033 from USD 4,636.7 million in 2023.

With the Growth of the Cloud Billing Market, the Cloud-optimized Billing Element may Provide a Bill-generating interface.

Cloud billing is described as a technique that assists businesses in generating invoices by enforcing specific standards. Authors frequently address functional needs such as payment methods, quotation services, and others while defining the demand for cloud billing service modules. When defining the phrase cloud billing, non-functional needs such as fault tolerance and security are included.

The emergence of the cloud billing market sales has enabled the cloud-optimized billing element to provide a bill-generating interface. Furthermore, the reference may be utilized for abstract idea currency transactions as well as real money. This, however, is largely dependent on a person's cloud computing strategy.

The future of the sales of cloud billing systems is shaped by several drivers, constraints, and opportunities. The upgrading of billing systems, accompanied by enterprises' recognition of the need to improve customer happiness, shows that the market has a promising future.

Enterprises are now abandoning their legacy systems in favor of using cloud technologies. Growing corporate demands and ever-changing client preferences have necessitated the redefinition of agility through the adaptation of effective business models. Ongoing maintenance and time consumption are the key roadblocks to the sales of cloud billing system success.

The ability to provide usage-based pricing plans, together with a lean system that records resource consumption and invoicing complications connected to cost and metering, are opening up new business prospects.

Attribute Details
Global Market Valuation in 2022 USD 4,034.1 million
Estimated Global Market Share in 2023 USD 4,636.7 million
Forecasted Global Market Size by 2033 USD 19,023.6 million
Projected Global Market Growth Rate from 2023 to 2033 15.2% CAGR

Don't pay for what you don't need

Customize your report by selecting specific countries or regions and save 30%!

What are the Key Contributors to the Cloud Billing Market Growth?

Global Cloud Billing Market Historical Analysis (2018 to 2022) Vs. Forecast Outlook (2023 to 2033)

The net valuation of the market was estimated at around USD 2,348.4 million in the year 2018. In the following years between 2018 and 2022, it registered a growth rate of 14.6% and concluded at a valuation of USD 4,034.1 million.

Enterprises all over the world are increasing their investments; hence the demand for cloud billing systems is increasing to maintain operations. Governments are introducing programs to assist companies during the epidemic, with a specific focus on small and medium-sized enterprises (SMEs).

According to Zuora's Subscription Impact Report: during this period, four out of five subscription companies continued to grow despite the economic slowdown, and 50% of subscription companies continued to grow at the same rate without suffering any negative effects from the pandemic.

Cloud Billing is Gaining Popularity Globally due to its Cost-saving and Great Business Agility Benefits for Enterprises of all Sizes.

Companies are always looking for ways to reduce their capital expenditures and operational costs. The current competitive environment and global economic crisis have pushed the use of cost-effective business model restructuring strategies. With its cost-cutting and improved business agility benefits for businesses of all sizes, emerging sales of cloud billing systems are gaining a lot of momentum throughout the world.

Organizations' demand for cloud billing is expected to improve their billing operations, improving the entire client experience. Cloud billing solutions save money for businesses since they lower the number of IT resources and infrastructure needed as well as decreasing the risk of vendor lock-in for billing activities. Because they replace human procedures, these billing solutions result in cheap capital and operational costs.

What are the Limits to the Cloud Billing Market?

One of the most critical criteria for effective corporate operations is cyber security. Data breaches and cyber-attacks have expanded dramatically in recent years, and many businesses are ignorant of the problem, leaving them exposed to data loss.

Demand for cloud billing is expected to have unsecured data and insufficient cyber security processes in place, putting them vulnerable to data loss. Customer data, product information, and income details are all processed via cloud billing solutions. This sort of data is critical for any firm, and its compromise might have a negative influence on the brand's image, market position, and business strategy. As a result, rising cyber-attacks and data thefts are projected to limit the worldwide sales of cloud billing system development.

Sudip Saha
Sudip Saha

Principal Consultant

Talk to Analyst

Find your sweet spots for generating winning opportunities in this market.

What are the Emerging Trends in the Cloud Billing Market?

BI is the process of gathering, integrating, analyzing, and presenting corporate data using a variety of technologies and methods. It gives organizations information about client behavior and products, as well as assists them in making better decisions. In the current environment, the demand for cloud billing systems for online purchasing is growing, while brick-and-mortar stores strive to obtain detailed information on their operations.

Sales of cloud billing systems are the most crucial component in revenue. By displaying inconsistencies in sales statistics and product consumption, revenue data might provide insights concerning revenue leakages. Billing and revenue data may give benefits such as quick insights into the health of a digital transformation project and the ability to make timely adjustments by examining the impact of system changes on KPIs.

Demand for cloud billing systems may help with things like consumer purchasing behavior analysis, managing complicated financial structures and parameters, and creating and implementing new pricing models, among other things. As a result, businesses are attempting to develop more BI and insights.

How are Some Challenges Stifling Cloud Billing Market Growth?

Sales of cloud billing system solutions are because of a lot of benefits, but sometimes also fluctuate due to fees and overheads. These systems' licenses are charged per user or number of clients, and many users acquire few licenses than they need to keep expenses down.

The billing system functions best when there is a significant demand for cloud billing systems, IT infrastructure, and consistent connections. Nevertheless, businesses in developing nations frequently have connectivity and IT infrastructure challenges. Because these systems manage critical company data, continuous system maintenance is required to assure high dependability. As a result, the high cost of installation, maintenance, and related operations is projected to be a concern for sales of cloud billing system companies throughout the world.

Get the data you need at a Fraction of the cost

Personalize your report by choosing insights you need
and save 40%!

Comparative View of the Adjacent Cloud Billing Market

Cloud Billing Market:

Attributes Cloud Billing Market
CAGR (2023 to 2033) 15.2%
Market Value(2026) USD 7.5 billion
Growth Factor The increasing number of cloud billing has emerged as a key driver for regional sales of the cloud billing system.
Opportunity BI collects, integrates, analyses, and presents corporate data using diverse technologies and processes.
Key Trends Cloud computing is gaining global market traction due to its cost-saving and business agility benefits for all organizations.

Catalog Management Systems Market:

Attributes Catalog Management Systems Market
CAGR (2023 to 2033) 8%
Market Value(2026) USD 1.9 billion
Growth Factor Internet and smartphone use might undoubtedly push the e-commerce catalog management systems industry.
Opportunity Catalog management software is in high demand as businesses of all types digitally adapt.
Key Trends By preserving and storing product and service information, the systems save time and labor.

Identity as a Service (IDaaS) Market:

Attributes Identity as a Service (IDaaS) Market
CAGR (2023 to 2033) 12%
Market Value(2026) USD 6.8 billion
Growth Factor Emerging-market governments use the internet and mobile technology to better serve their citizens.
Opportunity Using AI and machine learning to improve identity management opens up huge market potential.
Key Trends North American enterprises are adopting IDaaS solutions due to data breaches, employee demands, and compliance restrictions.

The sales of cloud billing systems are rising as demand for cloud billing operations, centralized and convergent billing solutions, and the need to cut capital and operational expenses grow. Some of the anticipated industry trends include subscription-based billing, pay-per-use charging, and real-time billing.

One of the most powerful factors driving demand for cloud billing tools and service adoption across regions is the expanding sales of cloud billing system enrollments. Cloud billing suppliers are projected to benefit from factors such as increased international student mobility and government efforts and financing.

As organizations modify their budgets and tastes to survive during the COVID-19 pandemic, demand for cloud billing solutions, particularly usage-based pricing, has gained popularity. Furthermore, to maintain operations, businesses all over the world are expanding in sales of cloud billing system systems.

During the projection period, North America is going to have a notable market share. For leading industries, including telecoms, IT, BFSI, and telephony, North America is predicted to be the most promising market. COVID-19 has a significant influence on North America. Because of the increased use of cost-effective technology by small and medium-sized businesses as well as key corporations, Asia Pacific area might experience significant growth in sales of cloud billing systems.

The cloud billing systems demand is driven by the factor such as high scalability. Businesses are constantly seeking for methods to reduce the amount they spend on capital and operations. The current competitive landscape and state of the world economy have led to an acceleration of the adoption of economical methods to reorganize established business models.

Cloud billing solutions save money for any firm since they lower the number of IT resources and infrastructure required as well as the danger of vendor lock-in for billing operations. The sales of cloud billing systems are predicted to develop as a result of this cost-cutting feature. Growing corporate demand for cloud billing systems and constantly changing client preferences have prompted a redefinition of agility via the adaption of effective business models.

The ability to offer usage-based pricing plans and a lean system that tracks invoicing difficulties related to cost and metering are opening up new business opportunities for sales of cloud billing system participants.

What is the Segmentation Outlook for the Cloud Billing Market?

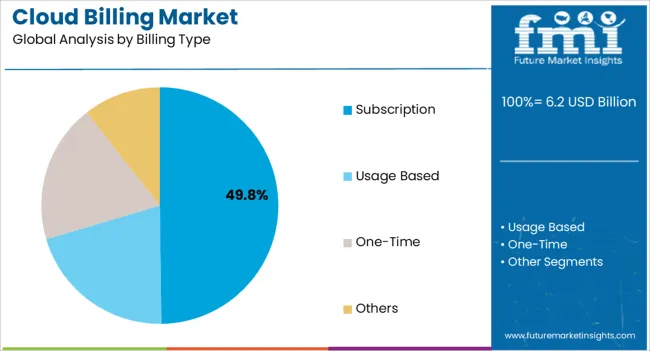
The market is segmented into by component, billing type, deployment type, service model, organization size, vertical, and region. By component, the market is further sub-segmented into solutions and services. By billing type, there are several sub-segments in which the market is expanding like subscription, usage-based, one-time, and many others. By deployment type, services provided by increasing demand for cloud billing systems are private cloud and public cloud. The market report is further segmented with more relevant data and values.

Which Segment has the Maximum Growth Potential in the Cloud Billing Market by Component?

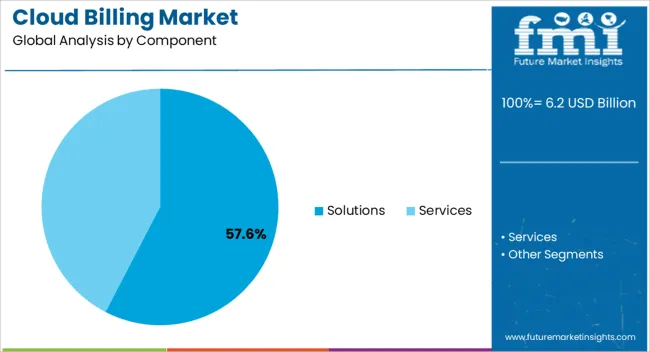
With automatic recurring billing for license- and usage-based accounts, cloud billing solutions help capture the value of the cloud services portfolio, In turn, it results in great operational efficiency with a strong CAGR expectation of 15.1%. The fundamental disadvantages of manual billing, such as time consumption and danger, are driving demand for cloud billing solutions, which give full visibility and insights into cloud services. Cloud billing solutions enable businesses to get to market quickly and generate huge revenues from their product lines.

Category By Component
Top Segment Solution
Market Share in Percentage 72.3%
Category By Billing Type
Top Segment Subscription
Market Share in Percentage 33.7%

Which is the Preferred Segment in the Cloud Billing Market by Deployment Type?

Various resources, like software, storage, virtual servers, and hardware, are made available to client organizations through the internet in the public deployment paradigm. The services provided by the public cloud model are either free or available on a subscription basis. It enables enterprises to satisfy their scalability requirements, offers a pay-per-use pricing strategy, and assures simplicity of setup.

Businesses may use public clouds to improve the efficiency of their operations; hence this segment is expected to have a strong CAGR of 15% by 2033. Customers that use the cloud lose about 45% of their money, and cloud billing solutions are intended to help them save money. Bills for public cloud service use are generated by cloud billing solutions, which also include daily, weekly, and monthly performance statistics.

What is the Regional Demand Analysis in the Cloud Billing Market?

Regional Market Comparison Global Market Share in Percentage
North America 35.2%
Europe 22.4%

North America is estimated to account for a significant market share during the projection period. For main industries, including telecoms, IT, BFSI, and telephony, North America is predicted to be the promising market.

Regional Market Comparison Global Market Share in Percentage
The United States 23.1%
Germany 8.8%
Japan 5.7%
Australia 2.1%

The manufacturing sector accounts for 15% of the United States of America’s economic production, according to the Bureau of Economic Analysis (which is run by the US Department of Commerce). Various manufacturing enterprises have ceased operations as a result of the lockout, and consequently, they are employing a few cloud services.

North America is divided into two parts such as the United States and Canada. The United States is predicted to contribute significantly to the growth of the sales of cloud billing systems in North America. Cloud billing solutions and service providers are projected to see significant growth in Canada.

Regional Markets CAGR (2023 to 2033)
The United Kingdom 17.2%
China 16.3%
India 19.1%

How Intense is the Competition in the Cloud Billing Market?

To expand their services in the market, demand for cloud billing among suppliers has used a variety of organic and inorganic development tactics such as:

  • New product releases
  • Product upgrades
  • Partnerships and agreements
  • Business expansions
  • Mergers and acquisitions

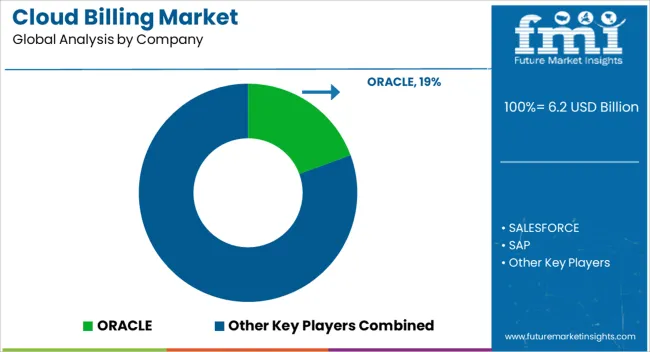
The research offers a competitive analysis of the cloud billing market's leading competitors, including company profiles, recent advancements, and important market strategies.

Recent Developments in the Cloud Billing Market:
  • SAP announced updates to SAP Subscription Billing in September 2020. Sending alerts before and after an allowance expires, adjusting allowance pricing, finishing outstanding subscriptions, and setting cancellation notice dates are among the new capabilities.
  • Zuora, in collaboration with GoCardless (United Kingdom), introduced a combined subscription payment service in August 2020. Over the past eight years, subscription revenue has grown eight times faster than sales revenue, per Zuora's Subscription Economy Index.
  • The Aria Marketplace Suite is an extension of the Aria billing and monetization platform that enables marketplace operators, both B2C and B2B, to enhance their business processes. In July 2020, it was unveiled. Aria Marketplace Suite provides marketplace owners with product and revenue management capabilities, as well as a streamlined billing and payment experience.

Key Players Operating in the Cloud Billing Market

  • ORACLE
  • SALESFORCE
  • SAP SE
  • ZUORA
  • ARIA Systems Inc.

Key Segments

By Component:

  • Solutions
  • Services

By Billing Type:

  • Subscription
  • Usage Based
  • One-Time
  • Others

By Deployment Type:

  • Private Cloud
  • Public Cloud

By Service Model:

  • IaaS
  • PaaS
  • SaaS

By Organization Size:

  • Large Enterprises
  • SMEs

By Vertical:

  • BFSI
  • IT
  • Telecommunications
  • Education
  • Consumer Goods & Retail
  • Media & Entertainment
  • Healthcare
  • Others

By Region:

  • North America
  • Europe
  • Asia Pacific
  • The Middle East and Africa (MEA)
  • Latin America

Frequently Asked Questions

How much will the Cloud Billing Market be worth in 2023?

By 2023, the industry is anticipated to generate sales of USD 4,636.7 million.

What is the anticipated Cloud Billing Market size in 2033?

By 2033, the global market is anticipated to be worth USD 19,023.6 million.

What is the market's CAGR from 2023 to 2033?

Through 2033, the market is anticipated to develop at a CAGR of 15.2%.

How did the Cloud Billing Market perform previously?

Between 2018 and 2022, the market surged at a 14.6% CAGR.

How is the market controlling the United States?

The United States market to acquire a market share of 23.1%.

What is the CAGR of China in the market?

China's market is to exhibit a CAGR of 16.3% through 2033.

Table of Content
1. Executive Summary

    1.1. Global Market Outlook

    1.2. Demand-side Trends

    1.3. Supply-side Trends

    1.4. Technology Roadmap Analysis

    1.5. Analysis and Recommendations

2. Market Overview

    2.1. Market Coverage / Taxonomy

    2.2. Market Definition / Scope / Limitations

3. Market Background

    3.1. Market Dynamics

        3.1.1. Drivers

        3.1.2. Restraints

        3.1.3. Opportunity

        3.1.4. Trends

    3.2. Scenario Forecast

        3.2.1. Demand in Optimistic Scenario

        3.2.2. Demand in Likely Scenario

        3.2.3. Demand in Conservative Scenario

    3.3. Opportunity Map Analysis

    3.4. Investment Feasibility Matrix

    3.5. PESTLE and Porter’s Analysis

    3.6. Regulatory Landscape

        3.6.1. By Key Regions

        3.6.2. By Key Countries

    3.7. Regional Parent Market Outlook

4. Global Market Analysis 2018 to 2022 and Forecast, 2023 to 2033

    4.1. Historical Market Size Value (US$ Million) Analysis, 2018 to 2022

    4.2. Current and Future Market Size Value (US$ Million) Projections, 2023 to 2033

        4.2.1. Y-o-Y Growth Trend Analysis

        4.2.2. Absolute $ Opportunity Analysis

5. Global Market Analysis 2018 to 2022 and Forecast 2023 to 2033, By Component

    5.1. Introduction / Key Findings

    5.2. Historical Market Size Value (US$ Million) Analysis By Component, 2018 to 2022

    5.3. Current and Future Market Size Value (US$ Million) Analysis and Forecast By Component, 2023 to 2033

        5.3.1. Solutions

        5.3.2. Services

    5.4. Y-o-Y Growth Trend Analysis By Component, 2018 to 2022

    5.5. Absolute $ Opportunity Analysis By Component, 2023 to 2033

6. Global Market Analysis 2018 to 2022 and Forecast 2023 to 2033, By Billing Type

    6.1. Introduction / Key Findings

    6.2. Historical Market Size Value (US$ Million) Analysis By Billing Type, 2018 to 2022

    6.3. Current and Future Market Size Value (US$ Million) Analysis and Forecast By Billing Type, 2023 to 2033

        6.3.1. Subscription

        6.3.2. Usage Based

        6.3.3. One-Time

        6.3.4. Others

    6.4. Y-o-Y Growth Trend Analysis By Billing Type, 2018 to 2022

    6.5. Absolute $ Opportunity Analysis By Billing Type, 2023 to 2033

7. Global Market Analysis 2018 to 2022 and Forecast 2023 to 2033, By Deployment Type 

    7.1. Introduction / Key Findings

    7.2. Historical Market Size Value (US$ Million) Analysis By Deployment Type , 2018 to 2022

    7.3. Current and Future Market Size Value (US$ Million) Analysis and Forecast By Deployment Type , 2023 to 2033

        7.3.1. Private Cloud

        7.3.2. Public Cloud

    7.4. Y-o-Y Growth Trend Analysis By Deployment Type , 2018 to 2022

    7.5. Absolute $ Opportunity Analysis By Deployment Type , 2023 to 2033

8. Global Market Analysis 2018 to 2022 and Forecast 2023 to 2033, By Service Model

    8.1. Introduction / Key Findings

    8.2. Historical Market Size Value (US$ Million) Analysis By Service Model, 2018 to 2022

    8.3. Current and Future Market Size Value (US$ Million) Analysis and Forecast By Service Model, 2023 to 2033

        8.3.1. IaaS

        8.3.2. PaaS

        8.3.3. SaaS

    8.4. Y-o-Y Growth Trend Analysis By Service Model, 2018 to 2022

    8.5. Absolute $ Opportunity Analysis By Service Model, 2023 to 2033

9. Global Market Analysis 2018 to 2022 and Forecast 2023 to 2033, By Organization Size

    9.1. Introduction / Key Findings

    9.2. Historical Market Size Value (US$ Million) Analysis By Organization Size, 2018 to 2022

    9.3. Current and Future Market Size Value (US$ Million) Analysis and Forecast By Organization Size, 2023 to 2033

        9.3.1. Large Enterprises

        9.3.2. SMEs

    9.4. Y-o-Y Growth Trend Analysis By Organization Size, 2018 to 2022

    9.5. Absolute $ Opportunity Analysis By Organization Size, 2023 to 2033

10. Global Market Analysis 2018 to 2022 and Forecast 2023 to 2033, By Vertical

    10.1. Introduction / Key Findings

    10.2. Historical Market Size Value (US$ Million) Analysis By Vertical, 2018 to 2022

    10.3. Current and Future Market Size Value (US$ Million) Analysis and Forecast By Vertical, 2023 to 2033

        10.3.1. BFSI

        10.3.2. IT

        10.3.3. Telecommunications

        10.3.4. Education

        10.3.5. Consumer Goods & Retail

        10.3.6. Media & Entertainment

        10.3.7. Healthcare

        10.3.8. Others

    10.4. Y-o-Y Growth Trend Analysis By Vertical, 2018 to 2022

    10.5. Absolute $ Opportunity Analysis By Vertical, 2023 to 2033

11. Global Market Analysis 2018 to 2022 and Forecast 2023 to 2033, By Region

    11.1. Introduction

    11.2. Historical Market Size Value (US$ Million) Analysis By Region, 2018 to 2022

    11.3. Current Market Size Value (US$ Million) Analysis and Forecast By Region, 2023 to 2033

        11.3.1. North America

        11.3.2. Latin America

        11.3.3. Europe

        11.3.4. South Asia

        11.3.5. East Asia

        11.3.6. Oceania

        11.3.7. MEA

    11.4. Market Attractiveness Analysis By Region

12. North America Market Analysis 2018 to 2022 and Forecast 2023 to 2033, By Country

    12.1. Historical Market Size Value (US$ Million) Trend Analysis By Market Taxonomy, 2018 to 2022

    12.2. Market Size Value (US$ Million) Forecast By Market Taxonomy, 2023 to 2033

        12.2.1. By Country

            12.2.1.1. The USA

            12.2.1.2. Canada

        12.2.2. By Component

        12.2.3. By Billing Type

        12.2.4. By Deployment Type

        12.2.5. By Service Model

        12.2.6. By Organization Size

        12.2.7. By Vertical

    12.3. Market Attractiveness Analysis

        12.3.1. By Country

        12.3.2. By Component

        12.3.3. By Billing Type

        12.3.4. By Deployment Type

        12.3.5. By Service Model

        12.3.6. By Organization Size

        12.3.7. By Vertical

    12.4. Key Takeaways

13. Latin America Market Analysis 2018 to 2022 and Forecast 2023 to 2033, By Country

    13.1. Historical Market Size Value (US$ Million) Trend Analysis By Market Taxonomy, 2018 to 2022

    13.2. Market Size Value (US$ Million) Forecast By Market Taxonomy, 2023 to 2033

        13.2.1. By Country

            13.2.1.1. Brazil

            13.2.1.2. Mexico

            13.2.1.3. Rest of Latin America

        13.2.2. By Component

        13.2.3. By Billing Type

        13.2.4. By Deployment Type

        13.2.5. By Service Model

        13.2.6. By Organization Size

        13.2.7. By Vertical

    13.3. Market Attractiveness Analysis

        13.3.1. By Country

        13.3.2. By Component

        13.3.3. By Billing Type

        13.3.4. By Deployment Type

        13.3.5. By Service Model

        13.3.6. By Organization Size

        13.3.7. By Vertical

    13.4. Key Takeaways

14. Europe Market Analysis 2018 to 2022 and Forecast 2023 to 2033, By Country

    14.1. Historical Market Size Value (US$ Million) Trend Analysis By Market Taxonomy, 2018 to 2022

    14.2. Market Size Value (US$ Million) Forecast By Market Taxonomy, 2023 to 2033

        14.2.1. By Country

            14.2.1.1. Germany

            14.2.1.2. United Kingdom

            14.2.1.3. France

            14.2.1.4. Spain

            14.2.1.5. Italy

            14.2.1.6. Rest of Europe

        14.2.2. By Component

        14.2.3. By Billing Type

        14.2.4. By Deployment Type

        14.2.5. By Service Model

        14.2.6. By Organization Size

        14.2.7. By Vertical

    14.3. Market Attractiveness Analysis

        14.3.1. By Country

        14.3.2. By Component

        14.3.3. By Billing Type

        14.3.4. By Deployment Type

        14.3.5. By Service Model

        14.3.6. By Organization Size

        14.3.7. By Vertical

    14.4. Key Takeaways

15. South Asia Market Analysis 2018 to 2022 and Forecast 2023 to 2033, By Country

    15.1. Historical Market Size Value (US$ Million) Trend Analysis By Market Taxonomy, 2018 to 2022

    15.2. Market Size Value (US$ Million) Forecast By Market Taxonomy, 2023 to 2033

        15.2.1. By Country

            15.2.1.1. India

            15.2.1.2. Malaysia

            15.2.1.3. Singapore

            15.2.1.4. Thailand

            15.2.1.5. Rest of South Asia

        15.2.2. By Component

        15.2.3. By Billing Type

        15.2.4. By Deployment Type

        15.2.5. By Service Model

        15.2.6. By Organization Size

        15.2.7. By Vertical

    15.3. Market Attractiveness Analysis

        15.3.1. By Country

        15.3.2. By Component

        15.3.3. By Billing Type

        15.3.4. By Deployment Type

        15.3.5. By Service Model

        15.3.6. By Organization Size

        15.3.7. By Vertical

    15.4. Key Takeaways

16. East Asia Market Analysis 2018 to 2022 and Forecast 2023 to 2033, By Country

    16.1. Historical Market Size Value (US$ Million) Trend Analysis By Market Taxonomy, 2018 to 2022

    16.2. Market Size Value (US$ Million) Forecast By Market Taxonomy, 2023 to 2033

        16.2.1. By Country

            16.2.1.1. China

            16.2.1.2. Japan

            16.2.1.3. South Korea

        16.2.2. By Component

        16.2.3. By Billing Type

        16.2.4. By Deployment Type

        16.2.5. By Service Model

        16.2.6. By Organization Size

        16.2.7. By Vertical

    16.3. Market Attractiveness Analysis

        16.3.1. By Country

        16.3.2. By Component

        16.3.3. By Billing Type

        16.3.4. By Deployment Type

        16.3.5. By Service Model

        16.3.6. By Organization Size

        16.3.7. By Vertical

    16.4. Key Takeaways

17. Oceania Market Analysis 2018 to 2022 and Forecast 2023 to 2033, By Country

    17.1. Historical Market Size Value (US$ Million) Trend Analysis By Market Taxonomy, 2018 to 2022

    17.2. Market Size Value (US$ Million) Forecast By Market Taxonomy, 2023 to 2033

        17.2.1. By Country

            17.2.1.1. Australia

            17.2.1.2. New Zealand

        17.2.2. By Component

        17.2.3. By Billing Type

        17.2.4. By Deployment Type

        17.2.5. By Service Model

        17.2.6. By Organization Size

        17.2.7. By Vertical

    17.3. Market Attractiveness Analysis

        17.3.1. By Country

        17.3.2. By Component

        17.3.3. By Billing Type

        17.3.4. By Deployment Type

        17.3.5. By Service Model

        17.3.6. By Organization Size

        17.3.7. By Vertical

    17.4. Key Takeaways

18. MEA Market Analysis 2018 to 2022 and Forecast 2023 to 2033, By Country

    18.1. Historical Market Size Value (US$ Million) Trend Analysis By Market Taxonomy, 2018 to 2022

    18.2. Market Size Value (US$ Million) Forecast By Market Taxonomy, 2023 to 2033

        18.2.1. By Country

            18.2.1.1. GCC Countries

            18.2.1.2. South Africa

            18.2.1.3. Israel

            18.2.1.4. Rest of MEA

        18.2.2. By Component

        18.2.3. By Billing Type

        18.2.4. By Deployment Type

        18.2.5. By Service Model

        18.2.6. By Organization Size

        18.2.7. By Vertical

    18.3. Market Attractiveness Analysis

        18.3.1. By Country

        18.3.2. By Component

        18.3.3. By Billing Type

        18.3.4. By Deployment Type

        18.3.5. By Service Model

        18.3.6. By Organization Size

        18.3.7. By Vertical

    18.4. Key Takeaways

19. Key Countries Market Analysis

    19.1. USA

        19.1.1. Pricing Analysis

        19.1.2. Market Share Analysis, 2022

            19.1.2.1. By Component

            19.1.2.2. By Billing Type

            19.1.2.3. By Deployment Type

            19.1.2.4. By Service Model

            19.1.2.5. By Organization Size

            19.1.2.6. By Vertical

    19.2. Canada

        19.2.1. Pricing Analysis

        19.2.2. Market Share Analysis, 2022

            19.2.2.1. By Component

            19.2.2.2. By Billing Type

            19.2.2.3. By Deployment Type

            19.2.2.4. By Service Model

            19.2.2.5. By Organization Size

            19.2.2.6. By Vertical

    19.3. Brazil

        19.3.1. Pricing Analysis

        19.3.2. Market Share Analysis, 2022

            19.3.2.1. By Component

            19.3.2.2. By Billing Type

            19.3.2.3. By Deployment Type

            19.3.2.4. By Service Model

            19.3.2.5. By Organization Size

            19.3.2.6. By Vertical

    19.4. Mexico

        19.4.1. Pricing Analysis

        19.4.2. Market Share Analysis, 2022

            19.4.2.1. By Component

            19.4.2.2. By Billing Type

            19.4.2.3. By Deployment Type

            19.4.2.4. By Service Model

            19.4.2.5. By Organization Size

            19.4.2.6. By Vertical

    19.5. Germany

        19.5.1. Pricing Analysis

        19.5.2. Market Share Analysis, 2022

            19.5.2.1. By Component

            19.5.2.2. By Billing Type

            19.5.2.3. By Deployment Type

            19.5.2.4. By Service Model

            19.5.2.5. By Organization Size

            19.5.2.6. By Vertical

    19.6. United Kingdom

        19.6.1. Pricing Analysis

        19.6.2. Market Share Analysis, 2022

            19.6.2.1. By Component

            19.6.2.2. By Billing Type

            19.6.2.3. By Deployment Type

            19.6.2.4. By Service Model

            19.6.2.5. By Organization Size

            19.6.2.6. By Vertical

    19.7. France

        19.7.1. Pricing Analysis

        19.7.2. Market Share Analysis, 2022

            19.7.2.1. By Component

            19.7.2.2. By Billing Type

            19.7.2.3. By Deployment Type

            19.7.2.4. By Service Model

            19.7.2.5. By Organization Size

            19.7.2.6. By Vertical

    19.8. Spain

        19.8.1. Pricing Analysis

        19.8.2. Market Share Analysis, 2022

            19.8.2.1. By Component

            19.8.2.2. By Billing Type

            19.8.2.3. By Deployment Type

            19.8.2.4. By Service Model

            19.8.2.5. By Organization Size

            19.8.2.6. By Vertical

    19.9. Italy

        19.9.1. Pricing Analysis

        19.9.2. Market Share Analysis, 2022

            19.9.2.1. By Component

            19.9.2.2. By Billing Type

            19.9.2.3. By Deployment Type

            19.9.2.4. By Service Model

            19.9.2.5. By Organization Size

            19.9.2.6. By Vertical

    19.10. India

        19.10.1. Pricing Analysis

        19.10.2. Market Share Analysis, 2022

            19.10.2.1. By Component

            19.10.2.2. By Billing Type

            19.10.2.3. By Deployment Type

            19.10.2.4. By Service Model

            19.10.2.5. By Organization Size

            19.10.2.6. By Vertical

    19.11. Malaysia

        19.11.1. Pricing Analysis

        19.11.2. Market Share Analysis, 2022

            19.11.2.1. By Component

            19.11.2.2. By Billing Type

            19.11.2.3. By Deployment Type

            19.11.2.4. By Service Model

            19.11.2.5. By Organization Size

            19.11.2.6. By Vertical

    19.12. Singapore

        19.12.1. Pricing Analysis

        19.12.2. Market Share Analysis, 2022

            19.12.2.1. By Component

            19.12.2.2. By Billing Type

            19.12.2.3. By Deployment Type

            19.12.2.4. By Service Model

            19.12.2.5. By Organization Size

            19.12.2.6. By Vertical

    19.13. Thailand

        19.13.1. Pricing Analysis

        19.13.2. Market Share Analysis, 2022

            19.13.2.1. By Component

            19.13.2.2. By Billing Type

            19.13.2.3. By Deployment Type

            19.13.2.4. By Service Model

            19.13.2.5. By Organization Size

            19.13.2.6. By Vertical

    19.14. China

        19.14.1. Pricing Analysis

        19.14.2. Market Share Analysis, 2022

            19.14.2.1. By Component

            19.14.2.2. By Billing Type

            19.14.2.3. By Deployment Type

            19.14.2.4. By Service Model

            19.14.2.5. By Organization Size

            19.14.2.6. By Vertical

    19.15. Japan

        19.15.1. Pricing Analysis

        19.15.2. Market Share Analysis, 2022

            19.15.2.1. By Component

            19.15.2.2. By Billing Type

            19.15.2.3. By Deployment Type

            19.15.2.4. By Service Model

            19.15.2.5. By Organization Size

            19.15.2.6. By Vertical

    19.16. South Korea

        19.16.1. Pricing Analysis

        19.16.2. Market Share Analysis, 2022

            19.16.2.1. By Component

            19.16.2.2. By Billing Type

            19.16.2.3. By Deployment Type

            19.16.2.4. By Service Model

            19.16.2.5. By Organization Size

            19.16.2.6. By Vertical

    19.17. Australia

        19.17.1. Pricing Analysis

        19.17.2. Market Share Analysis, 2022

            19.17.2.1. By Component

            19.17.2.2. By Billing Type

            19.17.2.3. By Deployment Type

            19.17.2.4. By Service Model

            19.17.2.5. By Organization Size

            19.17.2.6. By Vertical

    19.18. New Zealand

        19.18.1. Pricing Analysis

        19.18.2. Market Share Analysis, 2022

            19.18.2.1. By Component

            19.18.2.2. By Billing Type

            19.18.2.3. By Deployment Type

            19.18.2.4. By Service Model

            19.18.2.5. By Organization Size

            19.18.2.6. By Vertical

    19.19. GCC Countries

        19.19.1. Pricing Analysis

        19.19.2. Market Share Analysis, 2022

            19.19.2.1. By Component

            19.19.2.2. By Billing Type

            19.19.2.3. By Deployment Type

            19.19.2.4. By Service Model

            19.19.2.5. By Organization Size

            19.19.2.6. By Vertical

    19.20. South Africa

        19.20.1. Pricing Analysis

        19.20.2. Market Share Analysis, 2022

            19.20.2.1. By Component

            19.20.2.2. By Billing Type

            19.20.2.3. By Deployment Type

            19.20.2.4. By Service Model

            19.20.2.5. By Organization Size

            19.20.2.6. By Vertical

    19.21. Israel

        19.21.1. Pricing Analysis

        19.21.2. Market Share Analysis, 2022

            19.21.2.1. By Component

            19.21.2.2. By Billing Type

            19.21.2.3. By Deployment Type

            19.21.2.4. By Service Model

            19.21.2.5. By Organization Size

            19.21.2.6. By Vertical

20. Market Structure Analysis

    20.1. Competition Dashboard

    20.2. Competition Benchmarking

    20.3. Market Share Analysis of Top Players

        20.3.1. By Regional

        20.3.2. By Component

        20.3.3. By Billing Type

        20.3.4. By Deployment Type

        20.3.5. By Service Model

        20.3.6. By Organization Size

        20.3.7. By Vertical

21. Competition Analysis

    21.1. Competition Deep Dive

        21.1.1. ORACLE

            21.1.1.1. Overview

            21.1.1.2. Product Portfolio

            21.1.1.3. Profitability by Market Segments

            21.1.1.4. Sales Footprint

            21.1.1.5. Strategy Overview

                21.1.1.5.1. Marketing Strategy

        21.1.2. SALESFORCE

            21.1.2.1. Overview

            21.1.2.2. Product Portfolio

            21.1.2.3. Profitability by Market Segments

            21.1.2.4. Sales Footprint

            21.1.2.5. Strategy Overview

                21.1.2.5.1. Marketing Strategy

        21.1.3. SAP

            21.1.3.1. Overview

            21.1.3.2. Product Portfolio

            21.1.3.3. Profitability by Market Segments

            21.1.3.4. Sales Footprint

            21.1.3.5. Strategy Overview

                21.1.3.5.1. Marketing Strategy

        21.1.4. ZUORA

            21.1.4.1. Overview

            21.1.4.2. Product Portfolio

            21.1.4.3. Profitability by Market Segments

            21.1.4.4. Sales Footprint

            21.1.4.5. Strategy Overview

                21.1.4.5.1. Marketing Strategy

        21.1.5. ARIA SYSTEMS

            21.1.5.1. Overview

            21.1.5.2. Product Portfolio

            21.1.5.3. Profitability by Market Segments

            21.1.5.4. Sales Footprint

            21.1.5.5. Strategy Overview

                21.1.5.5.1. Marketing Strategy

        21.1.6. Amazon Web Services (AWS)

            21.1.6.1. Overview

            21.1.6.2. Product Portfolio

            21.1.6.3. Profitability by Market Segments

            21.1.6.4. Sales Footprint

            21.1.6.5. Strategy Overview

                21.1.6.5.1. Marketing Strategy

        21.1.7. Google Cloud Platform (GCP)

            21.1.7.1. Overview

            21.1.7.2. Product Portfolio

            21.1.7.3. Profitability by Market Segments

            21.1.7.4. Sales Footprint

            21.1.7.5. Strategy Overview

                21.1.7.5.1. Marketing Strategy

        21.1.8. Microsoft Azure

            21.1.8.1. Overview

            21.1.8.2. Product Portfolio

            21.1.8.3. Profitability by Market Segments

            21.1.8.4. Sales Footprint

            21.1.8.5. Strategy Overview

                21.1.8.5.1. Marketing Strategy

        21.1.9. IBM Corporation

            21.1.9.1. Overview

            21.1.9.2. Product Portfolio

            21.1.9.3. Profitability by Market Segments

            21.1.9.4. Sales Footprint

            21.1.9.5. Strategy Overview

                21.1.9.5.1. Marketing Strategy

        21.1.10. Aria Systems

            21.1.10.1. Overview

            21.1.10.2. Product Portfolio

            21.1.10.3. Profitability by Market Segments

            21.1.10.4. Sales Footprint

            21.1.10.5. Strategy Overview

                21.1.10.5.1. Marketing Strategy

22. Assumptions & Acronyms Used

23. Research Methodology
Recommendations

Technology

R & D Cloud Collaboration Market

September 2024

REP-GB-1956

Upcoming

Technology

Cloud Authentication Market

November 2022

REP-GB-15817

340 pages

Explore Technology Insights

View Reports