Coagulation Analysers Market
Find Out How Rising Prevalence Of Blood Disorders Is Influencing The Sales of Coagulation Analyzers!
Coagulation Analysers Market by Product, End User & Region - Forecast for 2022 – 2032
Coagulation Analysers Market Outlook 2022-2032
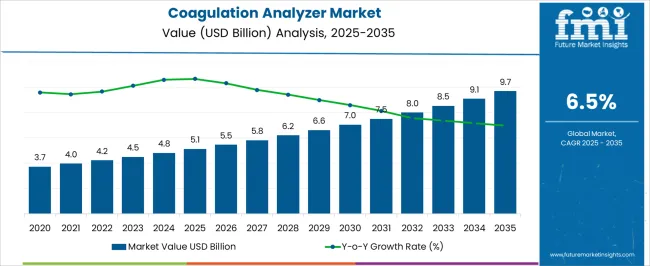
[276 Pages Report] The global coagulation analysers market is expected to enjoy a valuation of US$ 1.1 Bn in 2022, and further expand at a CAGR of 6.8% between 2022 and 2032 to reach a valuation of ~US$ 2.1 Bn by 2032. Rising adoption across hospitals and clinical laboratories is a key factor driving demand for coagulation analyzers in the global market.
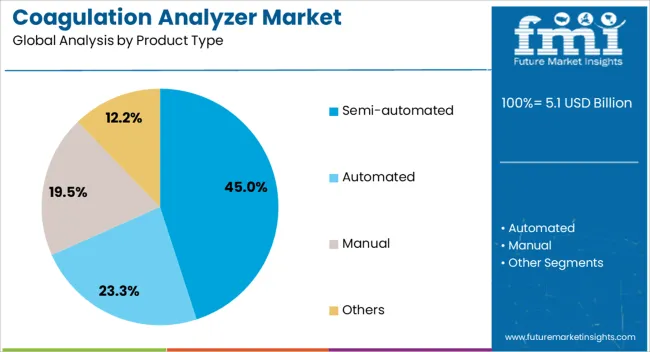
Based on product, the standalone analysers segment is estimated to lead the global coagulation analyzers market with a share of about 56.2% in 2022. This can be attributed to the rising end user preference for standalone analyzers over other product types.
Attribute |
Key Statistics |
Coagulation Analyzers Market Base Value (2021) |
US$ 1.0 Bn |
Estimated Market Value (2022) |
US$ 1.1 Bn |
Projected Market Value (2032) |
US$ 2.1 Bn |
Value-based CAGR (2022-2032) |
6.8% |
Market Share of Top 5 Countries |
57.3% |
Coagulation is the process by which blood converts from liquid state into a solid form leading to the formation of a clot indicating haemostasis. This is the stoppage of bleeding from a damaged vessel accompanied by repair. Coagulation involves adaptive immune responses, adhesion, and aggregation of blood components i.e. platelets, as well as fibrin deposition and maturation.
A coagulation analyzer is a machine that tests blood samples for the individual's blood clotting characteristics. One of the most significant qualities is blood clotting. When a person is injured, the clotting process starts to stop the blood flow by turning it into a gel. It can be exceedingly dangerous if there is an excessive or insufficient amount of clotting.
Coagulation analysers measure and evaluate the speed of clot formation or coagulation. They help to avoid the chances of heart attack, embolism, and thrombosis by detecting the presence of blood clots in blood vessels.
Rising usage of coagulation analysers for measuring coagulation factors and detecting/diagnosing diseases of bleeding and thrombus will therefore continue to boost the market during the forecast period.
The market value for coagulation analysers was approximately 2.8% of the overall ~US$ 37.0 Bn global point of care testing market in 2021.
Let us know your requirement to get
100% FREE customization
Sales Analysis of Coagulation Analysers from 2012 to 2021 Vs Market Outlook for 2022 to 2032
The global sales of coagulation analysers are projected to grow at a healthy CAGR of 6.8% during the forecast period from 2022 to 2032. Rising prevalence of blood disorders and cardiovascular diseases and increasing usage of coagulation analyzers across various end user sectors are driving growth in the global market.
Coagulation analysers are becoming increasingly popular because of major improvements in technology and expanding healthcare industry requirements. Adoption rate of clinical chemistry analysers has expanded at a rapid pace during the last few decades and the trend is likely to continue during the forecast period. This will support the growth of coagulation analysers market.
Clinical chemistry is largely concerned with the examination of internal body fluids and provides accurate diagnostic information. Traditional laboratory tests have provided a solid foundation for standard medicine biochemistry. However, as technological advancements have grown, analysis techniques have advanced, and a series of tests can now be performed in automated laboratories utilising complex devices such as chemical analysers.
The demand for the coagulation analysers market will boost in the future as new government initiatives and development of quality of life programs are being introduced. For instance, the U.S. Department of Health and Human Services 2021, states that millions of Americans carry genes that can contribute to blood abnormalities such as sickle cell disease and haemophilia. As a result, programs like Healthy Individuals 2030 are being launched to improve the health and quality of life of people with blood diseases.
Sickle cell disease is a blood ailment that impacts more than 100,000 Americans. Interventions such as initiatives to boost hydroxyurea use can improve sickle cell disease patients' health outcomes, and blood transfusions can assist avoid and treat problems.Haemophilia is a chronic bleeding disorder primarily affecting men. Interventions that promote preventive therapy can help patients with haemophilia reduce joint damage and impairment.
In addition, increasing prevalence of blood disorders is expected to play a key role in augmenting the growth of coagulation analysers market during the forecast period. According to the Center for Disease Prevention and Control 2020, each year 1 in 5000 male births are affected with Haemophilia A. Similarly, the World Federation of Haemophilia (WHF) in their annual global survey 2021 stated that a total number of 347,026 patients were identified in 2020 suffering from haemophilic disorders.
What are the Key Trends Driving the Global Coagulation Analysers Market?
“Rising Government Initiatives and Advancements in Analyser Technology to Boost Growth of the Market Over the Projected Period”
The global coagulation analyzers market is expected to grow at a robust pace during the next ten years, owing to initiatives by governments in emerging countries that are engaging significantly in healthcare infrastructure development, which is expected to broaden access to healthcare services.
The frequency of coagulation screening tests ordered in recent years has skyrocketed. As a result, the effectiveness and efficacy of automated coagulation analysers have increased, allowing the development of high-throughput, accuracy rate, and exact analysers with limited human measurement error.
The first coagulation analysers were manually operated, with a hook used to identify a thrombus in the cuvette. This is currently superseded by the simultaneous detection of clotting components using colorimetric,clotting,and immunological principles.
Current technologies include flow cytometers, automated platelet function analysers,microarrays and polymerase chain reaction (PCR) have gained immense popularity. Combinations of all of these technologies reduce pre- and post-analytical handling, resulting in greater accuracy and productivity.
Thus, advancements in coagulation analysers will further create growth opportunities for manufacturers during the forecast period.
Find your sweet spots for generating winning opportunities in this market.
Talk to AnalystWhat are the Factors Restraining Growth of the Coagulation Analysers Market?
The high cost, regulatory challenges, lack of skilled workforce and low awareness levels regarding early detection of blood disorders in the field can hamper the growth of the coagulation analysers market during the forecast period.
Lack of awareness about prompt blood clot detection, as well as a scarcity of qualified coagulation analyzer operators, will also limit growth in the approaching years.
A huge section of the population in underdeveloped countries is still misinformed about the importance of frequent check-ups. Many people in developing countries lack access to adequate healthcare. During the projected period, such considerations may become obstacles to the growth of the coagulation analysers market.
Country-wise Insights
What Makes the U.S. a Dominant Coagulation Analysers Market?
“Rising Prevalence of Leukaemia Driving Market in the U.S.”
The U.S. will continue to dominate the North America coagulation analysers market with a total market share of about 90.1% in 2022. Growth in the U.S. coagulation analysers market is driven by rising incidence of blood disorders, availability of advanced medical technologies, and heavy presence of leading market players.
According to The Leukaemia & Lymphoma Society (LLS) 2021, one individual in the United States is diagnosed with leukaemia, lymphoma, or myeloma every three minutes. Furthermore, around 186,400 people were diagnosed with leukaemia, lymphoma, or myeloma in 2021 in the country and this number is likely to further surge during the coming years. This in turn will continue to push the demand for coagulation analysers in the U.S. market during the next ten years.
What Makes China a Highly Lucrative Coagulation Analysers Market?
“Introduction of Advanced Coagulation Analysers Boosting Market in China”
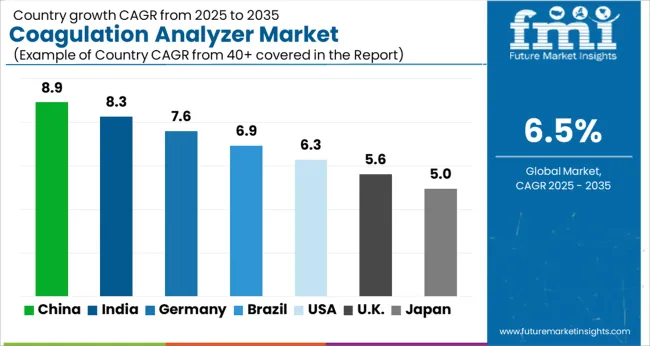
As per FMI, China held approximately 4.7% share in the global coagulation analysers market in 2021 and it is projected to grow at the highest CAGR of 7.1% during the forecast period.
Rapid expansion of healthcare industry, increasing incidence of blood disorders, and growing adoption of advanced coagulation analysers across hospitals and clinical laboratories are driving the market in China.
Similarly, advancements in analyser technology and continuous introduction of new products by leading market players are expected to boost China’s coagulation analysers market during the assessment period.
Leading players based in China are continuously focused on developing products with greater efficiency. For instance, recently The Roche Cobast 711, a new automatic blood coagulation analyzer was introduced in China. The analyzer has a sample capacity of 225 and can do up to 390 tests per hour, as well as automatic verification of sample tube pressure and quality to detect the presence of interfering chemicals such as cell-free haemoglobin, bilirubin, and lipids.
The new devices can significantly improve detection speed and enable end users to improve their productivity. Availability of such products will further expand the coagulation analysers market size in China during the assessment period.
What is the Demand Outlook for Germany Coagulation Analysers Market?
“Flourishing Medical Tourism Boosting Sales in Germany”
The coagulation analysers market in Germany is set to exhibit a CAGR of nearly 4.4% during the forecast period. Growth in the market is driven by rising cases of thalassemia, increasing adoption of advanced medical technologies, and increasing diagnostic screening rates in the country.
Similarly, increasing medical tourism and rapid expansion of clinical laboratories are expected to generate demand for coagulation analysers across the country during the next decade.

A unified Market Research Subscription Platform, built for today's disparate research needs.
Category-wise Insights
Which is the Most Popular Product in Coagulation Analyzers Market?
“Standalone Coagulation Analyzers Will Remain Highly Sought After Products”
As per FMI, the standalone coagulation analysers segment is expected to grow at a CAGR of 6.3% during the forecast period, accounting for the largest market share of about 56.2% by the end of 2022. This can be attributed to the rising end user preference for these efficient and cost effective products.
Similary, various benefits of standalone coagulation analyzers including easy accessibility at bedside in the hospitals and increased adoption of analysers in emergency cases in the operating rooms will further accelerate the growth of this segment during the forecast period.
Which is the Leading End User of Coagulation Analysers Globally?
“Most of the Coagulation Analyzer Sales to Remain Concentrated in Clinical Laboratories”
Based on end users, clinical laboratories segment will hold the highest market share value of 59.9% in 2022 and further expand at a robust pace during the forecast period. Rising inpatient admissions, increasing surgical procedures, and the fact of routine examinations carried out prior to any procedures are propelling growth of this segment.
Competitive Landscape
With several competitors in the coagulation analyser’s production sphere, the overall market is fragmented. To meet consumer demand and expand their customer base, leading companies are adopting strategies such as mergers and acquisitions, partnerships and collaborations, and new product launches.
Instances of key developmental strategies by the industry players in the coagulation analysers market are given below:
- In June 2021, Trivitron Healthcare announced the release of two new product innovations for HbA1c and Hb variant detection. The NANO H5 and NANO H110 are high performance liquid chromatography analysers for HbA1c detection in less than 3 minutes. These HbA1c analysers based on HPLC will be utilised to monitor diabetes, thalassemia, and haemoglobin variations.
- In February 2021, Siemens Healthineers and Sysmex Corporation announced the renewal of their long-standing global distributorship,supply,service agreement, and sales,for a comprehensive portfolio of blood clotting products including a multi-year extension. The businesses' agreement also includes Siemens Healthineers' future distribution of Sysmex's CN-Series automated blood coagulation analysers, the CN-3000 and CN-6000, providing the next generation of completely automated solutions for mid- and high-volume coagulation testing to laboratories.
- In October 2021, Trivitron Healthcare in collaboration with Diagon launched a new line of coagulation analyzer products for the Indian market.
Report Scope as per Coagulation Analysers Industry Analysis
Attribute |
Details |
Estimated Market Size (2022) |
US$ 1.1 Bn |
Projected Market Size (2032) |
US$ 2.1 Bn |
Anticipated Growth Rate (2022-2032) |
6.8% |
Forecast Period |
2012-2021 |
Historical Data Available for |
2022-2032 |
Market Analysis |
US$ Mn for Value |
Key Regions Covered |
North America, Latin America, Europe, South Asia, East Asia, Oceania, and Middle East & Africa |
Key Countries Covered |
U.S., Canada, Brazil, Mexico, Argentina, U.K., Germany, Italy, Russia, Spain, France, BENELUX, Nordic Countries, India, Thailand, Indonesia, Malaysia, Japan, China, South Korea, Australia, New Zealand, Turkey, GCC, South Africa and North Africa |
Key Market Segments Covered |
Product, End User, and Region |
Key Companies Profiled |
|
Key Market Segments Covered in Coagulation Analysers Industry Research
By Product:
- Standalone Analyzers
- Table Top Analyzers
- Portable Analyzers
By End User:
- Hospitals
- Clinical Laboratories
- Others
By Region:
- North America
- Latin America
- Europe
- South Asia
- East Asia
- Oceania
- Middle East and Africa (MEA)
Frequently Asked Questions
The global coagulation analysers market was valued at US$ 1.0 Bn in 2021 and is set to touch a valuation of US$ 1.1 Bn by 2022.
The coagulation analysers market is expected to reach US$ 2.1 Bn by the end of 2032, with sales revenue expected to grow at 6.2% CAGR throughout the forecast period.
Advances in hemostasis-coagulation analyzer technology, rising prevalence of lifestyle-related diseases, and increasing initiatives by government bodies are some of the key trends shaping growth in this market.
The U.S., China, Germany, Japan, and the U.K. are driving demand for coagulation analysers.
The U.S. is expected to account for about 90.1% of the North American coagulation analysers market in 2022.
Demand for coagulation analysers in Europe is expected to rise at 6.9% CAGR over the next ten years.
The coagulation analysers market in Latin America is expected to grow at 6.6% CAGR during the forecast period.
The overall coagulation analyzers market in MEA is likely to expand at a CAGR of 6.0% over the next ten years
The U.S., China, and Japan are the key producers of coagulation analysers.
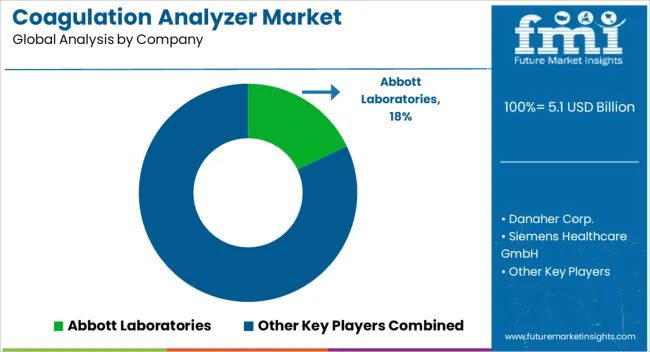
Abbott Laboratories, Danaher, Siemens Healthineers Group, Sysmex Group, Thermo Fisher Scientific, Horiba, Nihon Kohden, Roche Diagnostics, Maccura Biotechnology Co. Ltd, Bio Group Medical System, Genrui Biotech Inc., A&T Corporation, Beijing Succeeder Technology Inc., Diagnostica Stago SAS, Helena Laboratories, Hycel, Eurolyser, Bpc Biosed Srl, Robimes India Pvt. Ltd., Meril Life Sciences, ERBA Diagnostics, Inc., Sclavo Diagnostics International S.r.l, Haematonics, Biosystems S.A., and ACON are
Table of Content
1. Executive Summary
1.1. Global Market Outlook
1.2. Demand Side Trends
1.3. Supply Side Trends
1.4. Technology Roadmap
1.5. Analysis and Recommendations
2. Market Overview
2.1. Market Coverage / Taxonomy
2.2. Market Definition / Scope / Limitations
2.3. Inclusions and Exclusions
3. Key Market Trends
3.1. Key Trends Impacting the Market
3.2. Product Innovation / Development Trends
4. Key Success Factors
4.1. Disease Epidemiology
4.2. Regulatory Scenario
4.3. Reimbursement Landscape
4.4. PESTEL analysis
4.5. Porter’s analysis
5. Market Background
5.1. Macro-Economic Factors
5.1.1. Global GDP Growth Outlook
5.1.2. Global Healthcare GDP Growth Overview
5.2. Forecast Factors - Relevance & Impact
5.2.1. Rising prevalence of blood disorders.
5.2.2. Increasing Awareness and Adoption of in Healthcare Settings.
5.2.3. New Product Launches
5.2.4. Advancing medical technology and developments of Coagulation Analysers.
5.3. Market Dynamics
5.3.1. Drivers
5.3.2. Restraints
5.3.3. Opportunity Analysis
6. COVID-19 Crisis – Crisis Analysis
6.1. COVID-19 and Impact Analysis
6.1.1. By Product
6.1.2. By End User
6.1.3. By Region
6.2. 2021 Market Scenario
7. Global Market Volume (Units) Analysis 2012-2021 and Forecast, 2022–2032
7.1. Historical Market Volume (Units) Analysis, 2012-2021
7.2. Current and Future Market Volume (Units) Projections, 2022–2032
7.2.1. Y-o-Y Growth Trend Analysis
8. Global Market - Pricing Analysis
8.1. Regional Pricing Analysis By Product
8.2. Pricing Break-up
8.2.1. Manufacturer Level Pricing
8.2.2. Distributor Level Pricing
8.3. Global Average Pricing Analysis Benchmark
8.4. Pricing Assumptions
9. Global Market Demand (in Value or Size in US$ Mn) Analysis 2012-2021 and Forecast, 2022–2032
9.1. Historical Market Value (US$ Mn) Analysis, 2012-2021
9.2. Current and Future Market Value (US$ Mn) Projections, 2022–2032
9.2.1. Y-o-Y Growth Trend Analysis
9.2.2. Absolute $ Opportunity Analysis
10. Global Market Analysis 2012-2021 and Forecast 2022–2032, by Product
10.1. Introduction / Key Findings
10.2. Historical Market Size (US$ Mn) and Volume (Units) Analysis By Product , 2012-2021
10.3. Current and Future Market Size (US$ Mn) and Volume (Units) Analysis and Forecast By Product , 2022–2032
10.3.1. Standalone Analysers
10.3.2. Table Top Analysers
10.3.3. Portable Analysers
10.4. Market Attractiveness Analysis By Product
11. Global Market Analysis 2012-2021 and Forecast 2022–2032, by End User
11.1. Introduction / Key Findings
11.2. Historical Market Size (US$ Mn) Analysis, By End User, 2012-2021
11.3. Current and Future Market Size (US$ Mn) Analysis and Forecast By End User, 2022–2032
11.3.1. Hospitals
11.3.2. Clinical Laboratories
11.3.3. Others
11.4. Market Attractiveness Analysis By End User
12. Global Market Analysis 2012-2021 and Forecast 2022–2032, by Region
12.1. Introduction
12.2. Historical Market Size (US$ Mn) and Volume (Units) Analysis By Region, 2012-2021
12.3. Current Market and Future Market Size (US$ Mn) and Volume (Units) Analysis and Forecast By Region, 2022–2032
12.3.1. North America
12.3.2. Latin America
12.3.3. Europe
12.3.4. East Asia
12.3.5. South Asia
12.3.6. Oceania
12.3.7. Middle East and Africa (MEA)
12.4. Market Attractiveness Analysis By Region
13. North America Market Analysis 2012-2021 and Forecast 2022–2032
13.1. Introduction
13.2. Pricing Analysis
13.3. Historical Market Size (US$ Mn) and Volume (Units) Trend Analysis By Market Taxonomy, 2012-2021
13.4. Current and Future Market Size (US$ Mn) and Volume (Units) Forecast By Market Taxonomy, 2022–2032
13.4.1. By Country
13.4.1.1. U.S.
13.4.1.2. Canada
13.4.2. By Product
13.4.3. By End User
13.5. Market Attractiveness Analysis
13.5.1. By Country
13.5.2. By Product
13.5.3. By End User
13.6. Market Trends
13.7. Key Market Participants - Intensity Mapping
13.8. Drivers and Restraints - Impact Analysis
13.9. Country Level Analysis & Forecast
13.9.1. U.S. Market Analysis
13.9.1.1. .Introduction
13.9.1.2. Market Analysis and Forecast by Market Taxonomy
13.9.1.2.1. By Product
13.9.1.2.2. By End User
13.9.2. Canada Market Analysis
13.9.2.1. Introduction
13.9.2.2. Market Analysis and Forecast by Market Taxonomy
13.9.2.2.1. By Product
13.9.2.2.2. By End User
14. Latin America Market Analysis 2012-2021 and Forecast 2022–2032
14.1. Introduction
14.2. Pricing Analysis
14.3. Historical Market Size (US$ Mn) and Volume (Units) Trend Analysis By Market Taxonomy, 2012-2021
14.4. Current and Future Market Size (US$ Mn) and Volume (Units) Forecast By Market Taxonomy, 2022–2032
14.4.1. By Country
14.4.1.1. Mexico
14.4.1.2. Brazil
14.4.1.3. Argentina
14.4.1.4. Rest of Latin America
14.4.2. By Product
14.4.3. By End User
14.5. Market Attractiveness Analysis
14.5.1. By Country
14.5.2. By Product
14.5.3. By End User
14.6. Market Trends
14.7. Key Market Participants - Intensity Mapping
14.8. Drivers and Restraints - Impact Analysis
14.9. Country Level Analysis & Forecast
14.9.1. Mexico Market Analysis
14.9.1.1. Introduction
14.9.1.2. Market Analysis and Forecast by Market Taxonomy
14.9.1.2.1. By Product
14.9.1.2.2. By End User
14.9.2. Brazil Market Analysis
14.9.2.1. Introduction
14.9.2.2. Market Analysis and Forecast by Market Taxonomy
14.9.2.2.1. By Product
14.9.2.2.2. By End User
14.9.3. Argentina Market Analysis
14.9.3.1. Introduction
14.9.3.2. Market Analysis and Forecast by Market Taxonomy
14.9.3.2.1. By Product
14.9.3.2.2. By End User
15. Europe Market Analysis 2012-2021 and Forecast 2022–2032
15.1. Introduction
15.2. Pricing Analysis
15.3. Historical Market Size (US$ Mn) and Volume (Units) Trend Analysis By Market Taxonomy, 2012-2021
15.4. Current and Future Market Size (US$ Mn) and Volume (Units) Forecast By Market Taxonomy, 2022–2032
15.4.1. By Country
15.4.1.1. Germany
15.4.1.2. Italy
15.4.1.3. France
15.4.1.4. U.K.
15.4.1.5. Spain
15.4.1.6. BENELUX
15.4.1.7. Russia
15.4.1.8. Rest of Europe
15.4.2. By Product
15.4.3. By End User
15.5. Market Attractiveness Analysis
15.5.1. By Country
15.5.2. By Product
15.5.3. By End User
15.6. Market Trends
15.7. Key Market Participants - Intensity Mapping
15.8. Drivers and Restraints - Impact Analysis
15.9. Country Level Analysis & Forecast
15.9.1. Germany Market Analysis
15.9.1.1. Introduction
15.9.1.2. Market Analysis and Forecast by Market Taxonomy
15.9.1.2.1. By Product
15.9.1.2.2. By End User
15.9.2. Italy Market Analysis
15.9.2.1. Introduction
15.9.2.2. Market Analysis and Forecast by Market Taxonomy
15.9.2.2.1. By Product
15.9.2.2.2. By End User
15.9.3. France Market Analysis
15.9.3.1. Introduction
15.9.3.2. Market Analysis and Forecast by Market Taxonomy
15.9.3.2.1. By Product
15.9.3.2.2. By End User
15.9.4. U.K. Market Analysis
15.9.4.1. Introduction
15.9.4.2. Market Analysis and Forecast by Market Taxonomy
15.9.4.2.1. By Product
15.9.4.2.2. By End User
15.9.5. Spain Market Analysis
15.9.5.1. Introduction
15.9.5.2. Market Analysis and Forecast by Market Taxonomy
15.9.5.2.1. By Product
15.9.5.2.2. By End User
15.9.6. BENELUX Market Analysis
15.9.6.1. Introduction
15.9.6.2. Market Analysis and Forecast by Market Taxonomy
15.9.6.2.1. By Product
15.9.6.2.2. By End User
15.9.7. Russia Market Analysis
15.9.7.1. Introduction
15.9.7.2. Market Analysis and Forecast by Market Taxonomy
15.9.7.2.1. By Product
15.9.7.2.2. By End User
16. South Asia Market Analysis 2012-2021 and Forecast 2022–2032
16.1. Introduction
16.2. Pricing Analysis
16.3. Historical Market Size (US$ Mn) and Volume (Units) Trend Analysis By Market Taxonomy, 2012-2021
16.4. Current and Future Market Size (US$ Mn) and Volume (Units) Forecast By Market Taxonomy, 2022–2032
16.4.1. By Country
16.4.1.1. India
16.4.1.2. Indonesia
16.4.1.3. Malaysia
16.4.1.4. Thailand
16.4.1.5. Rest of South Asia
16.4.2. By Product
16.4.3. By End User
16.5. Market Attractiveness Analysis
16.5.1. By Country
16.5.2. By Product
16.5.3. By End User
16.6. Market Trends
16.7. Key Market Participants - Intensity Mapping
16.8. Drivers and Restraints - Impact Analysis
16.9. Country Level Analysis & Forecast
16.9.1. India Market Analysis
16.9.1.1. Introduction
16.9.1.2. Market Analysis and Forecast by Market Taxonomy
16.9.1.2.1. By Product
16.9.1.2.2. By End User
16.9.2. Indonesia Market Analysis
16.9.2.1. Introduction
16.9.2.2. Market Analysis and Forecast by Market Taxonomy
16.9.2.2.1. By Product
16.9.2.2.2. By End User
16.9.3. Malaysia Market Analysis
16.9.3.1. Introduction
16.9.3.2. Market Analysis and Forecast by Market Taxonomy
16.9.3.2.1. By Product
16.9.3.2.2. By End User
16.9.4. Thailand Market Analysis
16.9.4.1. Introduction
16.9.4.2. Market Analysis and Forecast by Market Taxonomy
16.9.4.2.1. By Product
16.9.4.2.2. By End User
17. East Asia Market Analysis 2012-2021 and Forecast 2022–2032
17.1. Introduction
17.2. Pricing Analysis
17.3. Historical Market Size (US$ Mn) and Volume (Units) Trend Analysis By Market Taxonomy, 2012-2021
17.4. Current and Future Market Size (US$ Mn) and Volume (Units) Forecast By Market Taxonomy, 2022–2032
17.4.1. By Country
17.4.1.1. China
17.4.1.2. Japan
17.4.1.3. South Korea
17.4.2. By Product
17.4.3. By End User
17.5. Market Attractiveness Analysis
17.5.1. By Country
17.5.2. By Product
17.5.3. By End User
17.6. Market Trends
17.7. Key Market Participants - Intensity Mapping
17.8. Drivers and Restraints - Impact Analysis
17.9. Country Level Analysis & Forecast
17.9.1. China Market Analysis
17.9.1.1. Introduction
17.9.1.2. Market Analysis and Forecast by Market Taxonomy
17.9.1.2.1. By Product
17.9.1.2.2. By End User
17.9.2. Japan Market Analysis
17.9.2.1. Introduction
17.9.2.2. Market Analysis and Forecast by Market Taxonomy
17.9.2.2.1. By Product
17.9.2.2.2. By End User
17.9.3. South Korea Market Analysis
17.9.3.1. Introduction
17.9.3.2. Market Analysis and Forecast by Market Taxonomy
17.9.3.2.1. By Product
17.9.3.2.2. By End User
18. Oceania Market 2012-2021 and Forecast 2022-2032
18.1. Introduction
18.2. Pricing Analysis
18.3. Historical Market Size (US$ Mn) and Volume (Units) Trend Analysis By Market Taxonomy, 2012-2021
18.4. Current and Future Market Size (US$ Mn) and Volume (Units) Forecast By Market Taxonomy, 2022–2032
18.4.1. By Country
18.4.1.1. Australia
18.4.1.2. New Zealand
18.4.2. By Product
18.4.3. By End User
18.5. Market Attractiveness Analysis
18.5.1. By Country
18.5.2. By Product
18.5.3. By End User
18.6. Key Market Participants - Intensity Mapping
18.7. Drivers and Restraints - Impact Analysis
18.8. Country Level Analysis & Forecast
18.8.1. Australia Market Analysis
18.8.1.1. Introduction
18.8.1.2. Market Analysis and Forecast by Market Taxonomy
18.8.1.2.1. By Product
18.8.1.2.2. By End User
18.8.2. New Zealand Market Analysis
18.8.2.1. Introduction
18.8.2.2. Market Analysis and Forecast by Market Taxonomy
18.8.2.2.1. By Product
18.8.2.2.2. By End User
19. Middle East and Africa (MEA) Market Analysis 2012-2021 and Forecast 2022–2032
19.1. Introduction
19.2. Pricing Analysis
19.3. Historical Market Size (US$ Mn) and Volume (Units) Trend Analysis By Market Taxonomy, 2012-2021
19.4. Current and Future Market Size (US$ Mn) and Volume (Units) Forecast By Market Taxonomy, 2022–2032
19.4.1. By Country
19.4.1.1. GCC Countries
19.4.1.2. Turkey
19.4.1.3. South Africa
19.4.1.4. North Africa
19.4.1.5. Rest of Middle East and Africa
19.4.2. By Product
19.4.3. By End User
19.5. Market Attractiveness Analysis
19.5.1. By Country
19.5.2. By Product
19.5.3. By End User
19.6. Market Trends
19.7. Key Market Participants - Intensity Mapping
19.8. Drivers and Restraints - Impact Analysis
19.9. Country Level Analysis & Forecast
19.9.1. GCC Countries Market Analysis
19.9.1.1. Introduction
19.9.1.2. Market Analysis and Forecast by Market Taxonomy
19.9.1.2.1. By Product
19.9.1.2.2. By End User
19.9.2. Turkey Market Analysis
19.9.2.1. Introduction
19.9.2.2. Market Analysis and Forecast by Market Taxonomy
19.9.2.2.1. By Product
19.9.2.2.2. By End User
19.9.3. South Africa Market Analysis
19.9.3.1. Introduction
19.9.3.2. Market Analysis and Forecast by Market Taxonomy
19.9.3.2.1. By Product
19.9.3.2.2. By End User
19.9.4. North Africa Market Analysis
19.9.4.1. Introduction
19.9.4.2. Market Analysis and Forecast by Market Taxonomy
19.9.4.2.1. By Product
19.9.4.2.2. By End User
20. Market Structure Analysis
20.1. Market Analysis by Tier of Companies
20.2. Market Share Analysis of Top Players
20.3. Market Presence Analysis
21. Competition Analysis
21.1. Competition Dashboard
21.2. Competition Benchmarking
21.3. Competition Deep Dive
21.3.1. Thermo Fisher Scientific,
21.3.1.1. Overview
21.3.1.2. Product Portfolio
21.3.1.3. Sales Footprint
21.3.1.4. SWOT Analysis
21.3.1.5. Key Financials
21.3.1.6. Strategy Overview
21.3.2. Meril Life Sciences,
21.3.2.1. Overview
21.3.2.2. Product Portfolio
21.3.2.3. Sales Footprint
21.3.2.4. SWOT Analysis
21.3.2.5. Key Financials
21.3.2.6. Strategy Overview
21.3.3. Robimes India Pvt. Ltd.,
21.3.3.1. Overview
21.3.3.2. Product Portfolio
21.3.3.3. Sales Footprint
21.3.3.4. SWOT Analysis
21.3.3.5. Key Financials
21.3.3.6. Strategy Overview
21.3.4. Bpc Biosed Srl,
21.3.4.1. Overview
21.3.4.2. Product Portfolio
21.3.4.3. Sales Footprint
21.3.4.4. SWOT Analysis
21.3.4.5. Key Financials
21.3.4.6. Strategy Overview
21.3.5. Hycel, Eurolyser,
21.3.5.1. Overview
21.3.5.2. Product Portfolio
21.3.5.3. Sales Footprint
21.3.5.4. SWOT Analysis
21.3.5.5. Key Financials
21.3.5.6. Strategy Overview
21.3.6. Helena Laboratories,
21.3.6.1. Overview
21.3.6.2. Product Portfolio
21.3.6.3. Sales Footprint
21.3.6.4. SWOT Analysis
21.3.6.5. Key Financials
21.3.6.6. Strategy Overview
21.3.7. Diagnostica Stago SAS,
21.3.7.1. Overview
21.3.7.2. Product Portfolio
21.3.7.3. Sales Footprint
21.3.7.4. SWOT Analysis
21.3.7.5. Key Financials
21.3.7.6. Strategy Overview
21.3.8. Beijing Succeeder Technology Inc.,
21.3.8.1. Overview
21.3.8.2. Product Portfolio
21.3.8.3. Sales Footprint
21.3.8.4. SWOT Analysis
21.3.8.5. Key Financials
21.3.8.6. Strategy Overview
21.3.9. A&T Corporation,
21.3.9.1. Overview
21.3.9.2. Product Portfolio
21.3.9.3. Sales Footprint
21.3.9.4. SWOT Analysis
21.3.9.5. Key Financials
21.3.9.6. Strategy Overview
21.3.10. Genrui Biotech Inc.,
21.3.10.1. Overview
21.3.10.2. Product Portfolio
21.3.10.3. Sales Footprint
21.3.10.4. SWOT Analysis
21.3.10.5. Key Financials
21.3.10.6. Strategy Overview
21.3.11. Bio Group Medical System,
21.3.11.1. Overview
21.3.11.2. Product Portfolio
21.3.11.3. Sales Footprint
21.3.11.4. SWOT Analysis
21.3.11.5. Key Financials
21.3.11.6. Strategy Overview
21.3.12. Maccura Biotechnology Co. Ltd,
21.3.12.1. Overview
21.3.12.2. Product Portfolio
21.3.12.3. Sales Footprint
21.3.12.4. SWOT Analysis
21.3.12.5. Key Financials
21.3.12.6. Strategy Overview
21.3.13. Roche Diagnostics,
21.3.13.1. Overview
21.3.13.2. Product Portfolio
21.3.13.3. Sales Footprint
21.3.13.4. SWOT Analysis
21.3.13.5. Key Financials
21.3.13.6. Strategy Overview
21.3.14. Abbott Laboratories,
21.3.14.1. Overview
21.3.14.2. Product Portfolio
21.3.14.3. Sales Footprint
21.3.14.4. SWOT Analysis
21.3.14.5. Key Financials
21.3.14.6. Strategy Overview
21.3.15. Danaher,
21.3.15.1. Overview
21.3.15.2. Product Portfolio
21.3.15.3. Sales Footprint
21.3.15.4. SWOT Analysis
21.3.15.5. Key Financials
21.3.15.6. Strategy Overview
21.3.16. Siemens Healthineers Group,
21.3.16.1. Overview
21.3.16.2. Product Portfolio
21.3.16.3. Sales Footprint
21.3.16.4. SWOT Analysis
21.3.16.5. Key Financials
21.3.16.6. Strategy Overview
21.3.17. Sysmex Group
21.3.17.1. Overview
21.3.17.2. Product Portfolio
21.3.17.3. Sales Footprint
21.3.17.4. SWOT Analysis
21.3.17.5. Key Financials
21.3.17.6. Strategy Overview
21.3.18. Horiba,
21.3.18.1. Overview
21.3.18.2. Product Portfolio
21.3.18.3. Sales Footprint
21.3.18.4. SWOT Analysis
21.3.18.5. Key Financials
21.3.18.6. Strategy Overview
21.3.19. Nihon Kohden,
21.3.19.1. Overview
21.3.19.2. Product Portfolio
21.3.19.3. Sales Footprint
21.3.19.4. SWOT Analysis
21.3.19.5. Key Financials
21.3.19.6. Strategy Overview
21.3.20. ERBA Diagnostics, Inc.,
21.3.20.1. Overview
21.3.20.2. Product Portfolio
21.3.20.3. Sales Footprint
21.3.20.4. SWOT Analysis
21.3.20.5. Key Financials
21.3.20.6. Strategy Overview
21.3.21. Sclavo Diagnostics International S.r.l,
21.3.21.1. Overview
21.3.21.2. Product Portfolio
21.3.21.3. Sales Footprint
21.3.21.4. SWOT Analysis
21.3.21.5. Key Financials
21.3.21.6. Strategy Overview
21.3.22. Haematonics,
21.3.22.1. Overview
21.3.22.2. Product Portfolio
21.3.22.3. Sales Footprint
21.3.22.4. SWOT Analysis
21.3.22.5. Key Financials
21.3.22.6. Strategy Overview
21.3.23. Biosystems S.A.,
21.3.23.1. Overview
21.3.23.2. Product Portfolio
21.3.23.3. Sales Footprint
21.3.23.4. SWOT Analysis
21.3.23.5. Key Financials
21.3.23.6. Strategy Overview
21.3.24. ACON.
21.3.24.1. Overview
21.3.24.2. Product Portfolio
21.3.24.3. Sales Footprint
21.3.24.4. SWOT Analysis
21.3.24.5. Key Financials
21.3.24.6. Strategy Overview
22. Assumptions and Acronyms Used
23. Research Methodology
Let us know your requirement to get
100% FREE customization
List of Tables
Table 01: Global Market Value (US$ Mn) Analysis and Forecast 2012–2032, by Product
Table 02: Global Market Volume (Units) Analysis and Forecast 2012–2032, by Product
Table 03: Global Market Value (US$ Mn) Analysis and Forecast 2012–2032, by End User
Table 04: Global Market Value (US$ Mn) Analysis and Forecast 2012–2032, by Region
Table 05: North America Market Value (US$ Mn) Analysis 2012-2021 and Forecast 2022–2032, by Country
Table 06: North America Market Value (US$ Mn) Analysis and Forecast 2012–2032, by Product
Table 07: North America Market Volume (Units) Analysis and Forecast 2012–2032, by Product
Table 08: North America Market Value (US$ Mn) Analysis and Forecast 2012–2032, by End User
Table 09: Latin America Market Value (US$ Mn) Analysis 2012-2021 and Forecast 2022–2032, by Country
Table 10: Latin America Market Value (US$ Mn) Analysis and Forecast 2012–2032, by Product
Table 11: Latin America Market Volume (Units) Analysis and Forecast 2012–2032, by Product
Table 12: Latin America Market Value (US$ Mn) Analysis and Forecast 2012–2032, by End User
Table 13: Europe Market Value (US$ Mn) Analysis 2012-2021 and Forecast 2022–2032, by Country
Table 14: Europe Market Value (US$ Mn) Analysis and Forecast 2012–2032, by Product
Table 15: Europe Market Volume (Units) Analysis and Forecast 2012–2032, by Product
Table 16: Europe Market Value (US$ Mn) Analysis and Forecast 2012–2032, by End User
Table 17: South Asia Market Value (US$ Mn) Analysis 2012-2021 and Forecast 2022–2032, by Country
Table 18: South Asia Market Value (US$ Mn) Analysis and Forecast 2012–2032, by Product
Table 19: South Asia Market Volume (Units) Analysis and Forecast 2012–2032, by Product
Table 20: South Asia Market Value (US$ Mn) Analysis and Forecast 2012–2032, by End User
Table 21: East Asia Market Value (US$ Mn) Analysis 2012-2021 and Forecast 2022–2032, by Country
Table 22: East Asia Market Value (US$ Mn) Analysis and Forecast 2012–2032, by Product
Table 23: East Asia Market Volume (Units) Analysis and Forecast 2012–2032, by Product
Table 24: East Asia Market Value (US$ Mn) Analysis and Forecast 2012–2032, by End User
Table 25: Oceania Market Value (US$ Mn) Analysis 2012-2021 and Forecast 2022–2032, by Country
Table 26: Oceania Market Value (US$ Mn) Analysis and Forecast 2012–2032, by Product
Table 27: Oceania Market Volume (Units) Analysis and Forecast 2012–2032, by Product
Table 28: Oceania Market Value (US$ Mn) Analysis and Forecast 2012–2032, by End User
Table 29: MEA Market Value (US$ Mn) Analysis 2012-2021 and Forecast 2022–2032, by Country
Table 30: MEA Market Value (US$ Mn) Analysis and Forecast 2012–2032, by Product
Table 31: MEA Market Volume (Units) Analysis and Forecast 2012–2032, by Product
Table 32: MEA Market Value (US$ Mn) Analysis and Forecast 2012–2032, by End User
Find your sweet spots for generating winning opportunities in this market.
Talk to AnalystList of Charts
Figure 01: Global Market Volume (Units), 2012-2021
Figure 02: Global Market Volume (Units) & Y-o-Y Growth (%) Analysis, 2022–2032
Figure 03: Market, Pricing Analysis per unit (US$), in 2022
Figure 04: Market, Pricing Forecast per unit (US$), in 2032
Figure 05: Global Market Value (US$ Mn) Analysis, 2012-2021
Figure 06: Global Market Forecast & Y-o-Y Growth, 2022–2032
Figure 07: Global Market Absolute $ Opportunity (US$ Mn) Analysis, 2021–2032
Figure 08: Global Market Value Share (%) Analysis 2022 and 2032, by Product
Figure 09: Global Market Y-o-Y Growth (%) Analysis 2021-2032, by Product
Figure 10: Global Market Attractiveness Analysis 2022–2032, by Product
Figure 11: Global Market Value Share (%) Analysis 2022 and 2032, by End User
Figure 12: Global Market Y-o-Y Growth (%) Analysis 2021-2032, by End User
Figure 13: Global Market Attractiveness Analysis 2022–2032, by End User
Figure 14: Global Market Value Share (%) Analysis 2022 and 2032, by Region
Figure 15: Global Market Y-o-Y Growth (%) Analysis 2021-2032, by Region
Figure 16: Global Market Attractiveness Analysis 2022–2032, by Region
Figure 17: North America Market Value (US$ Mn) Analysis, 2012-2021
Figure 18: North America Market Value (US$ Mn) Forecast, 2022-2032
Figure 19: North America Market Value Share, by Product (2022 E)
Figure 20: North America Market Value Share, by End User (2022 E)
Figure 21: North America Market Value Share, by Country (2022 E)
Figure 22: North America Market Attractiveness Analysis by Product, 2022–2032
Figure 23: North America Market Attractiveness Analysis by End User, 2022–2032
Figure 24: North America Market Attractiveness Analysis by Country, 2022–2032
Figure 25: U.S. Market Value Proportion Analysis, 2021
Figure 26: Global Vs. U.S. Growth Comparison, 2021 - 2032
Figure 27: U.S. Market Share Analysis (%) by Product, 2021 & 2032
Figure 28: U.S. Market Share Analysis (%) by End User, 2021 & 2032
Figure 29: Canada Market Value Proportion Analysis, 2021
Figure 30: Global Vs. Canada. Growth Comparison, 2021 - 2032
Figure 31: Canada Market Share Analysis (%) by Product, 2021 & 2032
Figure 32: Canada Market Share Analysis (%) by End User, 2021 & 2032
Figure 33: Latin America Market Value (US$ Mn) Analysis, 2012-2021
Figure 34: Latin America Market Value (US$ Mn) Forecast, 2022-2032
Figure 35: Latin America Market Value Share, by Product (2022 E)
Figure 36: Latin America Market Value Share, by End User (2022 E)
Figure 37: Latin America Market Value Share, by Country (2022 E)
Figure 38: Latin America Market Attractiveness Analysis by Product, 2022–2032
Figure 39: Latin America Market Attractiveness Analysis by End User, 2022–2032
Figure 40: Latin America Market Attractiveness Analysis by Country, 2022–2032
Figure 41: Mexico Market Value Proportion Analysis, 2021
Figure 42: Global Vs Mexico Growth Comparison, 2021 - 2032
Figure 43: Mexico Market Share Analysis (%) by Product, 2021 & 2032
Figure 44: Mexico Market Share Analysis (%) by End User, 2021 & 2032
Figure 45: Brazil Market Value Proportion Analysis, 2021
Figure 46: Global Vs. Brazil. Growth Comparison, 2021 - 2032
Figure 47: Brazil Market Share Analysis (%) by Product, 2021 & 2032
Figure 48: Brazil Market Share Analysis (%) by End User, 2021 & 2032
Figure 49: Argentina Market Value Proportion Analysis, 2021
Figure 50: Global Vs Argentina Growth Comparison, 2021 - 2032
Figure 51: Argentina Market Share Analysis (%) by Product, 2021 & 2032
Figure 52: Argentina Market Share Analysis (%) by End User, 2021 & 2032
Figure 53: Europe Market Value (US$ Mn) Analysis, 2012-2021
Figure 54: Europe Market Value (US$ Mn) Forecast, 2022-2032
Figure 55: Europe Market Value Share, by Product (2022 E)
Figure 56: Europe Market Value Share, by End User (2022 E)
Figure 57: Europe Market Value Share, by Country (2022 E)
Figure 58: Europe Market Attractiveness Analysis by Product, 2022–2032
Figure 59: Europe Market Attractiveness Analysis by End User, 2022–2032
Figure 60: Europe Market Attractiveness Analysis by Country, 2022–2032
Figure 61: UK Market Value Proportion Analysis, 2021
Figure 62: Global Vs. UK Growth Comparison, 2021 - 2032
Figure 63: UK Market Share Analysis (%) by Product, 2021 & 2032
Figure 64: UK Market Share Analysis (%) by End User, 2021 & 2032
Figure 65: Germany Market Value Proportion Analysis, 2021
Figure 66: Global Vs. Germany Growth Comparison, 2021 - 2032
Figure 67: Germany Market Share Analysis (%) by Product, 2021 & 2032
Figure 68: Germany Market Share Analysis (%) by End User, 2021 & 2032
Figure 69: Italy Market Value Proportion Analysis, 2021
Figure 70: Global Vs. Italy Growth Comparison, 2021 - 2032
Figure 71: Italy Market Share Analysis (%) by Product, 2021 & 2032
Figure 72: Italy Market Share Analysis (%) by End User, 2021 & 2032
Figure 73: France Market Value Proportion Analysis, 2021
Figure 74: Global Vs France Growth Comparison, 2021 - 2032
Figure 75: France Market Share Analysis (%) by Product, 2021 & 2032
Figure 76: France Market Share Analysis (%) by End User, 2021 & 2032
Figure 77: Spain Market Value Proportion Analysis, 2021
Figure 78: Global Vs Spain Growth Comparison, 2021 - 2032
Figure 79: Spain Market Share Analysis (%) by Product, 2021 & 2032
Figure 80: Spain Market Share Analysis (%) by End User, 2021 & 2032
Figure 81: Russia Market Value Proportion Analysis, 2021
Figure 82: Global Vs Russia Growth Comparison, 2021 - 2032
Figure 83: Russia Market Share Analysis (%) by Product, 2021 & 2032
Figure 84: Russia Market Share Analysis (%) by End User, 2021 & 2032
Figure 85: BENELUX Market Value Proportion Analysis, 2021
Figure 86: Global Vs BENELUX Growth Comparison, 2021 - 2032
Figure 87: BENELUX Market Share Analysis (%) by Product, 2021 & 2032
Figure 88: BENELUX Market Share Analysis (%) by End User, 2021 & 2032
Figure 89: East Asia Market Value (US$ Mn) Analysis, 2012-2021
Figure 90: East Asia Market Value (US$ Mn) Forecast, 2022-2032
Figure 91: East Asia Market Value Share, by Product (2022 E)
Figure 92: East Asia Market Value Share, by End User (2022 E)
Figure 93: East Asia Market Value Share, by Country (2022 E)
Figure 94: East Asia Market Attractiveness Analysis by Product, 2022–2032
Figure 95: East Asia Market Attractiveness Analysis by End User, 2022–2032
Figure 96: East Asia Market Attractiveness Analysis by Country, 2022–2032
Figure 97: China Market Value Proportion Analysis, 2021
Figure 98: Global Vs. China Growth Comparison, 2021 - 2032
Figure 99: China Market Share Analysis (%) by Product, 2021 & 2032
Figure 100: China Market Share Analysis (%) by End User, 2021 & 2032
Figure 101: Japan Market Value Proportion Analysis, 2021
Figure 102: Global Vs. Japan Growth Comparison, 2021 - 2032
Figure 103: Japan Market Share Analysis (%) by Product, 2021 & 2032
Figure 104: Japan Market Share Analysis (%) by End User, 2021 & 2032
Figure 105: South Korea Market Value Proportion Analysis, 2021
Figure 106: Global Vs South Korea Growth Comparison, 2021 - 2032
Figure 107: South Korea Market Share Analysis (%) by Product, 2021 & 2032
Figure 108: South Korea Market Share Analysis (%) by End User, 2021 & 2032
Figure 109: South Asia Market Value (US$ Mn) Analysis, 2012-2021
Figure 110: South Asia Market Value (US$ Mn) Forecast, 2022-2032
Figure 111: South Asia Market Value Share, by Product (2022 E)
Figure 112: South Asia Market Value Share, by End User (2022 E)
Figure 113: South Asia Market Value Share, by Country (2022 E)
Figure 114: South Asia Market Attractiveness Analysis by Product, 2022–2032
Figure 115: South Asia Market Attractiveness Analysis by End User, 2022–2032
Figure 116: South Asia Market Attractiveness Analysis by Country, 2022–2032
Figure 117: India Market Value Proportion Analysis, 2021
Figure 118: Global Vs. India Growth Comparison, 2021 - 2032
Figure 119: India Market Share Analysis (%) by Product, 2021 & 2032
Figure 120: India Market Share Analysis (%) by End User, 2021 & 2032
Figure 121: Indonesia Market Value Proportion Analysis, 2021
Figure 122: Global Vs. Indonesia Growth Comparison, 2021 - 2032
Figure 123: Indonesia Market Share Analysis (%) by Product, 2021 & 2032
Figure 124: Indonesia Market Share Analysis (%) by End User, 2021 & 2032
Figure 125: Malaysia Market Value Proportion Analysis, 2021
Figure 126: Global Vs. Malaysia Growth Comparison, 2021 - 2032
Figure 127: Malaysia Market Share Analysis (%) by Product, 2021 & 2032
Figure 128: Malaysia Market Share Analysis (%) by End User, 2021 & 2032
Figure 129: Thailand Market Value Proportion Analysis, 2021
Figure 130: Global Vs. Thailand Growth Comparison, 2021 - 2032
Figure 131: Thailand Market Share Analysis (%) by Product, 2021 & 2032
Figure 132: Thailand Market Share Analysis (%) by End User, 2021 & 2032
Figure 133: Oceania Market Value (US$ Mn) Analysis, 2012-2021
Figure 134: Oceania Market Value (US$ Mn) Forecast, 2022-2032
Figure 135: Oceania Market Value Share, by Product (2022 E)
Figure 136: Oceania Market Value Share, by End User (2022 E)
Figure 137: Oceania Market Value Share, by Country (2022 E)
Figure 138: Oceania Market Attractiveness Analysis by Product, 2022–2032
Figure 139: Oceania Market Attractiveness Analysis by End User, 2022–2032
Figure 140: Oceania Market Attractiveness Analysis by Country, 2022–2032
Figure 141: Australia Market Value Proportion Analysis, 2021
Figure 142: Global Vs. Australia Growth Comparison, 2021 - 2032
Figure 143: Australia Market Share Analysis (%) by Product, 2021 & 2032
Figure 144: Australia Market Share Analysis (%) by End User, 2021 & 2032
Figure 145: New Zealand Market Value Proportion Analysis, 2021
Figure 146: Global Vs New Zealand Growth Comparison, 2021 - 2032
Figure 147: New Zealand Market Share Analysis (%) by Product, 2021 & 2032
Figure 148: New Zealand Market Share Analysis (%) by End User, 2021 & 2032
Figure 149: Middle East & Africa Market Value (US$ Mn) Analysis, 2012-2021
Figure 150: Middle East & Africa Market Value (US$ Mn) Forecast, 2022-2032
Figure 151: Middle East & Africa Market Value Share, by Product (2022 E)
Figure 152: Middle East & Africa Market Value Share, by End User (2022 E)
Figure 153: Middle East & Africa Market Value Share, by Country (2022 E)
Figure 154: Middle East & Africa Market Attractiveness Analysis by Product, 2022–2032
Figure 155: Middle East & Africa Market Attractiveness Analysis by End User, 2022–2032
Figure 156: Middle East & Africa Market Attractiveness Analysis by Country, 2022–2032
Figure 157: GCC Countries Market Value Proportion Analysis, 2021
Figure 158: Global Vs GCC Countries Growth Comparison, 2021 - 2032
Figure 159: GCC Countries Market Share Analysis (%) by Product, 2021 & 2032
Figure 160: GCC Countries Market Share Analysis (%) by End User, 2021 & 2032
Figure 161: Turkey Market Value Proportion Analysis, 2021
Figure 162: Global Vs. Turkey Growth Comparison, 2021 - 2032
Figure 163: Turkey Market Share Analysis (%) by Product, 2021 & 2032
Figure 164: Turkey Market Share Analysis (%) by End User, 2021 & 2032
Figure 165: South Africa Market Value Proportion Analysis, 2021
Figure 166: Global Vs. South Africa Growth Comparison, 2021 - 2032
Figure 167: South Africa Market Share Analysis (%) by Product, 2021 & 2032
Figure 168: South Africa Market Share Analysis (%) by End User, 2021 & 2032
Figure 169: North Africa Market Value Proportion Analysis, 2021
Figure 170: Global Vs North Africa Growth Comparison, 2021 - 2032
Figure 171: North Africa Market Share Analysis (%) by Product, 2021 & 2032
Figure 172: North Africa Market Share Analysis (%) by End User, 2021 & 2032
Need specific information?
Request CustomizationExplore Healthcare Insights
View Reports