Special Coagulation Tests Market Size and Share Forecast Outlook 2025 to 2035

The Special Coagulation Tests Market is estimated to be valued at USD 2.7 billion in 2025 and is projected to reach USD 6.0 billion by 2035, registering a compound annual growth rate (CAGR) of 8.3% over the forecast period.
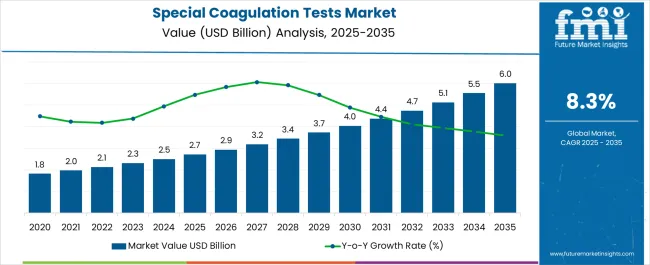
Quick Stats for Special Coagulation Tests Market

  • Special Coagulation Tests Market Value (2025): USD 2.7 billion
  • Special Coagulation Tests Market Forecast Value (2035): USD 6.0 billion
  • Special Coagulation Tests Market Forecast CAGR: 8.3%
  • Leading Segment in Special Coagulation Tests Market in 2025: Prothrombin Time (PT) (32.5%)
  • Key Growth Regions in Special Coagulation Tests Market: North America, Asia-Pacific, Europe
  • Top Key Players in Special Coagulation Tests Market: Roche, Abbott, SYSMEX, Siemens, Stago International, Universal Biosensors, Helena Laboratories, Accriva Diagnostics, CoaguSense, HomoSonics, iLine Microsystems, Instrumentation Laboratory

Special Coagulation Tests Market Value Analysis

Special Coagulation Tests Market Key Takeaways

Metric Value
Special Coagulation Tests Market Estimated Value in (2025 E) USD 2.7 billion
Special Coagulation Tests Market Forecast Value in (2035 F) USD 6.0 billion
Forecast CAGR (2025 to 2035) 8.3%

Why is the Special Coagulation Tests Market Growing?

The Special Coagulation Tests market is witnessing steady growth, driven by the increasing prevalence of bleeding disorders, thrombotic conditions, and cardiovascular diseases that require precise diagnosis and monitoring. Rising awareness among healthcare providers and patients about the importance of early detection and disease management is further supporting market expansion. Technological advancements in testing methods, automation, and digital reporting are improving accuracy and efficiency in laboratories and clinical settings.

The growing demand for point-of-care testing, coupled with the need for standardized and reliable diagnostic solutions, is shaping market adoption. Investments in hospital laboratories, diagnostic centers, and research institutions are enabling wider accessibility to coagulation tests.

Regulatory emphasis on accurate diagnosis and monitoring of coagulation parameters is driving compliance and adoption across healthcare systems As healthcare providers increasingly focus on patient safety, risk mitigation, and personalized treatment, the demand for advanced coagulation testing solutions is expected to sustain long-term growth, with ongoing innovations in consumables, testing equipment, and analytical technologies reinforcing market momentum.

Segmental Analysis

The special coagulation tests market is segmented by test type, product type, technology type, end user, and geographic regions. By test type, special coagulation tests market is divided into Prothrombin Time (PT), Activated Clotting Time (ACT), Fibrinogen, D Dimer, Anti-Factor Xa, Activated Partial Thromboplastin Time (PTT), Heparin & Protamine Dose Response Test For ACT, Platelet Function, and Other Coagulation Tests. In terms of product type, special coagulation tests market is classified into Consumables and Systems. Based on technology type, special coagulation tests market is segmented into Mechanical, Electrochemical, Optical, and Other Technologies. By end user, special coagulation tests market is segmented into Clinical Laboratories, Diagnostic Laboratories, Home Care Settings, and Others. Regionally, the special coagulation tests industry is classified into North America, Latin America, Western Europe, Eastern Europe, Balkan & Baltic Countries, Russia & Belarus, Central Asia, East Asia, South Asia & Pacific, and the Middle East & Africa.
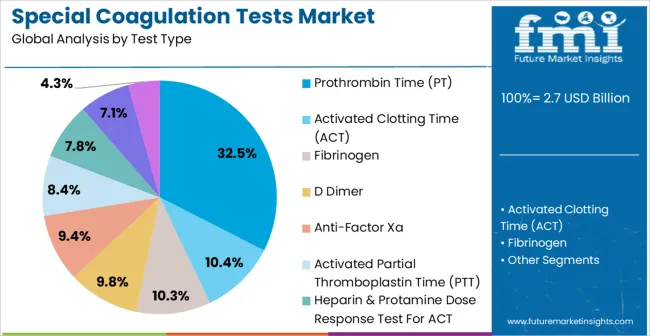
Insights into the Prothrombin Time (PT) Test Type Segment

Special Coagulation Tests Market Analysis By Test Type

The Prothrombin Time (PT) test type is projected to hold 32.5% of the market revenue in 2025, establishing it as the leading test type. Growth is being driven by its critical role in monitoring anticoagulant therapy, detecting clotting disorders, and assessing liver function. PT testing is widely adopted due to its clinical relevance in managing patients on warfarin and other anticoagulants, as well as its use in preoperative assessments.

Advances in assay reagents, automation, and digital readouts have enhanced test accuracy, reproducibility, and laboratory efficiency. The availability of standardized protocols and international normalized ratio (INR) calibration has further strengthened clinical confidence.

The ability to rapidly obtain reliable results supports timely therapeutic decisions and improves patient outcomes As cardiovascular diseases and coagulopathy cases continue to rise globally, the Prothrombin Time test type is expected to maintain its market leadership, supported by its essential diagnostic value, established clinical utility, and compatibility with advanced laboratory systems.
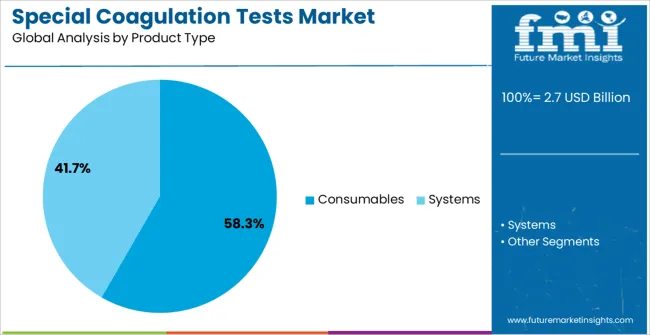
Insights into the Consumables Product Type Segment

Special Coagulation Tests Market Analysis By Product Type

The consumables product type is anticipated to account for 58.3% of the market revenue in 2025, making it the largest product type segment. Growth in this segment is being driven by the recurring demand for reagents, test kits, and calibration materials required for routine coagulation testing. Consumables are critical for ensuring test accuracy, reliability, and consistency across laboratory workflows.

Advancements in reagent formulations, stability, and shelf-life have further reinforced their adoption in clinical and research laboratories. The widespread use of automated and semi-automated analyzers has increased dependency on high-quality consumables to maintain operational efficiency and precision. Increasing laboratory testing volumes and the growing number of diagnostic facilities are expanding the market for consumables.

The ability to support multiple test types and integrate with modern laboratory equipment provides additional advantages As healthcare providers focus on reliable diagnostics, reproducibility, and compliance with international testing standards, consumables are expected to remain the primary contributor to market revenue and sustain long-term growth.
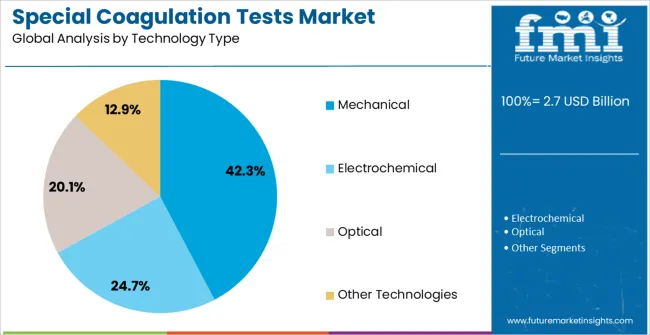
Insights into the Mechanical Technology Type Segment

Special Coagulation Tests Market Analysis By Technology Type

The mechanical technology type segment is projected to hold 42.3% of the market revenue in 2025, establishing it as the leading technology segment. Growth is being driven by the widespread adoption of mechanical clot detection systems, which are known for their reliability, ease of use, and reproducibility in coagulation testing. These systems are particularly suitable for small to mid-sized laboratories due to their lower maintenance requirements and consistent performance.

The integration of digital readouts and automated sample handling in modern mechanical systems has enhanced throughput and accuracy. Mechanical technology is often preferred for standard coagulation assays such as Prothrombin Time and Activated Partial Thromboplastin Time, ensuring high clinical confidence.

Its robustness, cost-effectiveness, and compatibility with existing laboratory infrastructure further support adoption As demand for reliable and scalable coagulation testing solutions continues to rise in clinical diagnostics, research, and therapeutic monitoring, the mechanical technology type segment is expected to maintain its leadership, driven by proven accuracy, operational simplicity, and strong market acceptance.

Market Overview

Special Coagulation Tests Market Overview

Special coagulation tests are performed to measure the blood’s ability to clot and the time taken in it. The special coagulation tests are prescribed by the doctor in case of clotting disorders. The coagulation disorders may be caused due to thrombophilia (condition of excessive clotting), hemophilia (Condition of inability to clot normally), blood factor deficiency, or other liver diseases.

The coagulation disorders may be either acquired or inherited. Coagulation is an innate process that prevents the excessive bleeding in case of a cut or skin injury. The blood in the blood vessels should not clot, or hence will lead to severe conditions such as, stroke, heart attack or even death. The special coagulation test measures the capability of the blood to form a clot in case of physical injury leading to blood loss.

The special coagulation laboratory tests are useful in elucidating the cause of excessive bleeding. Moreover, the tests do not provide information concerning the occurrence of bleeding in post- operative or perioperative period. Also, the well described special coagulation test, are used to detect the hereditary predilection of thrombosis. The coagulation disorders may be either acquired or inherited.
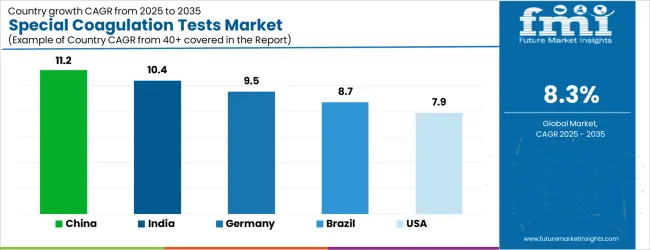
Analysis of Special Coagulation Tests Market By Key Countries

Special Coagulation Tests Market Cagr Analysis By Country

Country CAGR
China 11.2%
India 10.4%
Germany 9.5%
Brazil 8.7%
USA 7.9%
UK 7.1%
Japan 6.2%

Country-wise Analysis

The Special Coagulation Tests Market is expected to register a CAGR of 8.3% during the forecast period, exhibiting varied country level momentum. China leads with the highest CAGR of 11.2%, followed by India at 10.4%. Developed markets such as Germany, France, and the UK continue to expand steadily, while the USA is likely to grow at consistent rates. Japan posts the lowest CAGR at 6.2%, yet still underscores a broadly positive trajectory for the global Special Coagulation Tests Market. In 2024, Germany held a dominant revenue in the Western Europe market and is expected to grow with a CAGR of 9.5%. The USA Special Coagulation Tests Market is estimated to be valued at USD 944.1 million in 2025 and is anticipated to reach a valuation of USD 944.1 million by 2035. Sales are projected to rise at a CAGR of 0.0% over the forecast period between 2025 and 2035. While Japan and South Korea markets are estimated to be valued at USD 126.3 million and USD 83.1 million respectively in 2025.
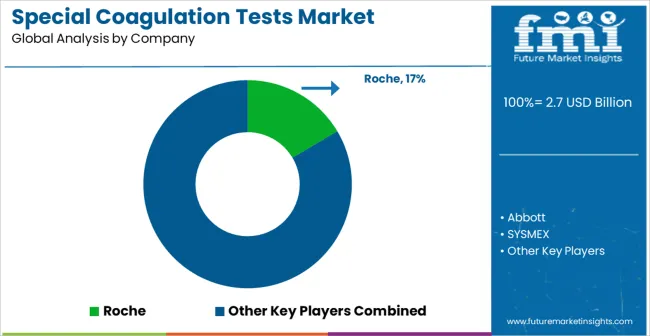
Key Players in the Special Coagulation Tests Market

Special Coagulation Tests Market Analysis By Company

  • Roche
  • Abbott
  • SYSMEX
  • Siemens
  • Stago International
  • Universal Biosensors
  • Helena Laboratories
  • Accriva Diagnostics
  • CoaguSense
  • HomoSonics
  • iLine Microsystems
  • Instrumentation Laboratory

Scope of the Report

Item Value
Quantitative Units USD 2.7 Billion
Test Type Prothrombin Time (PT), Activated Clotting Time (ACT), Fibrinogen, D Dimer, Anti-Factor Xa, Activated Partial Thromboplastin Time (PTT), Heparin & Protamine Dose Response Test For ACT, Platelet Function, and Other Coagulation Tests
Product Type Consumables and Systems
Technology Type Mechanical, Electrochemical, Optical, and Other Technologies
End User Clinical Laboratories, Diagnostic Laboratories, Home Care Settings, and Others
Regions Covered North America, Europe, Asia-Pacific, Latin America, Middle East & Africa
Country Covered United States, Canada, Germany, France, United Kingdom, China, Japan, India, Brazil, South Africa
Key Companies Profiled Roche, Abbott, SYSMEX, Siemens, Stago International, Universal Biosensors, Helena Laboratories, Accriva Diagnostics, CoaguSense, HomoSonics, iLine Microsystems, and Instrumentation Laboratory

Special Coagulation Tests Market by Segments

Test Type:

  • Prothrombin Time (PT)
  • Activated Clotting Time (ACT)
  • Fibrinogen
  • D Dimer
  • Anti-Factor Xa
  • Activated Partial Thromboplastin Time (PTT)
  • Heparin & Protamine Dose Response Test For ACT
  • Platelet Function
  • Other Coagulation Tests

Product Type:

  • Consumables
  • Systems

Technology Type:

  • Mechanical
  • Electrochemical
  • Optical
  • Other Technologies

End User:

  • Clinical Laboratories
  • Diagnostic Laboratories
  • Home Care Settings
  • Others

Region:

  • North America
    • USA
    • Canada
    • Mexico
  • Latin America
    • Brazil
    • Chile
    • Rest of Latin America
  • Western Europe
    • Germany
    • UK
    • Italy
    • Spain
    • France
    • Nordic
    • BENELUX
    • Rest of Western Europe
  • Eastern Europe
    • Russia
    • Poland
    • Hungary
    • Balkan & Baltic
    • Rest of Eastern Europe
  • East Asia
    • China
    • Japan
    • South Korea
  • South Asia and Pacific
    • India
    • ASEAN
    • Australia & New Zealand
    • Rest of South Asia and Pacific
  • Middle East & Africa
    • Kingdom of Saudi Arabia
    • Other GCC Countries
    • Turkiye
    • South Africa
    • Other African Union
    • Rest of Middle East & Africa

Frequently Asked Questions

How big is the special coagulation tests market in 2025?

The global special coagulation tests market is estimated to be valued at USD 2.7 billion in 2025.

What will be the size of special coagulation tests market in 2035?

The market size for the special coagulation tests market is projected to reach USD 6.0 billion by 2035.

How much will be the special coagulation tests market growth between 2025 and 2035?

The special coagulation tests market is expected to grow at a 8.3% CAGR between 2025 and 2035.

What are the key product types in the special coagulation tests market?

The key product types in special coagulation tests market are prothrombin time (pt), activated clotting time (act), fibrinogen, d dimer, anti-factor xa, activated partial thromboplastin time (ptt), heparin & protamine dose response test for act, platelet function and other coagulation tests.

Which product type segment to contribute significant share in the special coagulation tests market in 2025?

In terms of product type, consumables segment to command 58.3% share in the special coagulation tests market in 2025.

Table of Content

  1. Executive Summary
    • Global Market Outlook
    • Demand-side Trends
    • Supply-side Trends
    • Technology Roadmap Analysis
    • Analysis and Recommendations
  2. Market Overview
    • Market Coverage / Taxonomy
    • Market Definition / Scope / Limitations
  3. Market Background
    • Market Dynamics
      • Drivers
      • Restraints
      • Opportunity
      • Trends
    • Scenario Forecast
      • Demand in Optimistic Scenario
      • Demand in Likely Scenario
      • Demand in Conservative Scenario
    • Opportunity Map Analysis
    • Product Life Cycle Analysis
    • Supply Chain Analysis
    • Investment Feasibility Matrix
    • Value Chain Analysis
    • PESTLE and Porter’s Analysis
    • Regulatory Landscape
    • Regional Parent Market Outlook
    • Production and Consumption Statistics
    • Import and Export Statistics
  4. Global Market Analysis 2020 to 2024 and Forecast, 2025 to 2035
    • Historical Market Size Value (USD Million) Analysis, 2020 to 2024
    • Current and Future Market Size Value (USD Million) Projections, 2025 to 2035
      • Y-o-Y Growth Trend Analysis
      • Absolute $ Opportunity Analysis
  5. Global Market Pricing Analysis 2020 to 2024 and Forecast 2025 to 2035
  6. Global Market Analysis 2020 to 2024 and Forecast 2025 to 2035, By Test Type
    • Introduction / Key Findings
    • Historical Market Size Value (USD Million) Analysis By Test Type , 2020 to 2024
    • Current and Future Market Size Value (USD Million) Analysis and Forecast By Test Type , 2025 to 2035
      • Prothrombin Time (PT)
      • Activated Clotting Time (ACT)
      • Fibrinogen
      • D Dimer
      • Anti-Factor Xa
      • Activated Partial Thromboplastin Time (PTT)
      • Heparin & Protamine Dose Response Test For ACT
      • Platelet Function
      • Other Coagulation Tests
    • Y-o-Y Growth Trend Analysis By Test Type , 2020 to 2024
    • Absolute $ Opportunity Analysis By Test Type , 2025 to 2035
  7. Global Market Analysis 2020 to 2024 and Forecast 2025 to 2035, By Product Type
    • Introduction / Key Findings
    • Historical Market Size Value (USD Million) Analysis By Product Type, 2020 to 2024
    • Current and Future Market Size Value (USD Million) Analysis and Forecast By Product Type, 2025 to 2035
      • Consumables
        • Reagents
        • Standards, Controls And Calibrations
      • Systems
        • Automated Systems
        • Semi-Automated Systems
        • Manual Systems
    • Y-o-Y Growth Trend Analysis By Product Type, 2020 to 2024
    • Absolute $ Opportunity Analysis By Product Type, 2025 to 2035
  8. Global Market Analysis 2020 to 2024 and Forecast 2025 to 2035, By Technology Type
    • Introduction / Key Findings
    • Historical Market Size Value (USD Million) Analysis By Technology Type, 2020 to 2024
    • Current and Future Market Size Value (USD Million) Analysis and Forecast By Technology Type, 2025 to 2035
      • Mechanical
      • Electrochemical
      • Optical
      • Other Technologies
    • Y-o-Y Growth Trend Analysis By Technology Type, 2020 to 2024
    • Absolute $ Opportunity Analysis By Technology Type, 2025 to 2035
  9. Global Market Analysis 2020 to 2024 and Forecast 2025 to 2035, By End User
    • Introduction / Key Findings
    • Historical Market Size Value (USD Million) Analysis By End User, 2020 to 2024
    • Current and Future Market Size Value (USD Million) Analysis and Forecast By End User, 2025 to 2035
      • Clinical Laboratories
      • Diagnostic Laboratories
      • Home Care Settings
      • Others
    • Y-o-Y Growth Trend Analysis By End User, 2020 to 2024
    • Absolute $ Opportunity Analysis By End User, 2025 to 2035
  10. Global Market Analysis 2020 to 2024 and Forecast 2025 to 2035, By Region
    • Introduction
    • Historical Market Size Value (USD Million) Analysis By Region, 2020 to 2024
    • Current Market Size Value (USD Million) Analysis and Forecast By Region, 2025 to 2035
      • North America
      • Latin America
      • Western Europe
      • Eastern Europe
      • East Asia
      • South Asia and Pacific
      • Middle East & Africa
    • Market Attractiveness Analysis By Region
  11. North America Market Analysis 2020 to 2024 and Forecast 2025 to 2035, By Country
    • Historical Market Size Value (USD Million) Trend Analysis By Market Taxonomy, 2020 to 2024
    • Market Size Value (USD Million) Forecast By Market Taxonomy, 2025 to 2035
      • By Country
        • USA
        • Canada
        • Mexico
      • By Test Type
      • By Product Type
      • By Technology Type
      • By End User
    • Market Attractiveness Analysis
      • By Country
      • By Test Type
      • By Product Type
      • By Technology Type
      • By End User
    • Key Takeaways
  12. Latin America Market Analysis 2020 to 2024 and Forecast 2025 to 2035, By Country
    • Historical Market Size Value (USD Million) Trend Analysis By Market Taxonomy, 2020 to 2024
    • Market Size Value (USD Million) Forecast By Market Taxonomy, 2025 to 2035
      • By Country
        • Brazil
        • Chile
        • Rest of Latin America
      • By Test Type
      • By Product Type
      • By Technology Type
      • By End User
    • Market Attractiveness Analysis
      • By Country
      • By Test Type
      • By Product Type
      • By Technology Type
      • By End User
    • Key Takeaways
  13. Western Europe Market Analysis 2020 to 2024 and Forecast 2025 to 2035, By Country
    • Historical Market Size Value (USD Million) Trend Analysis By Market Taxonomy, 2020 to 2024
    • Market Size Value (USD Million) Forecast By Market Taxonomy, 2025 to 2035
      • By Country
        • Germany
        • UK
        • Italy
        • Spain
        • France
        • Nordic
        • BENELUX
        • Rest of Western Europe
      • By Test Type
      • By Product Type
      • By Technology Type
      • By End User
    • Market Attractiveness Analysis
      • By Country
      • By Test Type
      • By Product Type
      • By Technology Type
      • By End User
    • Key Takeaways
  14. Eastern Europe Market Analysis 2020 to 2024 and Forecast 2025 to 2035, By Country
    • Historical Market Size Value (USD Million) Trend Analysis By Market Taxonomy, 2020 to 2024
    • Market Size Value (USD Million) Forecast By Market Taxonomy, 2025 to 2035
      • By Country
        • Russia
        • Poland
        • Hungary
        • Balkan & Baltic
        • Rest of Eastern Europe
      • By Test Type
      • By Product Type
      • By Technology Type
      • By End User
    • Market Attractiveness Analysis
      • By Country
      • By Test Type
      • By Product Type
      • By Technology Type
      • By End User
    • Key Takeaways
  15. East Asia Market Analysis 2020 to 2024 and Forecast 2025 to 2035, By Country
    • Historical Market Size Value (USD Million) Trend Analysis By Market Taxonomy, 2020 to 2024
    • Market Size Value (USD Million) Forecast By Market Taxonomy, 2025 to 2035
      • By Country
        • China
        • Japan
        • South Korea
      • By Test Type
      • By Product Type
      • By Technology Type
      • By End User
    • Market Attractiveness Analysis
      • By Country
      • By Test Type
      • By Product Type
      • By Technology Type
      • By End User
    • Key Takeaways
  16. South Asia and Pacific Market Analysis 2020 to 2024 and Forecast 2025 to 2035, By Country
    • Historical Market Size Value (USD Million) Trend Analysis By Market Taxonomy, 2020 to 2024
    • Market Size Value (USD Million) Forecast By Market Taxonomy, 2025 to 2035
      • By Country
        • India
        • ASEAN
        • Australia & New Zealand
        • Rest of South Asia and Pacific
      • By Test Type
      • By Product Type
      • By Technology Type
      • By End User
    • Market Attractiveness Analysis
      • By Country
      • By Test Type
      • By Product Type
      • By Technology Type
      • By End User
    • Key Takeaways
  17. Middle East & Africa Market Analysis 2020 to 2024 and Forecast 2025 to 2035, By Country
    • Historical Market Size Value (USD Million) Trend Analysis By Market Taxonomy, 2020 to 2024
    • Market Size Value (USD Million) Forecast By Market Taxonomy, 2025 to 2035
      • By Country
        • Kingdom of Saudi Arabia
        • Other GCC Countries
        • Turkiye
        • South Africa
        • Other African Union
        • Rest of Middle East & Africa
      • By Test Type
      • By Product Type
      • By Technology Type
      • By End User
    • Market Attractiveness Analysis
      • By Country
      • By Test Type
      • By Product Type
      • By Technology Type
      • By End User
    • Key Takeaways
  18. Key Countries Market Analysis
    • USA
      • Pricing Analysis
      • Market Share Analysis, 2024
        • By Test Type
        • By Product Type
        • By Technology Type
        • By End User
    • Canada
      • Pricing Analysis
      • Market Share Analysis, 2024
        • By Test Type
        • By Product Type
        • By Technology Type
        • By End User
    • Mexico
      • Pricing Analysis
      • Market Share Analysis, 2024
        • By Test Type
        • By Product Type
        • By Technology Type
        • By End User
    • Brazil
      • Pricing Analysis
      • Market Share Analysis, 2024
        • By Test Type
        • By Product Type
        • By Technology Type
        • By End User
    • Chile
      • Pricing Analysis
      • Market Share Analysis, 2024
        • By Test Type
        • By Product Type
        • By Technology Type
        • By End User
    • Germany
      • Pricing Analysis
      • Market Share Analysis, 2024
        • By Test Type
        • By Product Type
        • By Technology Type
        • By End User
    • UK
      • Pricing Analysis
      • Market Share Analysis, 2024
        • By Test Type
        • By Product Type
        • By Technology Type
        • By End User
    • Italy
      • Pricing Analysis
      • Market Share Analysis, 2024
        • By Test Type
        • By Product Type
        • By Technology Type
        • By End User
    • Spain
      • Pricing Analysis
      • Market Share Analysis, 2024
        • By Test Type
        • By Product Type
        • By Technology Type
        • By End User
    • France
      • Pricing Analysis
      • Market Share Analysis, 2024
        • By Test Type
        • By Product Type
        • By Technology Type
        • By End User
    • India
      • Pricing Analysis
      • Market Share Analysis, 2024
        • By Test Type
        • By Product Type
        • By Technology Type
        • By End User
    • ASEAN
      • Pricing Analysis
      • Market Share Analysis, 2024
        • By Test Type
        • By Product Type
        • By Technology Type
        • By End User
    • Australia & New Zealand
      • Pricing Analysis
      • Market Share Analysis, 2024
        • By Test Type
        • By Product Type
        • By Technology Type
        • By End User
    • China
      • Pricing Analysis
      • Market Share Analysis, 2024
        • By Test Type
        • By Product Type
        • By Technology Type
        • By End User
    • Japan
      • Pricing Analysis
      • Market Share Analysis, 2024
        • By Test Type
        • By Product Type
        • By Technology Type
        • By End User
    • South Korea
      • Pricing Analysis
      • Market Share Analysis, 2024
        • By Test Type
        • By Product Type
        • By Technology Type
        • By End User
    • Russia
      • Pricing Analysis
      • Market Share Analysis, 2024
        • By Test Type
        • By Product Type
        • By Technology Type
        • By End User
    • Poland
      • Pricing Analysis
      • Market Share Analysis, 2024
        • By Test Type
        • By Product Type
        • By Technology Type
        • By End User
    • Hungary
      • Pricing Analysis
      • Market Share Analysis, 2024
        • By Test Type
        • By Product Type
        • By Technology Type
        • By End User
    • Kingdom of Saudi Arabia
      • Pricing Analysis
      • Market Share Analysis, 2024
        • By Test Type
        • By Product Type
        • By Technology Type
        • By End User
    • Turkiye
      • Pricing Analysis
      • Market Share Analysis, 2024
        • By Test Type
        • By Product Type
        • By Technology Type
        • By End User
    • South Africa
      • Pricing Analysis
      • Market Share Analysis, 2024
        • By Test Type
        • By Product Type
        • By Technology Type
        • By End User
  19. Market Structure Analysis
    • Competition Dashboard
    • Competition Benchmarking
    • Market Share Analysis of Top Players
      • By Regional
      • By Test Type
      • By Product Type
      • By Technology Type
      • By End User
  20. Competition Analysis
    • Competition Deep Dive
      • Roche
        • Overview
        • Product Portfolio
        • Profitability by Market Segments (Product/Age /Sales Channel/Region)
        • Sales Footprint
        • Strategy Overview
          • Marketing Strategy
          • Product Strategy
          • Channel Strategy
      • Abbott
      • SYSMEX
      • Siemens
      • Stago International
      • Universal Biosensors
      • Helena Laboratories
      • Accriva Diagnostics
      • CoaguSense
      • HomoSonics
      • iLine Microsystems
      • Instrumentation Laboratory
  21. Assumptions & Acronyms Used
  22. Research Methodology

List of Tables

  • Table 1: Global Market Value (USD Million) Forecast by Region, 2020-2035
  • Table 2: Global Market Value (USD Million) Forecast by Test Type , 2020-2035
  • Table 3: Global Market Value (USD Million) Forecast by Product Type, 2020-2035
  • Table 4: Global Market Value (USD Million) Forecast by Technology Type, 2020-2035
  • Table 5: Global Market Value (USD Million) Forecast by End User, 2020-2035
  • Table 6: North America Market Value (USD Million) Forecast by Country, 2020-2035
  • Table 7: North America Market Value (USD Million) Forecast by Test Type , 2020-2035
  • Table 8: North America Market Value (USD Million) Forecast by Product Type, 2020-2035
  • Table 9: North America Market Value (USD Million) Forecast by Technology Type, 2020-2035
  • Table 10: North America Market Value (USD Million) Forecast by End User, 2020-2035
  • Table 11: Latin America Market Value (USD Million) Forecast by Country, 2020-2035
  • Table 12: Latin America Market Value (USD Million) Forecast by Test Type , 2020-2035
  • Table 13: Latin America Market Value (USD Million) Forecast by Product Type, 2020-2035
  • Table 14: Latin America Market Value (USD Million) Forecast by Technology Type, 2020-2035
  • Table 15: Latin America Market Value (USD Million) Forecast by End User, 2020-2035
  • Table 16: Western Europe Market Value (USD Million) Forecast by Country, 2020-2035
  • Table 17: Western Europe Market Value (USD Million) Forecast by Test Type , 2020-2035
  • Table 18: Western Europe Market Value (USD Million) Forecast by Product Type, 2020-2035
  • Table 19: Western Europe Market Value (USD Million) Forecast by Technology Type, 2020-2035
  • Table 20: Western Europe Market Value (USD Million) Forecast by End User, 2020-2035
  • Table 21: Eastern Europe Market Value (USD Million) Forecast by Country, 2020-2035
  • Table 22: Eastern Europe Market Value (USD Million) Forecast by Test Type , 2020-2035
  • Table 23: Eastern Europe Market Value (USD Million) Forecast by Product Type, 2020-2035
  • Table 24: Eastern Europe Market Value (USD Million) Forecast by Technology Type, 2020-2035
  • Table 25: Eastern Europe Market Value (USD Million) Forecast by End User, 2020-2035
  • Table 26: East Asia Market Value (USD Million) Forecast by Country, 2020-2035
  • Table 27: East Asia Market Value (USD Million) Forecast by Test Type , 2020-2035
  • Table 28: East Asia Market Value (USD Million) Forecast by Product Type, 2020-2035
  • Table 29: East Asia Market Value (USD Million) Forecast by Technology Type, 2020-2035
  • Table 30: East Asia Market Value (USD Million) Forecast by End User, 2020-2035
  • Table 31: South Asia and Pacific Market Value (USD Million) Forecast by Country, 2020-2035
  • Table 32: South Asia and Pacific Market Value (USD Million) Forecast by Test Type , 2020-2035
  • Table 33: South Asia and Pacific Market Value (USD Million) Forecast by Product Type, 2020-2035
  • Table 34: South Asia and Pacific Market Value (USD Million) Forecast by Technology Type, 2020-2035
  • Table 35: South Asia and Pacific Market Value (USD Million) Forecast by End User, 2020-2035
  • Table 36: Middle East & Africa Market Value (USD Million) Forecast by Country, 2020-2035
  • Table 37: Middle East & Africa Market Value (USD Million) Forecast by Test Type , 2020-2035
  • Table 38: Middle East & Africa Market Value (USD Million) Forecast by Product Type, 2020-2035
  • Table 39: Middle East & Africa Market Value (USD Million) Forecast by Technology Type, 2020-2035
  • Table 40: Middle East & Africa Market Value (USD Million) Forecast by End User, 2020-2035

List of Figures

  • Figure 1: Global Market Pricing Analysis
  • Figure 2: Global Market Value (USD Million) Forecast 2020-2035
  • Figure 3: Global Market Value Share and BPS Analysis by Test Type , 2025 and 2035
  • Figure 4: Global Market Y-o-Y Growth Comparison by Test Type , 2025-2035
  • Figure 5: Global Market Attractiveness Analysis by Test Type
  • Figure 6: Global Market Value Share and BPS Analysis by Product Type, 2025 and 2035
  • Figure 7: Global Market Y-o-Y Growth Comparison by Product Type, 2025-2035
  • Figure 8: Global Market Attractiveness Analysis by Product Type
  • Figure 9: Global Market Value Share and BPS Analysis by Technology Type, 2025 and 2035
  • Figure 10: Global Market Y-o-Y Growth Comparison by Technology Type, 2025-2035
  • Figure 11: Global Market Attractiveness Analysis by Technology Type
  • Figure 12: Global Market Value Share and BPS Analysis by End User, 2025 and 2035
  • Figure 13: Global Market Y-o-Y Growth Comparison by End User, 2025-2035
  • Figure 14: Global Market Attractiveness Analysis by End User
  • Figure 15: Global Market Value (USD Million) Share and BPS Analysis by Region, 2025 and 2035
  • Figure 16: Global Market Y-o-Y Growth Comparison by Region, 2025-2035
  • Figure 17: Global Market Attractiveness Analysis by Region
  • Figure 18: North America Market Incremental Dollar Opportunity, 2025-2035
  • Figure 19: Latin America Market Incremental Dollar Opportunity, 2025-2035
  • Figure 20: Western Europe Market Incremental Dollar Opportunity, 2025-2035
  • Figure 21: Eastern Europe Market Incremental Dollar Opportunity, 2025-2035
  • Figure 22: East Asia Market Incremental Dollar Opportunity, 2025-2035
  • Figure 23: South Asia and Pacific Market Incremental Dollar Opportunity, 2025-2035
  • Figure 24: Middle East & Africa Market Incremental Dollar Opportunity, 2025-2035
  • Figure 25: North America Market Value Share and BPS Analysis by Country, 2025 and 2035
  • Figure 26: North America Market Value Share and BPS Analysis by Test Type , 2025 and 2035
  • Figure 27: North America Market Y-o-Y Growth Comparison by Test Type , 2025-2035
  • Figure 28: North America Market Attractiveness Analysis by Test Type
  • Figure 29: North America Market Value Share and BPS Analysis by Product Type, 2025 and 2035
  • Figure 30: North America Market Y-o-Y Growth Comparison by Product Type, 2025-2035
  • Figure 31: North America Market Attractiveness Analysis by Product Type
  • Figure 32: North America Market Value Share and BPS Analysis by Technology Type, 2025 and 2035
  • Figure 33: North America Market Y-o-Y Growth Comparison by Technology Type, 2025-2035
  • Figure 34: North America Market Attractiveness Analysis by Technology Type
  • Figure 35: North America Market Value Share and BPS Analysis by End User, 2025 and 2035
  • Figure 36: North America Market Y-o-Y Growth Comparison by End User, 2025-2035
  • Figure 37: North America Market Attractiveness Analysis by End User
  • Figure 38: Latin America Market Value Share and BPS Analysis by Country, 2025 and 2035
  • Figure 39: Latin America Market Value Share and BPS Analysis by Test Type , 2025 and 2035
  • Figure 40: Latin America Market Y-o-Y Growth Comparison by Test Type , 2025-2035
  • Figure 41: Latin America Market Attractiveness Analysis by Test Type
  • Figure 42: Latin America Market Value Share and BPS Analysis by Product Type, 2025 and 2035
  • Figure 43: Latin America Market Y-o-Y Growth Comparison by Product Type, 2025-2035
  • Figure 44: Latin America Market Attractiveness Analysis by Product Type
  • Figure 45: Latin America Market Value Share and BPS Analysis by Technology Type, 2025 and 2035
  • Figure 46: Latin America Market Y-o-Y Growth Comparison by Technology Type, 2025-2035
  • Figure 47: Latin America Market Attractiveness Analysis by Technology Type
  • Figure 48: Latin America Market Value Share and BPS Analysis by End User, 2025 and 2035
  • Figure 49: Latin America Market Y-o-Y Growth Comparison by End User, 2025-2035
  • Figure 50: Latin America Market Attractiveness Analysis by End User
  • Figure 51: Western Europe Market Value Share and BPS Analysis by Country, 2025 and 2035
  • Figure 52: Western Europe Market Value Share and BPS Analysis by Test Type , 2025 and 2035
  • Figure 53: Western Europe Market Y-o-Y Growth Comparison by Test Type , 2025-2035
  • Figure 54: Western Europe Market Attractiveness Analysis by Test Type
  • Figure 55: Western Europe Market Value Share and BPS Analysis by Product Type, 2025 and 2035
  • Figure 56: Western Europe Market Y-o-Y Growth Comparison by Product Type, 2025-2035
  • Figure 57: Western Europe Market Attractiveness Analysis by Product Type
  • Figure 58: Western Europe Market Value Share and BPS Analysis by Technology Type, 2025 and 2035
  • Figure 59: Western Europe Market Y-o-Y Growth Comparison by Technology Type, 2025-2035
  • Figure 60: Western Europe Market Attractiveness Analysis by Technology Type
  • Figure 61: Western Europe Market Value Share and BPS Analysis by End User, 2025 and 2035
  • Figure 62: Western Europe Market Y-o-Y Growth Comparison by End User, 2025-2035
  • Figure 63: Western Europe Market Attractiveness Analysis by End User
  • Figure 64: Eastern Europe Market Value Share and BPS Analysis by Country, 2025 and 2035
  • Figure 65: Eastern Europe Market Value Share and BPS Analysis by Test Type , 2025 and 2035
  • Figure 66: Eastern Europe Market Y-o-Y Growth Comparison by Test Type , 2025-2035
  • Figure 67: Eastern Europe Market Attractiveness Analysis by Test Type
  • Figure 68: Eastern Europe Market Value Share and BPS Analysis by Product Type, 2025 and 2035
  • Figure 69: Eastern Europe Market Y-o-Y Growth Comparison by Product Type, 2025-2035
  • Figure 70: Eastern Europe Market Attractiveness Analysis by Product Type
  • Figure 71: Eastern Europe Market Value Share and BPS Analysis by Technology Type, 2025 and 2035
  • Figure 72: Eastern Europe Market Y-o-Y Growth Comparison by Technology Type, 2025-2035
  • Figure 73: Eastern Europe Market Attractiveness Analysis by Technology Type
  • Figure 74: Eastern Europe Market Value Share and BPS Analysis by End User, 2025 and 2035
  • Figure 75: Eastern Europe Market Y-o-Y Growth Comparison by End User, 2025-2035
  • Figure 76: Eastern Europe Market Attractiveness Analysis by End User
  • Figure 77: East Asia Market Value Share and BPS Analysis by Country, 2025 and 2035
  • Figure 78: East Asia Market Value Share and BPS Analysis by Test Type , 2025 and 2035
  • Figure 79: East Asia Market Y-o-Y Growth Comparison by Test Type , 2025-2035
  • Figure 80: East Asia Market Attractiveness Analysis by Test Type
  • Figure 81: East Asia Market Value Share and BPS Analysis by Product Type, 2025 and 2035
  • Figure 82: East Asia Market Y-o-Y Growth Comparison by Product Type, 2025-2035
  • Figure 83: East Asia Market Attractiveness Analysis by Product Type
  • Figure 84: East Asia Market Value Share and BPS Analysis by Technology Type, 2025 and 2035
  • Figure 85: East Asia Market Y-o-Y Growth Comparison by Technology Type, 2025-2035
  • Figure 86: East Asia Market Attractiveness Analysis by Technology Type
  • Figure 87: East Asia Market Value Share and BPS Analysis by End User, 2025 and 2035
  • Figure 88: East Asia Market Y-o-Y Growth Comparison by End User, 2025-2035
  • Figure 89: East Asia Market Attractiveness Analysis by End User
  • Figure 90: South Asia and Pacific Market Value Share and BPS Analysis by Country, 2025 and 2035
  • Figure 91: South Asia and Pacific Market Value Share and BPS Analysis by Test Type , 2025 and 2035
  • Figure 92: South Asia and Pacific Market Y-o-Y Growth Comparison by Test Type , 2025-2035
  • Figure 93: South Asia and Pacific Market Attractiveness Analysis by Test Type
  • Figure 94: South Asia and Pacific Market Value Share and BPS Analysis by Product Type, 2025 and 2035
  • Figure 95: South Asia and Pacific Market Y-o-Y Growth Comparison by Product Type, 2025-2035
  • Figure 96: South Asia and Pacific Market Attractiveness Analysis by Product Type
  • Figure 97: South Asia and Pacific Market Value Share and BPS Analysis by Technology Type, 2025 and 2035
  • Figure 98: South Asia and Pacific Market Y-o-Y Growth Comparison by Technology Type, 2025-2035
  • Figure 99: South Asia and Pacific Market Attractiveness Analysis by Technology Type
  • Figure 100: South Asia and Pacific Market Value Share and BPS Analysis by End User, 2025 and 2035
  • Figure 101: South Asia and Pacific Market Y-o-Y Growth Comparison by End User, 2025-2035
  • Figure 102: South Asia and Pacific Market Attractiveness Analysis by End User
  • Figure 103: Middle East & Africa Market Value Share and BPS Analysis by Country, 2025 and 2035
  • Figure 104: Middle East & Africa Market Value Share and BPS Analysis by Test Type , 2025 and 2035
  • Figure 105: Middle East & Africa Market Y-o-Y Growth Comparison by Test Type , 2025-2035
  • Figure 106: Middle East & Africa Market Attractiveness Analysis by Test Type
  • Figure 107: Middle East & Africa Market Value Share and BPS Analysis by Product Type, 2025 and 2035
  • Figure 108: Middle East & Africa Market Y-o-Y Growth Comparison by Product Type, 2025-2035
  • Figure 109: Middle East & Africa Market Attractiveness Analysis by Product Type
  • Figure 110: Middle East & Africa Market Value Share and BPS Analysis by Technology Type, 2025 and 2035
  • Figure 111: Middle East & Africa Market Y-o-Y Growth Comparison by Technology Type, 2025-2035
  • Figure 112: Middle East & Africa Market Attractiveness Analysis by Technology Type
  • Figure 113: Middle East & Africa Market Value Share and BPS Analysis by End User, 2025 and 2035
  • Figure 114: Middle East & Africa Market Y-o-Y Growth Comparison by End User, 2025-2035
  • Figure 115: Middle East & Africa Market Attractiveness Analysis by End User
  • Figure 116: Global Market - Tier Structure Analysis
  • Figure 117: Global Market - Company Share Analysis
Dashboard
Dashboard
Dashboard
Dashboard
Dashboard
Dashboard

Full Research Suite comprises of:

Market outlook & trends analysis

Market outlook & trends analysis

Interviews & case studies

Interviews & case studies

Strategic recommendations

Strategic recommendations

Vendor profiles & capabilities analysis

Vendor profiles & capabilities analysis

5-year forecasts

5-year forecasts

8 regions and 60+ country-level data splits

8 regions and 60+ country-level data splits

Market segment data splits

Market segment data splits

12 months of continuous data updates

12 months of continuous data updates

DELIVERED AS:

PDF EXCEL ONLINE

Full Research Suite


$5000

$7500

$10000

Buy Report Now
Similar Industry Reports

Similar Industry Reports

Specialty Film Market

Specialty Film Market Size and Share Forecast Outlook 2025 to 2035

Special Sealant for Photovoltaic Modules Market

Special Sealant for Photovoltaic Modules Market Forecast and Outlook 2025 to 2035

Special-Purpose Analog-to-Digital Converters (ADCs) Market

Special-Purpose Analog-to-Digital Converters (ADCs) Market Forecast and Outlook 2025 to 2035

Specialty Silica Market

Specialty Silica Market Size and Share Forecast Outlook 2025 to 2035

Special Mission Aircraft Market

Special Mission Aircraft Market Size and Share Forecast Outlook 2025 to 2035

Specialty Food Ingredients Market

Specialty Food Ingredients Market Size and Share Forecast Outlook 2025 to 2035

Specialty Polymers Market

Specialty Polymers Market Size and Share Forecast Outlook 2025 to 2035

Specialty Commercial Deep Fryers Market

Specialty Commercial Deep Fryers Market Size and Share Forecast Outlook 2025 to 2035

Specialty Tapes Market

Specialty Tapes Market Size and Share Forecast Outlook 2025 to 2035

Specialty Fertilizers Market

Specialty Fertilizers Market Size and Share Forecast Outlook 2025 to 2035

Specialty Coatings Market

Specialty Coatings Market Size and Share Forecast Outlook 2025 to 2035

Specialty Transformer Market

Specialty Transformer Market Size and Share Forecast Outlook 2025 to 2035

Specialty Chemicals Market

Specialty Chemicals Market Size and Share Forecast Outlook 2025 to 2035

Specialty Nitriles Market

Specialty Nitriles Market Size and Share Forecast Outlook 2025 to 2035

Specialty Fuel Additives Market

Specialty Fuel Additives Market Size and Share Forecast Outlook 2025 to 2035

Specialty Cultures Market

Specialty Cultures Market Analysis - Size, Share and Forecast Outlook 2025 to 2035

Specialty Shortenings Market

Specialty Shortenings Market Size and Share Forecast Outlook 2025 to 2035

Specialty Labels Packaging Market

Specialty Labels Packaging Market Size and Share Forecast Outlook 2025 to 2035

Specialty Commercial Vehicle Market

Specialty Commercial Vehicle Market Size and Share Forecast Outlook 2025 to 2035

Specialty Carbon Black Market

Specialty Carbon Black Market Size and Share Forecast Outlook 2025 to 2035

Future Market Insights

Special Coagulation Tests Market

Chat With MaRIA

Chat With

MaRIA

Hi There, I am MaRIA, Your Market Research Intelligence Assistant. How may I help you?