Reports

- Global Locations -

Headquarters

Future Market Insights, Inc.

Christiana Corporate, 200
Continental Drive, Suite 401,
Newark, Delaware - 19713,
United States

T: +1-845-579-5705

Americas

Future Market Insights, Inc.

616 Corporate Way, Suite 2-9018,
Valley Cottage, NY 10989, United States

T: +1-347-918-3531

MEA

Future Market Insights

1602-6 Jumeirah Bay X2 Tower, Plot No: JLT-PH2-X2A,
Jumeirah Lakes Towers, Dubai,
United Arab Emirates

Europe

Future Market Insights

3rd Floor, 207 Regent Street,
W1B 3HH London
United Kingdom

T: + 44 (0) 20 8123 9659
D: +44 (0) 20 3287 4268

Asia Pacific

Future Market Insights

IndiaLand Global Tech Park, Unit UG-1, Behind Grand HighStreet, Phase 1, Hinjawadi, MH, Pune – 411057, India

Coronavirus Immunoassay Market Outlook (2022-2032)

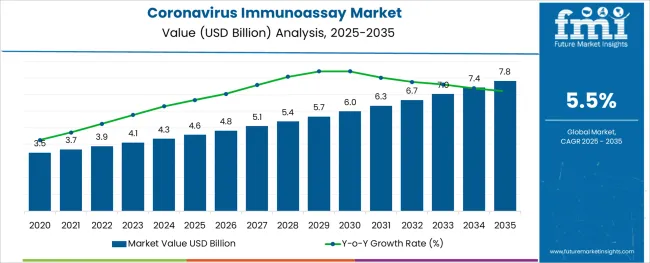
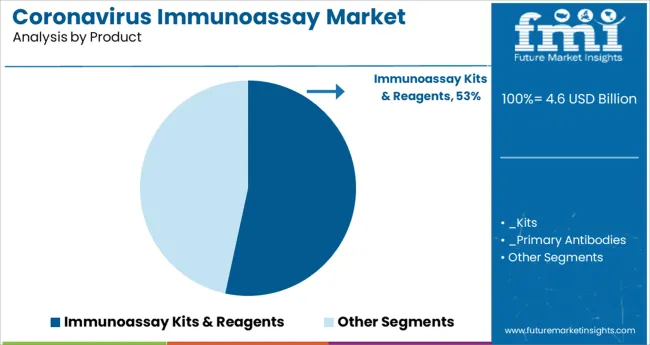
[536 Pages Report] The global coronavirus immunoassay market reached US$ 3.7 Billion in 2021. With sales growing at a 5.5% CAGR over the assessment period, the market size is projected to surpass US$ 6.9 Billion by 2032. Immunoassay kits & reagents are leading the market with a share of about 64.0% in the year 2021.

Data Points Market Insights
Coronavirus Immunoassay Market Base Year Value (2021) US$ 3.7 Billion
Projected Market Valuation (2032) US$ 6.9 Billion
Value-based CAGR (2022 to 2032) 5.5%
Market Share of Top 5 Countries 56.7%

The global economy has been significantly impacted as a result of business closures and severe travel restrictions caused by the COVID-19 epidemic. The widespread availability of precise and quick testing methodologies is critical for resolving the intricate dynamics of SARS-CoV-2 infection and immunity. Laboratories, universities, and businesses across the globe have been working actively to develop and manufacture vital test kits.

COVID-19 tests that are currently commercially accessible are divided into two groups. The first group includes molecular assays that use polymerase chain reaction (PCR) or nucleic acid hybridization-based techniques to identify SARS-CoV-2 viral RNA. The second group of assays includes serological and immunological tests that primarily rely on detecting antibodies produced by individuals because of virus exposure or on detecting antigenic proteins in infected individuals.

Don't pay for what you don't need

Customize your report by selecting specific countries or regions and save 30%!

Sales Analysis of Coronavirus Immunoassay Market from 2012 to 2021 Vs Market Outlook for 2022 to 2032

The market value for coronavirus immunoassays was approximately 13.2% of the US$ 28.1 Bn worth global immunoassay market in 2021.

Along with developments in diagnostic testing, researchers are aiming to manufacture different therapies that could be used to treat COVID-19 patients. The diagnosis procedures may be effective in the suppression of COVID-19, allowing for the quick implementation of preventative measures such as identifying and isolating infected individuals and identifying those who have been directly contacted by affected patients.

Biosensors can detect pathogens in a variety of contexts with excellent sensitivity and selectivity without the need for sample preparation. Furthermore, biosensor-based technologies are rapidly emerging as complementary platforms to PCR and ELISA for SARS-CoV-2 identification and quantitative detection.

Moreover, electrochemical biosensors are effective diagnostic instruments that have enabled pathogen detection in a variety of biological specimens without the need for sample preparation, as well as pathogen detection on surfaces and detection via wireless actuation.

The ability to make life-saving decisions on therapeutic measures and the isolation of COVID-19 infected individuals at the earliest possible stage is enhanced by rapid testing, which eventually inhibits the spread of infection.

Owing to the aforementioned factors, the global coronavirus immunoassay market is expected to grow at a CAGR of 5.5% during the forecast period.

Coronavirus Immunoassay Market

What are the Key Opportunities for the Coronavirus Immunoassay Manufacturers?

To control the severity of the COVID-19 pandemic, the WHO has urged countries around the world to ensure competent surveillance and identification of infected individuals. In such conditions, cutting-edge technologies such as the Internet of Medical Things (IoMT), UVs, GPS, robots, Bluetooth, and drones, can play a critical role in mitigating the impact of the COVID-19 outbreak.

IoT is a promising technology that consists of interconnected computing devices communicating information over a network without the need for human intervention. IoMT has recently attracted a lot of interest from the healthcare community. It is a collection of medical devices and software applications that are linked to healthcare information technology systems.

After the discovery of a vaccine or therapies, the most important issue in the current situation of the COVID-19 crisis is an efficient manner of reaching patients. The Internet of Things (IoT) is the best way to accomplish this.

Drones, robotic systems, and audio-visual technology can help reach contagious COVID-19 patients while requiring minimal human interaction. Wearables that employ Bluetooth and GPS technology are other effective approaches to track an individual's health and stress levels on a daily basis.

Overall, these technologies have the potential to play a significant role in the new tele-medicine framework, whether for disease prevention or identification and surveillance of the symptomatic, asymptomatic COVID-19 positives, masses, and paramedical staff, thus providing impetus to the growth in the market.

Sabyasachi Ghosh
Sabyasachi Ghosh

Principal Consultant

Talk to Analyst

Find your sweet spots for generating winning opportunities in this market.

Which Factors are Restraining the Demand for Coronavirus Immunoassay?

Antibody tests are a critical response to virus transmission and provide timely treatment for patients, but global supply constraints and high demand for PCR primers and positive controls have diagnostic companies scurrying to create them.

The inability of many countries and businesses to respond to the COVID-19 pandemic is due to their supply chain-the transport of goods such as masks, ventilators, consumables, and even services (e.g., visiting clinics).

Many countries are also concerned about the lack of personal protective equipment (PPE), which is necessary for frontline healthcare workers to tackle the disease.

In Italy, a lack of personal protective equipment is implicated in increasing rates of infection and death. Many researchers believe the U.S. requires far more respirators and surgical masks than are currently available. The supply chain's susceptibility can be associated with the negative effects of the shortages. These factors act as some of the key limitations in the global coronavirus immunoassay market.
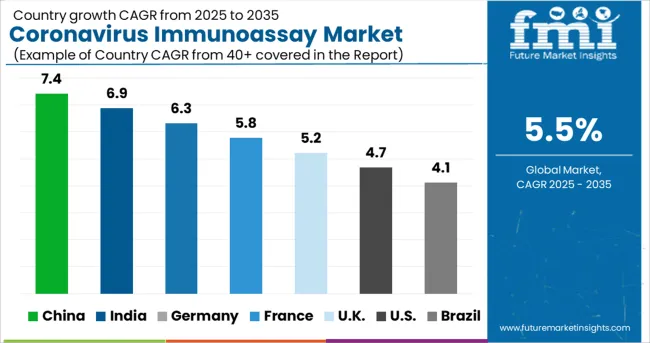
Country-wise Insights

What is Driving the U.S. Coronavirus Immunoassay Market?

“Increasing Demand for Vital Test Kits in the U.S. Will Boost Sales of Coronavirus Immunoassays”

The U.S. dominated the North America coronavirus immunoassay market, holding around 95.7% of the total market share in 2021.

Ongoing efforts within the country to communicate and facilitate the development of novel diagnostic assays and the worldwide delivery of test kits is expected to fuel sales in the market.

Several organisations are supporting these efforts by requesting assay developers to submit their test products for independent evaluation or by investing in collaborations to promote more accurate and faster diagnostic solutions.

As similar initiatives and knowledge sharing are attainable, including collaborative technological developments, demand for coronavirus immunoassays in the U.S. will increase at a considerable pace over the forecast period.

What is the Germany Coronavirus Immunoassay Market Outlook?

“Rising Adoption of Molecular Assays in Germany Will Fuel Growth”

Sales in the Germany market are forecast to increase at a 5.5% CAGR over the forecast period. The Health Security Committee (HSC) agreed on Recommendations for a common EU testing methodology for COVID-19 on September 17, 2020, laying out several activities that nations should consider when upgrading or adjusting their testing procedures.

Member States' first experiences with rapid antigen tests, as well as their discussions about the settings and conditions in which these tests should be performed, were incorporated in the Recommendations.

Since then, the HSC has been debating the use and application of rapid antigen testing in-depth, compiling a plethora of (technical) knowledge on the many types of tests used in Europe and the conditions under which they are employed. As a result of the increased prevalence of infection within the country, Germany will exhibit high demand for coronavirus immunoassays.

Get the data you need at a Fraction of the cost

Personalize your report by choosing insights you need
and save 40%!

Category-wise Insights

Which Coronavirus Immunoassay Product is Driving the Market?

“Sales of Kits and Reagents Will Continue Gaining Traction”

Based on product type, sales of immunoassay kits & reagents are expected to increase at a CAGR of 5.4% by the end of the forecast period, holding about 68.3% of the global market in 2032.

Owing to rapid detection of infectious pathogens, as well as the accuracy associated with the prompt detection, sales are expected to increase in this segment. Moreover, greater accessibility of these products across developed, as well as emerging economies have provided more opportunities for the expansion of the coronavirus immunoassay market.

Which is the Most Preferred Assay Type?

“Demand for LFA Immunoassays Will Increase Over the Forecast Period”

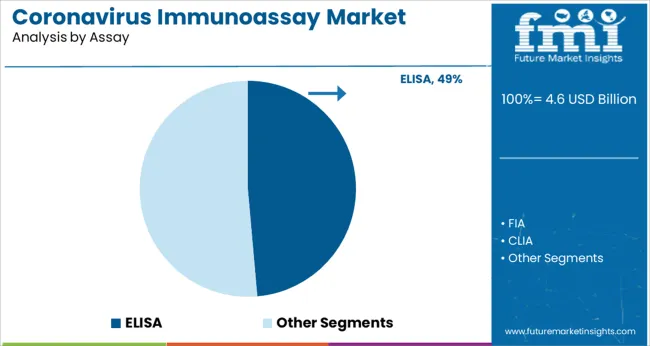
In terms of assay type, the LFA segment held 39.0% of the total market share in 2021, and is expected to account for 45.0% in 2032.  LFA is a one-step, cost-effective and rapid assay. They are critical in instances of point-of-care, and have a long shelf life, with no need for refrigeration. These factors allow a higher adoption of these assays, thus propelling the sales.

Which is the Leading Specimen Type?

“Nasopharynx Segment to Remain the Most Lucrative”

By specimen type, specimen collection through the nasopharynx held a dominant share value of around 38.9% in 2021. For the diagnosis of COVID-19 in adults and children, nasopharyngeal swabs are used to collect samples from the surface of the respiratory mucosa. Patients with suspected respiratory infections caused by other viruses or bacteria are frequently evaluated using this method.

For Which Application are Coronavirus Immunoassays Mostly Employed?

“Applications of Coronavirus Immunoassays for Clinical Diagnosis Will Gain Momentum”

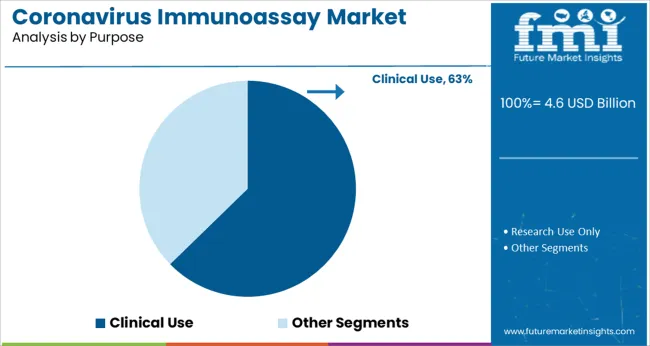
Total demand in the clinical diagnosis segment held around 66.4% of the total market share in 2021. With evolving dynamics in disease epidemiology, rising number of infectious cases, growing global burden of disease, and increasing efforts to enhance healthcare infrastructure, clinical diagnosis of disease will be necessary in assessing the impact of disease and its causative factors.

Which End User Benefits the Most With the Sales of Coronavirus Immunoassays?

“Adoption of Coronavirus Immunoassays in the Healthcare Sector Will Bolster”

The healthcare sector held around 94.4% of the total market share in 2021 and the trend is expected to continue over the assessment period. Collaborative efforts by manufacturers as well as policy makers in the design and development of rapid diagnostic tests, along with the available facilities to promote accessibility of these products globally, the healthcare industry owns a dominant stance in the coronavirus immunoassay market.
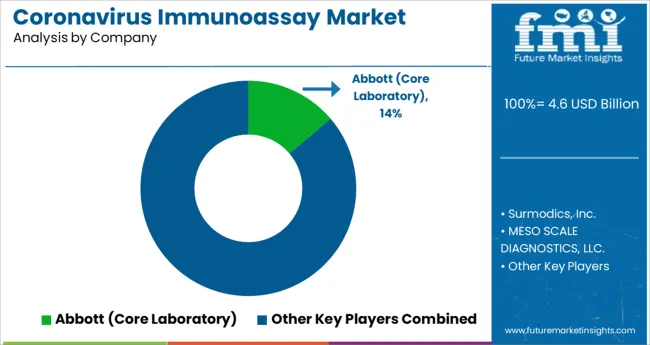
Competitive Landscape

To meet unmet patient demand, key companies are pursuing strategic initiatives in the field of immunoassays, spanning acquisitions and mergers, development of new products, and geographic coverage. Instances of key developmental strategies by the industry players in the coronavirus immunoassay market are given below:

  • In April 2020, Bio-Rad Laboratories launched its blood-based immunoassay kit for identification of antibodies for the coronavirus associated SARS-CoV-2 virus.
  • In June 2021, BioMérieux launched its “EPISEQ® SARS-COV-2” product, which is a genomic software solution to assist microbiology labs in identifying SARS-CoV-2 variants utilising samples from positive patients, as well as exploiting the enormous potential of diagnostic data to aid in the campaign against infectious diseases.

Report Scope as per Coronavirus Immunoassay Industry Analysis

Attributes Details
Base Yeas Market Size (2022) US$ 3.7 Billion
Projected Market Valuation (2032) US$ 6.9 Billion
Value-based CAGR (2032) 5.5%
Forecast Period 2012 to 2021
Historical Data Available for 2022 to 2032
Market Analysis US$ Million for Value
Key Regions Covered North America, Latin America, Europe, South Asia, East Asia, Oceania, and Middle East & Africa
Key Countries Covered The USA, Canada, Brazil, Mexico, Argentina, The UK, Germany, Italy, Russia, Spain, France, BENELUX, India, Thailand, Indonesia, Malaysia, Japan, China, South Korea, Australia, New Zealand, Turkey, GCC, and South Africa
Key Market Segments Covered Product, Assay, Purpose, Specimen, Application, End User, and Region
Key Companies Profiled
  • Surmodics, Inc.
  • MESO SCALE DIAGNOSTICS, LLC.
  • Abbott (Core Laboratory)
  • Siemens-healthineers (Siemens Medical Solutions USA, Inc)
  • PerkinElmer Inc.
  • BD Biosciences
  • ThermoFisher Scientific Inc.
  • Zoetis Inc.
  • Promega Corporation
  • F. Hoffmann- La Roche Ltd.
  • bioMérieux SA
  • Elabscience Biotechnology Inc.
  • Innovative Research, Inc.
  • QIAGEN N.V.
  • Merck KgaA
  • Bio-Rad Laboratories, Inc.
  • Creative Diagnostics
  • Cell Signaling Technology, Inc.
  • NEW HORIZONS DIAGNOSTIC CORPORATION
  • DiaSorin S.p.A.
  • H.U. Group Holdings Inc (Fujirebio Holdings, Inc.)
  • IDEXX Laboratories Inc.
  • Randox Laboratories Ltd.
  • Biopanda Reagents Ltd.
  • Shenzhen Bioeasy Biotechnology Co.,Ltd.
  • Quidel Corporation
  • Advnt Biotechnologies

Key Market Segments Covered in Coronavirus Immunoassay Industry Research

By Product:

  • Immunoassay Kits & Reagents
    • Kits
    • Primary Antibodies
    • Secondary antibodies
    • Immunoassay Substrates
    • Immunoassay Buffers
  • Analysers & Instrument
  • Consumables
  • Software

By Assay:

  • ELISA
  • FIA
  • CLIA
  • LFA
  • Others

By Purpose:

  • Research Use Only
  • Clinical Use

By Specimen:

  • Blood
  • Saliva
  • Nasopharynx
  • Cell Culture Samples

By Application:

  • Clinical Diagnostics
  • Drug Discovery
  • Screening of diseases & disorders

By End User:

  • Healthcare Industry
    • Human Use
    • Veterinary

By Region:

  • North America
  • Latin America
  • Europe
  • South Asia
  • East Asia
  • Oceania
  • Middle East and Africa (MEA)

Frequently Asked Questions

How much is the coronavirus immunoassay market worth in 2021?

The global coronavirus immunoassay market is worth US$ 3.7 Bn in 2021, and is set to expand ~1.9X over the next ten years.

What is the sales forecast for coronavirus immunoassay market through 2032?

The coronavirus immunoassay market is expected to reach US$ 6.9 Bn by the end of 2032, with sales revenue expected to register 5.5% CAGR.

What are the key trends shaping the coronavirus immunoassay industry?

Demand in industrial applications driving immunoassay market, and strategic acquisitions and partnerships are some of the key trends in this market.

Which are the top 5 countries driving demand for the coronavirus immunoassay market?

The U.S., China, Japan, Germany, and the U.K. are expected to drive demand for the coronavirus immunoassay industry.

What is the North American regional outlook for the coronavirus immunoassay market?

North America is one of the key markets for coronavirus immunoassay, with the U.S. accounting for about 95.7% of the North American coronavirus immunoassay market in the year 2021.

At what percentage is the demand for coronavirus immunoassay market expected to register growth in Europe?

Demand for coronavirus immunoassay in Europe is expected to register a growth of 4.5% over the next ten years.

Which countries are the key producers in the coronavirus immunoassay market?

The U.S., China, and Japan are the key producers in the coronavirus immunoassay market space.

Who are the key players in the coronavirus immunoassay market sphere?

Surmodics, Inc., MESO SCALE DIAGNOSTICS, LLC., Abbott (Core Laboratory), Siemens-healthineers (Siemens Medical Solutions USA, Inc), PerkinElmer Inc., BD Biosciences, ThermoFisher Scientific Inc., Zoetis Inc., Promega Corporation, F. Hoffmann- La Roche Ltd., bioMérieux SA, Elabscience Biotechnology Inc., Innovative Research, Inc., QIAGEN N.V., Merck KgaA, Bio-Rad Laboratories, Inc., Creative Diagnostics, Cell Signaling Technology, Inc., NEW HORIZONS DIAGNOSTIC CORPORATION, DiaSorin S.p.A., H.U. G

Table of Content

1. Executive Summary

    1.1. Global Market Outlook

    1.2. Demand Side Trends

    1.3. Supply Side Trends

    1.4. Analysis and Recommendations

2. Market Overview

    2.1. Market Coverage / Taxonomy

    2.2. Market Definition / Scope / Limitations

    2.3. Inclusions & Exclusions

3. Key Market Trends

    3.1. Key Trends Impacting the Market

    3.2. Product Innovation / Development Trends

4. Key Success Factors

    4.1. Disease Epidemiology 

    4.2. Key Strategies, by Market Players

    4.3. Technological Advancements

    4.4. New Product launches & Approvals

    4.5. Regulatory landscape

    4.6. Reimbursement Scenario

    4.7. Value Chain Analysis

    4.8. Product Adoption Analysis

    4.9. PESTLE Analysis

    4.10. Porter’s Analysis

5. Market Background

    5.1. Macro-Economic Factors

        5.1.1. Global GDP Growth Outlook

        5.1.2. Global Healthcare Spending Outlook

        5.1.3. Global Healthcare Expenditure Market Outlook

    5.2. Forecast Factors - Relevance & Impact

        5.2.1. New/Improved Product Launches

        5.2.2. Growing prevalence of Chronic and infectious disease

        5.2.3. Growing research and development funding

        5.2.4. Demand for clinical diagnosis

        5.2.5. Growing adoption of immunoassay based point-of-care diagnostics

        5.2.6. Increase in research institutes and its activities

        5.2.7. Global manufacturers focusing on Emerging Markets

    5.3. Market Dynamics

        5.3.1. Drivers

        5.3.2. Restraints

        5.3.3. Opportunity Analysis

6. COVID-19 Crisis Analysis

    6.1. COVID-19 Impact Analysis

        6.1.1. Revenue by Product

        6.1.2. Revenue by Assay

        6.1.3. Revenue by Purpose

        6.1.4. Revenue by Specimen

        6.1.5. Revenue by Application

        6.1.6. Revenue by End-User

        6.1.7. Revenue by Region

    6.2. 2021 Market Scenario

7. Global Coronavirus Immunoassay Market Demand (in Value or Size in US$ Bn) Analysis 2012-2021 and Forecast, 2022–2032

    7.1. Historical Market Value (US$ Bn) Analysis, 2012-2021

    7.2. Current and Future Market Value (US$ Bn) Projections, 2022–2032

        7.2.1. Y-o-Y Growth Trend Analysis

        7.2.2. Absolute $ Opportunity Analysis

8. Global Coronavirus Immunoassay Market Analysis 2012-2021 and Forecast 2022–2032, by Product 

    8.1. Introduction / Key Findings

    8.2. Historical Market Size (US$ Bn) Analysis By Product, 2012-2021

    8.3. Current and Future Market Size (US$ Bn) Analysis and Forecast By Product, 2022–2032

        8.3.1. Immunoassay Kits & Reagents

            8.3.1.1. Kits

            8.3.1.2. Primary Antibodies

            8.3.1.3. Secondary antibodies

            8.3.1.4. Immunoassay Substrates

            8.3.1.5. Immunoassay Buffers

        8.3.2. Analyzers & Instrument

        8.3.3. Consumables

        8.3.4. Software

    8.4. Market Attractiveness Analysis By Product 

9. Global Coronavirus Immunoassay Market Analysis 2012-2021 and Forecast 2022–2032, by Assay

    9.1. Introduction / Key Findings

    9.2. Historical Market Size (US$ Bn) Analysis By Assay, 2012-2021

    9.3. Current and Future Market Size (US$ Bn) Analysis and Forecast By Assay, 2022–2032

        9.3.1. Enzyme immunoassay (EIA) or Enzyme linked immunosorbent assay ( ELISA)

        9.3.2. Fluroimmunoassay (FIA)

        9.3.3. Chemiluminiscent Immunoassay (CLIA)

        9.3.4. Lateral Flow Assay (LFA)

        9.3.5. Others

    9.4. Market Attractiveness Analysis By Assay

10. Global Coronavirus Immunoassay Market Analysis 2012-2021 and Forecast 2022–2032, by Purpose

    10.1. Introduction / Key Findings

    10.2. Historical Market Size (US$ Bn) Analysis By Purpose, 2012-2021

    10.3. Current and Future Market Size (US$ Bn) Analysis and Forecast By Purpose, 2022–2032

        10.3.1. Research use only

        10.3.2. Clinical use

    10.4. Market Attractiveness Analysis By Purpose

11. Global Coronavirus Immunoassay Market Analysis 2012-2021 and Forecast 2022–2032, by Specimen

    11.1. Introduction / Key Findings

    11.2. Historical Market Size (US$ Bn) Analysis By Specimen, 2012-2021

    11.3. Current and Future Market Size (US$ Bn) Analysis and Forecast By Specimen, 2022–2032

        11.3.1. Blood

        11.3.2. Saliva

        11.3.3. Nasopharynx

        11.3.4. Cell culture samples

    11.4. Market Attractiveness Analysis By Specimen

12. Global Coronavirus Immunoassay Market Analysis 2012-2021 and Forecast 2022–2032, by Application

    12.1. Introduction / Key Findings

    12.2. Historical Market Size (US$ Bn) Analysis By Application, 2012-2021

    12.3. Current and Future Market Size (US$ Bn) Analysis and Forecast By Application, 2022–2032

        12.3.1. Clinical diagnostics

        12.3.2. Drug discovery

        12.3.3. Screening of diseases and disorders

    12.4. Market Attractiveness Analysis By Application

13. Global Coronavirus Immunoassay Market Analysis 2012-2021 and Forecast 2022–2032, by End User

    13.1. Introduction / Key Findings

    13.2. Historical Market Size (US$ Bn) Analysis By End User, 2012-2021

    13.3. Current and Future Market Size (US$ Bn) Analysis and Forecast By End User, 2022–2032

        13.3.1. Healthcare Industry

            13.3.1.1. Human Use

            13.3.1.2. Veterinary

    13.4. Market Attractiveness Analysis By End User

14. Global Coronavirus Immunoassay Market Analysis 2012-2021 and Forecast 2022–2032, by Region

    14.1. Introduction

    14.2. Historical Market Size (US$ Bn) Analysis, By Region, 2012-2021

    14.3. Current and Future Market Size (US$ Bn) Analysis and Forecast By Region, 2022–2032

        14.3.1. North America

        14.3.2. Latin America

        14.3.3. Europe

        14.3.4. East Asia

        14.3.5. South Asia 

        14.3.6. Oceania

        14.3.7. Middle East and Africa (MEA)

    14.4. Market Attractiveness Analysis By Region

15. North America Coronavirus Immunoassay Market Analysis 2012-2021 and Forecast 2022–2032

    15.1. Introduction

    15.2. Historical Market Size (US$ Bn) Trend Analysis By Market Taxonomy, 2012-2021

    15.3. Current and Future Market Size (US$ Bn) Analysis and Forecast By Market Taxonomy, 2022–2032

        15.3.1. By Country

            15.3.1.1. U.S.

            15.3.1.2. Canada

        15.3.2. By Product

        15.3.3. By Assay

        15.3.4. By Purpose

        15.3.5. By Specimen

        15.3.6. By Application

        15.3.7. By End User

    15.4. Market Attractiveness Analysis

        15.4.1. By Country

        15.4.2. By Product

        15.4.3. By Assay

        15.4.4. By Purpose

        15.4.5. By Specimen

        15.4.6. By Application

        15.4.7. By End User

    15.5. Market Trends

    15.6. Drivers and Restraints - Impact Analysis

    15.7. Country Level Analysis & Forecast

        15.7.1. U.S. Coronavirus Immunoassay Market 

            15.7.1.1. Introduction

            15.7.1.2. Market Analysis and Forecast by Market Taxonomy

                15.7.1.2.1. By Product

                15.7.1.2.2. By Assay

                15.7.1.2.3. By Purpose

                15.7.1.2.4. By Specimen

                15.7.1.2.5. By Application

                15.7.1.2.6. By End User

        15.7.2. Canada Coronavirus Immunoassay Market 

            15.7.2.1. Introduction

            15.7.2.2. Market Analysis and Forecast by Market Taxonomy

                15.7.2.2.1. By Product

                15.7.2.2.2. By Assay

                15.7.2.2.3. By Purpose

                15.7.2.2.4. By Specimen

                15.7.2.2.5. By Application

                15.7.2.2.6. By End User

16. Latin America Coronavirus Immunoassay Market Analysis 2012-2021 and Forecast 2022–2032

    16.1. Introduction

    16.2. Historical Market Size (US$ Bn) Trend Analysis By Market Taxonomy, 2012-2021

    16.3. Current and Future Market Size (US$ Bn) Analysis and Forecast By Market Taxonomy, 2022–2032

        16.3.1. By Country

            16.3.1.1. Brazil

            16.3.1.2. Mexico

            16.3.1.3. Argentina

            16.3.1.4. Rest of Latin America

        16.3.2. By Product

        16.3.3. By Assay

        16.3.4. By Purpose

        16.3.5. By Specimen

        16.3.6. By Application

        16.3.7. By End User

    16.4. Market Attractiveness Analysis

        16.4.1. By Country

        16.4.2. By Product

        16.4.3. By Assay

        16.4.4. By Purpose

        16.4.5. By Specimen

        16.4.6. By Application

        16.4.7. By End User

    16.5. Market Trends

    16.6. Drivers and Restraints - Impact Analysis

    16.7. Country Level Analysis & Forecast

        16.7.1. Brazil Coronavirus Immunoassay Market 

            16.7.1.1. Introduction

            16.7.1.2. Market Analysis and Forecast by Market Taxonomy

                16.7.1.2.1. By Product

                16.7.1.2.2. By Assay

                16.7.1.2.3. By Purpose

                16.7.1.2.4. By Specimen

                16.7.1.2.5. By Application

                16.7.1.2.6. By End User

        16.7.2. Argentina Coronavirus Immunoassay Market

            16.7.2.1. Introduction

            16.7.2.2. Market Analysis and Forecast by Market Taxonomy

                16.7.2.2.1. By Product

                16.7.2.2.2. By Assay

                16.7.2.2.3. By Purpose

                16.7.2.2.4. By Specimen

                16.7.2.2.5. By Application

                16.7.2.2.6. By End User

        16.7.3. Mexico Coronavirus Immunoassay Market 

            16.7.3.1. Introduction

            16.7.3.2. Market Analysis and Forecast by Market Taxonomy

                16.7.3.2.1. By Product

                16.7.3.2.2. By Assay

                16.7.3.2.3. By Purpose

                16.7.3.2.4. By Specimen

                16.7.3.2.5. By Application

                16.7.3.2.6. By End User

17. Europe Coronavirus Immunoassay Market Analysis 2012-2021 and Forecast 2022–2032

    17.1. Introduction

    17.2. Historical Market Size (US$ Bn) Trend Analysis By Market Taxonomy, 2012-2021

    17.3. Current and Future Market Size (US$ Bn) Analysis and Forecast By Market Taxonomy, 2022–2032

        17.3.1. By Country

            17.3.1.1. U.K.

            17.3.1.2. Germany

            17.3.1.3. Italy

            17.3.1.4. France

            17.3.1.5. Spain

            17.3.1.6. Russia

            17.3.1.7. Nordic Countries 

            17.3.1.8. BENELUX

            17.3.1.9. Rest of Europe

        17.3.2. By Product

        17.3.3. By Assay

        17.3.4. By Purpose

        17.3.5. By Specimen

        17.3.6. By Application

        17.3.7. By End User

    17.4. Market Attractiveness Analysis

        17.4.1. By Country

        17.4.2. By Product

        17.4.3. By Assay

        17.4.4. By Purpose

        17.4.5. By Specimen

        17.4.6. By Application

        17.4.7. By End User

    17.5. Market Trends

    17.6. Drivers and Restraints - Impact Analysis

    17.7. Country Level Analysis & Forecast

        17.7.1. U.K. Coronavirus Immunoassay Market 

            17.7.1.1. Introduction

            17.7.1.2. Market Analysis and Forecast by Market Taxonomy

                17.7.1.2.1. By Product

                17.7.1.2.2. By Assay

                17.7.1.2.3. By Purpose

                17.7.1.2.4. By Specimen

                17.7.1.2.5. By Application

                17.7.1.2.6. By End User

        17.7.2. Germany Coronavirus Immunoassay Market 

            17.7.2.1. Introduction

            17.7.2.2. Market Analysis and Forecast by Market Taxonomy

                17.7.2.2.1. By Product

                17.7.2.2.2. By Assay

                17.7.2.2.3. By Purpose

                17.7.2.2.4. By Specimen

                17.7.2.2.5. By Application

                17.7.2.2.6. By End User

        17.7.3. Italy Coronavirus Immunoassay Market 

            17.7.3.1. Introduction

            17.7.3.2. Market Analysis and Forecast by Market Taxonomy

                17.7.3.2.1. By Product

                17.7.3.2.2. By Assay

                17.7.3.2.3. By Purpose

                17.7.3.2.4. By Specimen

                17.7.3.2.5. By Application

                17.7.3.2.6. By End User

        17.7.4. France Coronavirus Immunoassay Market 

            17.7.4.1. Introduction

            17.7.4.2. Market Analysis and Forecast by Market Taxonomy

                17.7.4.2.1. By Product

                17.7.4.2.2. By Assay

                17.7.4.2.3. By Purpose

                17.7.4.2.4. By Specimen

                17.7.4.2.5. By Application

                17.7.4.2.6. By End User

        17.7.5. Spain Coronavirus Immunoassay Market 

            17.7.5.1. Introduction

            17.7.5.2. Market Analysis and Forecast by Market Taxonomy

                17.7.5.2.1. By Product

                17.7.5.2.2. By Assay

                17.7.5.2.3. By Purpose

                17.7.5.2.4. By Specimen

                17.7.5.2.5. By Application

                17.7.5.2.6. By End User

        17.7.6. Russia Coronavirus Immunoassay Market 

            17.7.6.1. Introduction

            17.7.6.2. Market Analysis and Forecast by Market Taxonomy

                17.7.6.2.1. By Product

                17.7.6.2.2. By Assay

                17.7.6.2.3. By Purpose

                17.7.6.2.4. By Specimen

                17.7.6.2.5. By Application

                17.7.6.2.6. By End User

        17.7.7. Nordic Countries Coronavirus Immunoassay Market 

            17.7.7.1. Introduction

            17.7.7.2. Market Analysis and Forecast by Market Taxonomy

                17.7.7.2.1. By Product

                17.7.7.2.2. By Assay

                17.7.7.2.3. By Purpose

                17.7.7.2.4. By Specimen

                17.7.7.2.5. By Application

                17.7.7.2.6. By End User

        17.7.8. BENELUX Coronavirus Immunoassay Market 

            17.7.8.1. Introduction

            17.7.8.2. Market Analysis and Forecast by Market Taxonomy

                17.7.8.2.1. By Product

                17.7.8.2.2. By Assay

                17.7.8.2.3. By Purpose

                17.7.8.2.4. By Specimen

                17.7.8.2.5. By Application

                17.7.8.2.6. By End User

18. South Asia Coronavirus Immunoassay Market Analysis 2012-2021 and Forecast 2022–2032

    18.1. Introduction

    18.2. Historical Market Size (US$ Bn) Trend Analysis By Market Taxonomy, 2012-2021

    18.3. Current and Future Market Size (US$ Bn) Analysis and Forecast By Market Taxonomy, 2022–2032

        18.3.1. By Country

            18.3.1.1. India

            18.3.1.2. Thailand

            18.3.1.3. Indonesia

            18.3.1.4. Malaysia

            18.3.1.5. Philippines

            18.3.1.6. Vietnam

            18.3.1.7. Rest of South Asia 

        18.3.2. By Product

        18.3.3. By Assay

        18.3.4. By Purpose

        18.3.5. By Specimen

        18.3.6. By Application

        18.3.7. By End User

    18.4. Market Attractiveness Analysis

        18.4.1. By Country

        18.4.2. By Product

        18.4.3. By Assay

        18.4.4. By Purpose

        18.4.5. By Specimen

        18.4.6. By Application

        18.4.7. By End User

    18.5. Market Trends

    18.6. Drivers and Restraints - Impact Analysis

    18.7. Country Level Analysis & Forecast

        18.7.1. India Coronavirus Immunoassay Market 

            18.7.1.1. Introduction

            18.7.1.2. Market Analysis and Forecast by Market Taxonomy

                18.7.1.2.1. By Product

                18.7.1.2.2. By Assay

                18.7.1.2.3. By Purpose

                18.7.1.2.4. By Specimen

                18.7.1.2.5. By Application

                18.7.1.2.6. By End User

        18.7.2. Thailand Coronavirus Immunoassay Market 

            18.7.2.1. Introduction

            18.7.2.2. Market Analysis and Forecast by Market Taxonomy

                18.7.2.2.1. By Product

                18.7.2.2.2. By Assay

                18.7.2.2.3. By Purpose

                18.7.2.2.4. By Specimen

                18.7.2.2.5. By Application

                18.7.2.2.6. By End User

        18.7.3. Indonesia Coronavirus Immunoassay Market 

            18.7.3.1. Introduction

            18.7.3.2. Market Analysis and Forecast by Market Taxonomy

                18.7.3.2.1. By Product

                18.7.3.2.2. By Assay

                18.7.3.2.3. By Purpose

                18.7.3.2.4. By Specimen

                18.7.3.2.5. By Application

                18.7.3.2.6. By End User

        18.7.4. Malaysia Coronavirus Immunoassay Market 

            18.7.4.1. Introduction

            18.7.4.2. Market Analysis and Forecast by Market Taxonomy

                18.7.4.2.1. By Product

                18.7.4.2.2. By Assay

                18.7.4.2.3. By Purpose

                18.7.4.2.4. By Specimen

                18.7.4.2.5. By Application

                18.7.4.2.6. By End User

        18.7.5. Philippines Coronavirus Immunoassay Market 

            18.7.5.1. Introduction

            18.7.5.2. Market Analysis and Forecast by Market Taxonomy

                18.7.5.2.1. By Product

                18.7.5.2.2. By Assay

                18.7.5.2.3. By Purpose

                18.7.5.2.4. By Specimen

                18.7.5.2.5. By Application

                18.7.5.2.6. By End User

        18.7.6. Vietnam Coronavirus Immunoassay Market 

            18.7.6.1. Introduction

            18.7.6.2. Market Analysis and Forecast by Market Taxonomy

                18.7.6.2.1. By Product

                18.7.6.2.2. By Assay

                18.7.6.2.3. By Purpose

                18.7.6.2.4. By Specimen

                18.7.6.2.5. By Application

                18.7.6.2.6. By End User

19. East Asia Coronavirus Immunoassay Market Analysis 2012-2021 and Forecast 2022–2032

    19.1. Introduction

    19.2. Historical Market Size (US$ Bn) Trend Analysis By Market Taxonomy, 2012-2021

    19.3. Current and Future Market Size (US$ Bn) Analysis and Forecast By Market Taxonomy, 2022–2032

        19.3.1. By Country

            19.3.1.1. China

            19.3.1.2. Japan

            19.3.1.3. South Korea

        19.3.2. By Product

        19.3.3. By Assay

        19.3.4. By Purpose

        19.3.5. By Specimen

        19.3.6. By Application

        19.3.7. By End User

    19.4. Market Attractiveness Analysis

        19.4.1. By Country

        19.4.2. By Product

        19.4.3. By Assay

        19.4.4. By Purpose

        19.4.5. By Specimen

        19.4.6. By Application

        19.4.7. By End User

    19.5. Market Trends

    19.6. Drivers and Restraints - Impact Analysis

    19.7. Country Level Analysis & Forecast

        19.7.1. China Coronavirus Immunoassay Market 

            19.7.1.1. Introduction

            19.7.1.2. Market Analysis and Forecast by Market Taxonomy

                19.7.1.2.1. By Product

                19.7.1.2.2. By Assay

                19.7.1.2.3. By Purpose

                19.7.1.2.4. By Specimen

                19.7.1.2.5. By Application

                19.7.1.2.6. By End User

        19.7.2. Japan Coronavirus Immunoassay Market 

            19.7.2.1. Introduction

            19.7.2.2. Market Analysis and Forecast by Market Taxonomy

                19.7.2.2.1. By Product

                19.7.2.2.2. By Assay

                19.7.2.2.3. By Purpose

                19.7.2.2.4. By Specimen

                19.7.2.2.5. By Application

                19.7.2.2.6. By End User

        19.7.3. South Korea Coronavirus Immunoassay Market 

            19.7.3.1. Introduction

            19.7.3.2. Market Analysis and Forecast by Market Taxonomy

                19.7.3.2.1. By Product

                19.7.3.2.2. By Assay

                19.7.3.2.3. By Purpose

                19.7.3.2.4. By Specimen

                19.7.3.2.5. By Application

                19.7.3.2.6. By End User

20. Oceania Coronavirus Immunoassay Market Analysis 2012-2021 and Forecast 2022–2032

    20.1. Introduction

    20.2. Historical Market Size (US$ Bn) Trend Analysis By Market Taxonomy, 2012-2021

    20.3. Current and Future Market Size (US$ Bn) Analysis and Forecast By Market Taxonomy, 2022–2032

        20.3.1. By Country

            20.3.1.1. Australia

            20.3.1.2. New Zealand

        20.3.2. By Product

        20.3.3. By Assay

        20.3.4. By Purpose

        20.3.5. By Specimen

        20.3.6. By Application

        20.3.7. By End User

    20.4. Market Attractiveness Analysis

        20.4.1. By Country

        20.4.2. By Product

        20.4.3. By Assay

        20.4.4. By Purpose

        20.4.5. By Specimen

        20.4.6. By Application

        20.4.7. By End User

    20.5. Market Trends

    20.6. Drivers and Restraints - Impact Analysis

    20.7. Country Level Analysis & Forecast

        20.7.1. Australia Coronavirus Immunoassay Market 

            20.7.1.1. Introduction

            20.7.1.2. Market Analysis and Forecast by Market Taxonomy

                20.7.1.2.1. By Product

                20.7.1.2.2. By Assay

                20.7.1.2.3. By Purpose

                20.7.1.2.4. By Specimen

                20.7.1.2.5. By Application

                20.7.1.2.6. By End User

        20.7.2. New Zealand Coronavirus Immunoassay Market 

            20.7.2.1. Introduction

            20.7.2.2. Market Analysis and Forecast by Market Taxonomy

                20.7.2.2.1. By Product

                20.7.2.2.2. By Assay

                20.7.2.2.3. By Purpose

                20.7.2.2.4. By Specimen

                20.7.2.2.5. By Application

                20.7.2.2.6. By End User

21. Middle East and Africa (MEA) Coronavirus Immunoassay Market Analysis 2012-2021 and Forecast 2022–2032

    21.1. Introduction

    21.2. Historical Market Size (US$ Bn) Trend Analysis By Market Taxonomy, 2012-2021

    21.3. Current and Future Market Size (US$ Bn) Analysis and Forecast By Market Taxonomy, 2022–2032

        21.3.1. By Country

            21.3.1.1. Turkey

            21.3.1.2. Egypt

            21.3.1.3. GCC Countries

            21.3.1.4. North Africa

            21.3.1.5. South Africa

            21.3.1.6. Rest of Middle East and Africa

        21.3.2. By Product

        21.3.3. By Assay

        21.3.4. By Purpose

        21.3.5. By Specimen

        21.3.6. By Application

        21.3.7. By End User

    21.4. Market Attractiveness Analysis

        21.4.1. By Country

        21.4.2. By Product

        21.4.3. By Assay

        21.4.4. By Purpose

        21.4.5. By Specimen

        21.4.6. By Application

        21.4.7. By End User

    21.5. Market Trends

    21.6. Drivers and Restraints - Impact Analysis

    21.7. Country Level Analysis & Forecast

        21.7.1. Turkey Coronavirus Immunoassay Market 

            21.7.1.1. Introduction

            21.7.1.2. Market Analysis and Forecast by Market Taxonomy

                21.7.1.2.1. By Product

                21.7.1.2.2. By Assay

                21.7.1.2.3. By Purpose

                21.7.1.2.4. By Specimen

                21.7.1.2.5. By Application

                21.7.1.2.6. By End User

        21.7.2. Egypt Coronavirus Immunoassay Market 

            21.7.2.1. Introduction

            21.7.2.2. Market Analysis and Forecast by Market Taxonomy

                21.7.2.2.1. By Product

                21.7.2.2.2. By Assay

                21.7.2.2.3. By Purpose

                21.7.2.2.4. By Specimen

                21.7.2.2.5. By Application

                21.7.2.2.6. By End User

        21.7.3. GCC Countries Coronavirus Immunoassay Market 

            21.7.3.1. Introduction

            21.7.3.2. Market Analysis and Forecast by Market Taxonomy

                21.7.3.2.1. By Product

                21.7.3.2.2. By Assay

                21.7.3.2.3. By Purpose

                21.7.3.2.4. By Specimen

                21.7.3.2.5. By Application

                21.7.3.2.6. By End User

        21.7.4. North Africa Coronavirus Immunoassay Market 

            21.7.4.1. Introduction

            21.7.4.2. Market Analysis and Forecast by Market Taxonomy

                21.7.4.2.1. By Product

                21.7.4.2.2. By Assay

                21.7.4.2.3. By Purpose

                21.7.4.2.4. By Specimen

                21.7.4.2.5. By Application

                21.7.4.2.6. By End User

        21.7.5. South Africa Coronavirus Immunoassay Market 

            21.7.5.1. Introduction

            21.7.5.2. Market Analysis and Forecast by Market Taxonomy

                21.7.5.2.1. By Product

                21.7.5.2.2. By Assay

                21.7.5.2.3. By Purpose

                21.7.5.2.4. By Specimen

                21.7.5.2.5. By Application

                21.7.5.2.6. By End User

22. Market Structure Analysis

    22.1. Market Analysis by Tier of Companies 

    22.2. Market Share Analysis of Top Players

    22.3. Market Presence Analysis

23. Competition Analysis

    23.1. Competition Benchmarking

    12.1.A. Competition Dashboard

    23.2. Key Development Analysis

    23.3. Competition Deep Dive

        23.3.1. Surmodics, Inc.

            23.3.1.1. Overview

            23.3.1.2. Product Portfolio

            23.3.1.3. Key Financials

            23.3.1.4. SWOT Analysis

            23.3.1.5. Sales Footprint

            23.3.1.6. Strategy Overview

                23.3.1.6.1. Marketing Strategy

                23.3.1.6.2. Product Strategy

                23.3.1.6.3. Channel Strategy

        23.3.2. MESO SCALE DIAGNOSTICS, LLC.

            23.3.2.1. Overview

            23.3.2.2. Product Portfolio

            23.3.2.3. Key Financials

            23.3.2.4. SWOT Analysis

            23.3.2.5. Sales Footprint

            23.3.2.6. Strategy Overview

                23.3.2.6.1. Marketing Strategy

                23.3.2.6.2. Product Strategy

                23.3.2.6.3. Channel Strategy

        23.3.3. Abbott (Core Laboratory)

            23.3.3.1. Overview

            23.3.3.2. Product Portfolio

            23.3.3.3. Key Financials

            23.3.3.4. SWOT Analysis

            23.3.3.5. Sales Footprint

            23.3.3.6. Strategy Overview

                23.3.3.6.1. Marketing Strategy

                23.3.3.6.2. Product Strategy

                23.3.3.6.3. Channel Strategy

        23.3.4. Siemens-healthineers (Siemens Medical Solutions USA, Inc)

            23.3.4.1. Overview

            23.3.4.2. Product Portfolio

            23.3.4.3. Key Financials

            23.3.4.4. SWOT Analysis

            23.3.4.5. Sales Footprint

            23.3.4.6. Strategy Overview

                23.3.4.6.1. Marketing Strategy

                23.3.4.6.2. Product Strategy

                23.3.4.6.3. Channel Strategy

        23.3.5. PerkinElmer Inc.

            23.3.5.1. Overview

            23.3.5.2. Product Portfolio

            23.3.5.3. Key Financials

            23.3.5.4. SWOT Analysis

            23.3.5.5. Sales Footprint

            23.3.5.6. Strategy Overview

                23.3.5.6.1. Marketing Strategy

                23.3.5.6.2. Product Strategy

                23.3.5.6.3. Channel Strategy

        23.3.6. BD Biosciences

            23.3.6.1. Overview

            23.3.6.2. Product Portfolio

            23.3.6.3. Key Financials

            23.3.6.4. SWOT Analysis

            23.3.6.5. Sales Footprint

            23.3.6.6. Strategy Overview

                23.3.6.6.1. Marketing Strategy

                23.3.6.6.2. Product Strategy

                23.3.6.6.3. Channel Strategy

        23.3.7. ThermoFisher Scientific Inc.

            23.3.7.1. Overview

            23.3.7.2. Product Portfolio

            23.3.7.3. Key Financials

            23.3.7.4. SWOT Analysis

            23.3.7.5. Sales Footprint

            23.3.7.6. Strategy Overview

                23.3.7.6.1. Marketing Strategy

                23.3.7.6.2. Product Strategy

                23.3.7.6.3. Channel Strategy

        23.3.8. Zoetis Inc.

            23.3.8.1. Overview

            23.3.8.2. Product Portfolio

            23.3.8.3. Key Financials

            23.3.8.4. SWOT Analysis

            23.3.8.5. Sales Footprint

            23.3.8.6. Strategy Overview

                23.3.8.6.1. Marketing Strategy

                23.3.8.6.2. Product Strategy

                23.3.8.6.3. Channel Strategy

        23.3.9. Promega Corporation

            23.3.9.1. Overview

            23.3.9.2. Product Portfolio

            23.3.9.3. Key Financials

            23.3.9.4. SWOT Analysis

            23.3.9.5. Sales Footprint

            23.3.9.6. Strategy Overview

                23.3.9.6.1. Marketing Strategy

                23.3.9.6.2. Product Strategy

                23.3.9.6.3. Channel Strategy

        23.3.10. F. Hoffmann- La Roche Ltd.

            23.3.10.1. Overview

            23.3.10.2. Product Portfolio

            23.3.10.3. Key Financials

            23.3.10.4. SWOT Analysis

            23.3.10.5. Sales Footprint

            23.3.10.6. Strategy Overview

                23.3.10.6.1. Marketing Strategy

                23.3.10.6.2. Product Strategy

                23.3.10.6.3. Channel Strategy

        23.3.11. bioMérieux SA

            23.3.11.1. Overview

            23.3.11.2. Product Portfolio

            23.3.11.3. Key Financials

            23.3.11.4. SWOT Analysis

            23.3.11.5. Sales Footprint

            23.3.11.6. Strategy Overview

                23.3.11.6.1. Marketing Strategy

                23.3.11.6.2. Product Strategy

                23.3.11.6.3. Channel Strategy

        23.3.12. Elabscience Biotechnology Inc.

            23.3.12.1. Overview

            23.3.12.2. Product Portfolio

            23.3.12.3. Key Financials

            23.3.12.4. SWOT Analysis

            23.3.12.5. Sales Footprint

            23.3.12.6. Strategy Overview

                23.3.12.6.1. Marketing Strategy

                23.3.12.6.2. Product Strategy

                23.3.12.6.3. Channel Strategy

        23.3.13. Innovative Research, Inc.

            23.3.13.1. Overview

            23.3.13.2. Product Portfolio

            23.3.13.3. Key Financials

            23.3.13.4. SWOT Analysis

            23.3.13.5. Sales Footprint

            23.3.13.6. Strategy Overview

                23.3.13.6.1. Marketing Strategy

                23.3.13.6.2. Product Strategy

                23.3.13.6.3. Channel Strategy

        23.3.14. QIAGEN N.V.

            23.3.14.1. Overview

            23.3.14.2. Product Portfolio

            23.3.14.3. Key Financials

            23.3.14.4. SWOT Analysis

            23.3.14.5. Sales Footprint

            23.3.14.6. Strategy Overview

                23.3.14.6.1. Marketing Strategy

                23.3.14.6.2. Product Strategy

                23.3.14.6.3. Channel Strategy

        23.3.15. Merck KgaA

            23.3.15.1. Overview

            23.3.15.2. Product Portfolio

            23.3.15.3. Key Financials

            23.3.15.4. SWOT Analysis

            23.3.15.5. Sales Footprint

            23.3.15.6. Strategy Overview

                23.3.15.6.1. Marketing Strategy

                23.3.15.6.2. Product Strategy

                23.3.15.6.3. Channel Strategy

        23.3.16. Bio-Rad Laboratories, Inc.

            23.3.16.1. Overview

            23.3.16.2. Product Portfolio

            23.3.16.3. Key Financials

            23.3.16.4. SWOT Analysis

            23.3.16.5. Sales Footprint

            23.3.16.6. Strategy Overview

                23.3.16.6.1. Marketing Strategy

                23.3.16.6.2. Product Strategy

                23.3.16.6.3. Channel Strategy

        23.3.17. Creative Diagnostics

            23.3.17.1. Overview

            23.3.17.2. Product Portfolio

            23.3.17.3. Key Financials

            23.3.17.4. SWOT Analysis

            23.3.17.5. Sales Footprint

            23.3.17.6. Strategy Overview

                23.3.17.6.1. Marketing Strategy

                23.3.17.6.2. Product Strategy

                23.3.17.6.3. Channel Strategy

        23.3.18. Cell Signaling Technology, Inc.

            23.3.18.1. Overview

            23.3.18.2. Product Portfolio

            23.3.18.3. Key Financials

            23.3.18.4. SWOT Analysis

            23.3.18.5. Sales Footprint

            23.3.18.6. Strategy Overview

                23.3.18.6.1. Marketing Strategy

                23.3.18.6.2. Product Strategy

                23.3.18.6.3. Channel Strategy

        23.3.19. NEW HORIZONS DIAGNOSTIC CORPORATION

            23.3.19.1. Overview

            23.3.19.2. Product Portfolio

            23.3.19.3. Key Financials

            23.3.19.4. SWOT Analysis

            23.3.19.5. Sales Footprint

            23.3.19.6. Strategy Overview

                23.3.19.6.1. Marketing Strategy

                23.3.19.6.2. Product Strategy

                23.3.19.6.3. Channel Strategy

        23.3.20. DiaSorin S.p.A.

            23.3.20.1. Overview

            23.3.20.2. Product Portfolio

            23.3.20.3. Key Financials

            23.3.20.4. SWOT Analysis

            23.3.20.5. Sales Footprint

            23.3.20.6. Strategy Overview

                23.3.20.6.1. Marketing Strategy

                23.3.20.6.2. Product Strategy

                23.3.20.6.3. Channel Strategy

        23.3.21. H.U. Group Holdings Inc (Fujirebio Holdings, Inc.)

            23.3.21.1. Overview

            23.3.21.2. Product Portfolio

            23.3.21.3. Key Financials

            23.3.21.4. SWOT Analysis

            23.3.21.5. Sales Footprint

            23.3.21.6. Strategy Overview

                23.3.21.6.1. Marketing Strategy

                23.3.21.6.2. Product Strategy

                23.3.21.6.3. Channel Strategy

        23.3.22. IDEXX Laboratories Inc. 

            23.3.22.1. Overview

            23.3.22.2. Product Portfolio

            23.3.22.3. Key Financials

            23.3.22.4. SWOT Analysis

            23.3.22.5. Sales Footprint

            23.3.22.6. Strategy Overview

                23.3.22.6.1. Marketing Strategy

                23.3.22.6.2. Product Strategy

                23.3.22.6.3. Channel Strategy

        23.3.23. Randox Laboratories Ltd.

            23.3.23.1. Overview

            23.3.23.2. Product Portfolio

            23.3.23.3. Key Financials

            23.3.23.4. SWOT Analysis

            23.3.23.5. Sales Footprint

            23.3.23.6. Strategy Overview

                23.3.23.6.1. Marketing Strategy

                23.3.23.6.2. Product Strategy

                23.3.23.6.3. Channel Strategy

        23.3.24. Biopanda Reagents Ltd.

            23.3.24.1. Overview

            23.3.24.2. Product Portfolio

            23.3.24.3. Key Financials

            23.3.24.4. SWOT Analysis

            23.3.24.5. Sales Footprint

            23.3.24.6. Strategy Overview

                23.3.24.6.1. Marketing Strategy

                23.3.24.6.2. Product Strategy

                23.3.24.6.3. Channel Strategy

        23.3.25. Shenzhen Bioeasy Biotechnology Co.,Ltd. 

            23.3.25.1. Overview

            23.3.25.2. Product Portfolio

            23.3.25.3. Key Financials

            23.3.25.4. SWOT Analysis

            23.3.25.5. Sales Footprint

            23.3.25.6. Strategy Overview

                23.3.25.6.1. Marketing Strategy

                23.3.25.6.2. Product Strategy

                23.3.25.6.3. Channel Strategy

        23.3.26. Quidel Corporation 

            23.3.26.1. Overview

            23.3.26.2. Product Portfolio

            23.3.26.3. Key Financials

            23.3.26.4. SWOT Analysis

            23.3.26.5. Sales Footprint

            23.3.26.6. Strategy Overview

                23.3.26.6.1. Marketing Strategy

                23.3.26.6.2. Product Strategy

                23.3.26.6.3. Channel Strategy

        23.3.27. Advnt Biotechnologies

            23.3.27.1. Overview

            23.3.27.2. Product Portfolio

            23.3.27.3. Key Financials

            23.3.27.4. SWOT Analysis

            23.3.27.5. Sales Footprint

            23.3.27.6. Strategy Overview

                23.3.27.6.1. Marketing Strategy

                23.3.27.6.2. Product Strategy

                23.3.27.6.3. Channel Strategy

        23.3.28. RESPONSE BIOMEDICAL

            23.3.28.1. Overview

            23.3.28.2. Product Portfolio

            23.3.28.3. Key Financials

            23.3.28.4. SWOT Analysis

            23.3.28.5. Sales Footprint

            23.3.28.6. Strategy Overview

                23.3.28.6.1. Marketing Strategy

                23.3.28.6.2. Product Strategy

                23.3.28.6.3. Channel Strategy

        23.3.29. Danaher

            23.3.29.1. Overview

            23.3.29.2. Product Portfolio

            23.3.29.3. Key Financials

            23.3.29.4. SWOT Analysis

            23.3.29.5. Sales Footprint

            23.3.29.6. Strategy Overview

                23.3.29.6.1. Marketing Strategy

                23.3.29.6.2. Product Strategy

                23.3.29.6.3. Channel Strategy

24. Assumptions and Acronyms Used

25. Research Methodology

Don't pay for what you don't need

Customize your report by selecting specific countries or regions and save 30%!

List of Tables

Table 01: Global Immunoassay Market Value (US$ Bn) Analysis 2012–2021, By Product

Table 02: Global Immunoassay Market Value (US$ Bn) Opportunity Assessment 2022–2032, By Product

Table 03: Global Immunoassay Market Value (US$ Bn) Analysis 2012–2021, By Assay

Table 04: Global Immunoassay Market Value (US$ Bn) Opportunity Assessment 2022–2032, By Assay

Table 05: Global Immunoassay Market Value (US$ Bn) Analysis 2012–2021, By Purpose

Table 06: Global Immunoassay Market Value (US$ Bn) Opportunity Assessment 2022–2032, By Purpose

Table 07: Global Immunoassay Market Value (US$ Bn) Analysis 2012–2021, By Specimen

Table 08: Global Immunoassay Market Value (US$ Bn) Opportunity Assessment 2022–2032, By Specimen

Table 09: Global Immunoassay Market Value (US$ Bn) Analysis 2012–2021, By Application

Table 10: Global Immunoassay Market Value (US$ Bn) Opportunity Assessment 2022–2032, By Application

Table 11: Global Immunoassay Market Value (US$ Bn) Analysis 2012–2021, By End User

Table 12: Global Immunoassay Market Value (US$ Bn) Opportunity Assessment 2022–2032, By End User

Table 13: Global Immunoassay Market Value (US$ Bn) Analysis 2012–2021, By Region

Table 14: Global Immunoassay Market Value (US$ Bn) Opportunity Assessment 2022–2032, By Region

Table 15: North America Immunoassay Market Value (US$ Bn) Analysis 2012–2021, By Country

Table 16: North America Immunoassay Market Value (US$ Bn) Opportunity Assessment 2022–2032, By Country

Table 17: North America Immunoassay Market Value (US$ Bn) Analysis 2012–2021, By Product

Table 18: North America Immunoassay Market Value (US$ Bn) Opportunity Assessment 2022–2032, By Product

Table 19: North America Immunoassay Market Value (US$ Bn) Analysis 2012–2021, By Assay

Table 20: North America Immunoassay Market Value (US$ Bn) Opportunity Assessment 2022–2032, By Assay

Table 21: North America Immunoassay Market Value (US$ Bn) Analysis 2012–2021, By Purpose

Table 22: North America Immunoassay Market Value (US$ Bn) Opportunity Assessment 2022–2032, By Purpose

Table 23: North America Immunoassay Market Value (US$ Bn) Analysis 2012–2021, By Specimen

Table 24: North America Immunoassay Market Value (US$ Bn) Opportunity Assessment 2022–2032, By Specimen

Table 25: North America Immunoassay Market Value (US$ Bn) Analysis 2012–2021, By Application

Table 26: North America Immunoassay Market Value (US$ Bn) Opportunity Assessment 2022–2032, By Application

Table 27: North America Immunoassay Market Value (US$ Bn) Analysis 2012–2021, By End User

Table 28: North America Immunoassay Market Value (US$ Bn) Opportunity Assessment 2022–2032, By End User

Table 29: Latin America Immunoassay Market Value (US$ Bn) Analysis 2012–2021, By Country

Table 30: Latin America Immunoassay Market Value (US$ Bn) Opportunity Assessment 2022–2032, By Country

Table 31: Latin America Immunoassay Market Value (US$ Bn) Analysis 2012–2021, By Product

Table 32: Latin America Immunoassay Market Value (US$ Bn) Opportunity Assessment 2022–2032, By Product

Table 33: Latin America Immunoassay Market Value (US$ Bn) Analysis 2012–2021, By Assay

Table 34: Latin America Immunoassay Market Value (US$ Bn) Opportunity Assessment 2022–2032, By Assay

Table 35: Latin America Immunoassay Market Value (US$ Bn) Analysis 2012–2021, By Purpose

Table 36: Latin America Immunoassay Market Value (US$ Bn) Opportunity Assessment 2022–2032, By Purpose

Table 37: Latin America Immunoassay Market Value (US$ Bn) Analysis 2012–2021, By Specimen

Table 38: Latin America Immunoassay Market Value (US$ Bn) Opportunity Assessment 2022–2032, By Specimen

Table 39: Latin America Immunoassay Market Value (US$ Bn) Analysis 2012–2021, By Application

Table 40: Latin America Immunoassay Market Value (US$ Bn) Opportunity Assessment 2022–2032, By Application

Table 41: Latin America Immunoassay Market Value (US$ Bn) Analysis 2012–2021, By End User

Table 42: Latin America Immunoassay Market Value (US$ Bn) Opportunity Assessment 2022–2032, By End User

Table 43: Europe Immunoassay Market Value (US$ Bn) Analysis 2012–2021, By Country

Table 44: Europe Immunoassay Market Value (US$ Bn) Opportunity Assessment 2022–2032, By Country

Table 45: Europe Immunoassay Market Value (US$ Bn) Analysis 2012–2021, By Product

Table 46: Europe Immunoassay Market Value (US$ Bn) Opportunity Assessment 2022–2032, By Product

Table 47: Europe Immunoassay Market Value (US$ Bn) Analysis 2012–2021, By Assay

Table 48: Europe Immunoassay Market Value (US$ Bn) Opportunity Assessment 2022–2032, By Assay

Table 49: Europe Immunoassay Market Value (US$ Bn) Analysis 2012–2021, By Purpose

Table 50: Europe Immunoassay Market Value (US$ Bn) Opportunity Assessment 2022–2032, By Purpose

Table 51: Europe Immunoassay Market Value (US$ Bn) Analysis 2012–2021, By Specimen

Table 52: Europe Immunoassay Market Value (US$ Bn) Opportunity Assessment 2022–2032, By Specimen

Table 53: Europe Immunoassay Market Value (US$ Bn) Analysis 2012–2021, By Application

Table 54: Europe Immunoassay Market Value (US$ Bn) Opportunity Assessment 2022–2032, By Application

Table 55: Europe Immunoassay Market Value (US$ Bn) Analysis 2012–2021, By End User

Table 56: Europe Immunoassay Market Value (US$ Bn) Opportunity Assessment 2022–2032, By End User

Table 57: South Asia Immunoassay Market Value (US$ Bn) Analysis 2012–2021, By Country

Table 58: South Asia Immunoassay Market Value (US$ Bn) Opportunity Assessment 2022–2032, By Country

Table 59: South Asia Immunoassay Market Value (US$ Bn) Analysis 2012–2021, By Product

Table 60: South Asia Immunoassay Market Value (US$ Bn) Opportunity Assessment 2022–2032, By Product

Table 61: South Asia Immunoassay Market Value (US$ Bn) Analysis 2012–2021, By Assay

Table 62: South Asia Immunoassay Market Value (US$ Bn) Opportunity Assessment 2022–2032, By Assay

Table 63: South Asia Immunoassay Market Value (US$ Bn) Analysis 2012–2021, By Purpose

Table 64: South Asia Immunoassay Market Value (US$ Bn) Opportunity Assessment 2022–2032, By Purpose

Table 65: South Asia Immunoassay Market Value (US$ Bn) Analysis 2012–2021, By Specimen

Table 66: South Asia Immunoassay Market Value (US$ Bn) Opportunity Assessment 2022–2032, By Specimen

Table 67: South Asia Immunoassay Market Value (US$ Bn) Analysis 2012–2021, By Application

Table 68: South Asia Immunoassay Market Value (US$ Bn) Opportunity Assessment 2022–2032, By Application

Table 69: South Asia Immunoassay Market Value (US$ Bn) Analysis 2012–2021, By End User

Table 70: South Asia Immunoassay Market Value (US$ Bn) Opportunity Assessment 2022–2032, By End User

Table 71: East Asia Immunoassay Market Value (US$ Bn) Analysis 2012–2021, By Country

Table 72: East Asia Immunoassay Market Value (US$ Bn) Opportunity Assessment 2022–2032, By Country

Table 73: East Asia Immunoassay Market Value (US$ Bn) Analysis 2012–2021, By Product

Table 74: East Asia Immunoassay Market Value (US$ Bn) Opportunity Assessment 2022–2032, By Product

Table 75: East Asia Immunoassay Market Value (US$ Bn) Analysis 2012–2021, By Assay

Table 76: East Asia Immunoassay Market Value (US$ Bn) Opportunity Assessment 2022–2032, By Assay

Table 77: East Asia Immunoassay Market Value (US$ Bn) Analysis 2012–2021, By Purpose

Table 78: East Asia Immunoassay Market Value (US$ Bn) Opportunity Assessment 2022–2032, By Purpose

Table 79: East Asia Immunoassay Market Value (US$ Bn) Analysis 2012–2021, By Specimen

Table 80: East Asia Immunoassay Market Value (US$ Bn) Opportunity Assessment 2022–2032, By Specimen

Table 81: East Asia Immunoassay Market Value (US$ Bn) Analysis 2012–2021, By Application

Table 82: East Asia Immunoassay Market Value (US$ Bn) Opportunity Assessment 2022–2032, By Application

Table 83: East Asia Immunoassay Market Value (US$ Bn) Analysis 2012–2021, By End User

Table 84: East Asia Immunoassay Market Value (US$ Bn) Opportunity Assessment 2022–2032, By End User

Table 85: Oceania Immunoassay Market Value (US$ Bn) Analysis 2012–2021, By Country

Table 86: Oceania Immunoassay Market Value (US$ Bn) Opportunity Assessment 2022–2032, By Country

Table 87: Oceania Immunoassay Market Value (US$ Bn) Analysis 2012–2021, By Product

Table 88: Oceania Immunoassay Market Value (US$ Bn) Opportunity Assessment 2022–2032, By Product

Table 89: Oceania Immunoassay Market Value (US$ Bn) Analysis 2012–2021, By Assay

Table 90: Oceania Immunoassay Market Value (US$ Bn) Opportunity Assessment 2022–2032, By Assay

Table 91: Oceania Immunoassay Market Value (US$ Bn) Analysis 2012–2021, By Purpose

Table 92: Oceania Immunoassay Market Value (US$ Bn) Opportunity Assessment 2022–2032, By Purpose

Table 93: Oceania Immunoassay Market Value (US$ Bn) Analysis 2012–2021, By Specimen

Table 94: Oceania Immunoassay Market Value (US$ Bn) Opportunity Assessment 2022–2032, By Specimen

Table 95: Oceania Immunoassay Market Value (US$ Bn) Analysis 2012–2021, By Application

Table 96: Oceania Immunoassay Market Value (US$ Bn) Opportunity Assessment 2022–2032, By Application

Table 97: Oceania Immunoassay Market Value (US$ Bn) Analysis 2012–2021, By End User

Table 98: Oceania Immunoassay Market Value (US$ Bn) Opportunity Assessment 2022–2032, By End User

Table 99: Middle East and Africa (MEA) Immunoassay Market Value (US$ Bn) Analysis 2012–2021, By Country

Table 100: Middle East and Africa (MEA) Immunoassay Market Value (US$ Bn) Opportunity Assessment 2022–2032, By Country

Table 101: Middle East and Africa (MEA) Immunoassay Market Value (US$ Bn) Analysis 2012–2021, By Product

Table 102: Middle East and Africa (MEA) Immunoassay Market Value (US$ Bn) Opportunity Assessment 2022–2032, By Product

Table 103: Middle East and Africa (MEA) Immunoassay Market Value (US$ Bn) Analysis 2012–2021, By Assay

Table 104: Middle East and Africa (MEA) Immunoassay Market Value (US$ Bn) Opportunity Assessment 2022–2032, By Assay

Table 105: Middle East and Africa (MEA) Immunoassay Market Value (US$ Bn) Analysis 2012–2021, By Purpose

Table 106: Middle East and Africa (MEA) Immunoassay Market Value (US$ Bn) Opportunity Assessment 2022–2032, By Purpose

Table 107: Middle East and Africa (MEA) Immunoassay Market Value (US$ Bn) Analysis 2012–2021, By Specimen

Table 108: Middle East and Africa (MEA) Immunoassay Market Value (US$ Bn) Opportunity Assessment 2022–2032, By Specimen

Table 109: Middle East and Africa (MEA) Immunoassay Market Value (US$ Bn) Analysis 2012–2021, By Application

Table 110: Middle East and Africa (MEA) Immunoassay Market Value (US$ Bn) Opportunity Assessment 2022–2032, By Application

Table 111: Middle East and Africa (MEA) Immunoassay Market Value (US$ Bn) Analysis 2012–2021,

Table 112: Middle East and Africa (MEA) Immunoassay Market Value (US$ Bn) Analysis 2012–2021, By End User

Table 113: Middle East and Africa (MEA) Immunoassay Market Value (US$ Bn) Opportunity Assessment 2022–2032, By End User
Sabyasachi Ghosh
Sabyasachi Ghosh

Principal Consultant

Talk to Analyst

Find your sweet spots for generating winning opportunities in this market.

List of Charts

Figure 01: Global Immunoassay Market Historical Market Value (US$ Bn) Analysis, 2012–2021

Figure 02: Global Immunoassay Market Value (US$ Bn), 2022 – 2032 & Y-o-Y Growth Trend Analysis

Figure 03: Global Immunoassay Market Absolute $ Opportunity, 2022-2032

Figure 04: Global Immunoassay Market Share Analysis (%), By Product, 2021 & 2032

Figure 05: Global Immunoassay Market Y-o-Y Analysis (%), By Product, 2022-2032

Figure 06: Global Immunoassay Market Attractiveness Analysis By Product, 2022-2032

Figure 07: Global Immunoassay Market Share Analysis (%), By Assay, 2021 & 2032

Figure 08: Global Immunoassay Market Y-o-Y Analysis (%), By Assay, 2022-2032

Figure 09: Global Immunoassay Market Attractiveness Analysis By Assay, 2022-2032

Figure 10: Global Immunoassay Market Share Analysis (%), By Purpose, 2021 & 2032

Figure 11: Global Immunoassay Market Y-o-Y Analysis (%), By Purpose, 2022-2032

Figure 12: Global Immunoassay Market Attractiveness Analysis By Purpose, 2022-2032

Figure 13: Global Immunoassay Market Share Analysis (%), By Specimen, 2021 & 2032

Figure 14: Global Immunoassay Market Y-o-Y Analysis (%), By Specimen, 2022-2032

Figure 15: Global Immunoassay Market Attractiveness Analysis By Specimen, 2022-2032

Figure 16: Global Immunoassay Market Share Analysis (%), By Application, 2021 & 2032

Figure 17: Global Immunoassay Market Y-o-Y Analysis (%), By Application, 2022-2032

Figure 18: Global Immunoassay Market Attractiveness Analysis By Application, 2022-2032

Figure 19: Global Immunoassay Market Share Analysis (%), By End User, 2021 & 2032

Figure 20: Global Immunoassay Market Y-o-Y Analysis (%), By End User, 2022-2032

Figure 21: Global Immunoassay Market Attractiveness Analysis By End User, 2022-2032

Figure 22: Global Immunoassay Market Share Analysis (%), By Region, 2021 & 2032

Figure 23: Global Immunoassay Market Y-o-Y Analysis (%), By Region, 2022-2032

Figure 24: Global Immunoassay Market Attractiveness Analysis by Region, 2022-2032

Figure 25: North America Immunoassay Market Share Analysis (%), By Country (2022)

Figure 26: North America Immunoassay Market Share Analysis (%), By Product (2022)

Figure 27: North America Immunoassay Market Share Analysis (%), By Assay (2022)

Figure 28: North America Immunoassay Market Share Analysis (%), By Purpose (2022)

Figure 29: North America Immunoassay Market Share Analysis (%), By Specimen (2022)

Figure 30: North America Immunoassay Market Share Analysis (%), By Application (2022)

Figure 31: North America Immunoassay Market Share Analysis (%), By End User (2022)

Figure 32: North America Immunoassay Historical Market Value (US$ Bn) Analysis, 2012–2021

Figure 33: North America Immunoassay Current and Future Market Value (US$ Bn), 2022-2032 & Y-o-Y Growth Trend Analysis

Figure 34: North America Immunoassay Market Attractiveness Analysis, By Country

Figure 35: North America Immunoassay Market Attractiveness Analysis, By Product

Figure 36: North America Immunoassay Market Attractiveness Analysis, By Assay

Figure 37: North America Immunoassay Market Attractiveness Analysis, By Purpose

Figure 38: North America Immunoassay Market Attractiveness Analysis, By Specimen

Figure 39: North America Immunoassay Market Attractiveness Analysis, By Application

Figure 40: North America Immunoassay Market Attractiveness Analysis, By End User

Figure 41: U.S. Market Value Proportion Analysis, 2021

Figure 42: Global Vs U.S. Y-o-Y Growth Comparison, 2021-2032

Figure 43: U.S. Immunoassay Market Share Analysis (%), By Product, 2021 & 2032

Figure 44: U.S. Immunoassay Market Share Analysis (%), By Assay, 2021 & 2032

Figure 45: U.S. Immunoassay Market Share Analysis (%), By Purpose, 2021 & 2032

Figure 46: U.S. Immunoassay Market Share Analysis (%), By Specimen, 2021 & 2032

Figure 47: U.S. Immunoassay Market Share Analysis (%), By Application, 2021 & 2032

Figure 48: U.S. Immunoassay Market Share Analysis (%), By End User, 2021 & 2032

Figure 49: Canada Market Value Proportion Analysis, 2021

Figure 50: Global Vs Canada Y-o-Y Growth Comparison, 2021-2032

Figure 51: Canada Immunoassay Market Share Analysis (%), By Product, 2021 & 2032

Figure 52: Canada Immunoassay Market Share Analysis (%), By Assay, 2021 & 2032

Figure 53: Canada Immunoassay Market Share Analysis (%), By Purpose, 2021 & 2032

Figure 54: Canada Immunoassay Market Share Analysis (%), By Specimen, 2021 & 2032

Figure 55: Canada Immunoassay Market Share Analysis (%), By Application, 2021 & 2032

Figure 56: Canada Immunoassay Market Share Analysis (%), By End User, 2021 & 2032

Figure 57: Latin America Immunoassay Market Share Analysis (%), By Country (2022)

Figure 58: Latin America Immunoassay Market Share Analysis (%), By Product (2022)

Figure 59: Latin America Immunoassay Market Share Analysis (%), By Assay (2022)

Figure 60: Latin America Immunoassay Market Share Analysis (%), By Purpose (2022)

Figure 61: Latin America Immunoassay Market Share Analysis (%), By Specimen (2022)

Figure 62: Latin America Immunoassay Market Share Analysis (%), By Application (2022)

Figure 63: Latin America Immunoassay Market Share Analysis (%), By End User (2022)

Figure 64: Latin America Immunoassay Historical Market Value (US$ Bn) Analysis, 2012–2021

Figure 65: Latin America Immunoassay Current and Future Market Value (US$ Bn), 2022-2032 & Y-o-Y Growth Trend Analysis

Figure 66: Latin America Immunoassay Market Attractiveness Analysis, By Country

Figure 67: Latin America Immunoassay Market Attractiveness Analysis, By Product

Figure 68: Latin America Immunoassay Market Attractiveness Analysis, By Assay

Figure 69: Latin America Immunoassay Market Attractiveness Analysis, By Purpose

Figure 70: Latin America Immunoassay Market Attractiveness Analysis, By Specimen

Figure 71: Latin America Immunoassay Market Attractiveness Analysis, By Application

Figure 72: Latin America Immunoassay Market Attractiveness Analysis, By End User

Figure 73: Brazil Market Value Proportion Analysis, 2021

Figure 74: Global Vs Brazil Y-o-Y Growth Comparison, 2021-2032

Figure 75: Brazil Immunoassay Market Share Analysis (%), By Product, 2021 & 2032

Figure 76: Brazil Immunoassay Market Share Analysis (%), By Assay, 2021 & 2032

Figure 77: Brazil Immunoassay Market Share Analysis (%), By Purpose, 2021 & 2032

Figure 78: Brazil Immunoassay Market Share Analysis (%), By Specimen, 2021 & 2032

Figure 79: Brazil Immunoassay Market Share Analysis (%), By Application, 2021 & 2032

Figure 80: Brazil Immunoassay Market Share Analysis (%), By End User, 2021 & 2032

Figure 81: Mexico Market Value Proportion Analysis, 2021

Figure 82: Global Vs Mexico Y-o-Y Growth Comparison, 2021-2032

Figure 83: Mexico Immunoassay Market Share Analysis (%), By Product, 2021 & 2032

Figure 84: Mexico Immunoassay Market Share Analysis (%), By Assay, 2021 & 2032

Figure 85: Mexico Immunoassay Market Share Analysis (%), By Purpose, 2021 & 2032

Figure 86: Mexico Immunoassay Market Share Analysis (%), By Specimen, 2021 & 2032

Figure 87: Mexico Immunoassay Market Share Analysis (%), By Application, 2021 & 2032

Figure 88: Mexico Immunoassay Market Share Analysis (%), By End User, 2021 & 2032

Figure 89: Argentina Market Value Proportion Analysis, 2021

Figure 90: Global Vs Argentina Y-o-Y Growth Comparison, 2021-2032

Figure 91: Argentina Immunoassay Market Share Analysis (%), By Product, 2021 & 2032

Figure 92: Argentina Immunoassay Market Share Analysis (%), By Assay, 2021 & 2032

Figure 93: Argentina Immunoassay Market Share Analysis (%), By Purpose, 2021 & 2032

Figure 94: Argentina Immunoassay Market Share Analysis (%), By Specimen, 2021 & 2032

Figure 95: Argentina Immunoassay Market Share Analysis (%), By Application, 2021 & 2032

Figure 96: Argentina Immunoassay Market Share Analysis (%), By End User, 2021 & 2032

Figure 97: Europe Immunoassay Market Share Analysis (%), By Country (2022)

Figure 98: Europe Immunoassay Market Share Analysis (%), By Product (2022)

Figure 99: Europe Immunoassay Market Share Analysis (%), By Assay (2022)

Figure 100: Europe Immunoassay Market Share Analysis (%), By Purpose (2022)

Figure 101: Europe Immunoassay Market Share Analysis (%), By Specimen (2022)

Figure 102: Europe Immunoassay Market Share Analysis (%), By Application (2022)

Figure 103: Europe Immunoassay Market Share Analysis (%), By End User (2022)

Figure 104: Europe Immunoassay Historical Market Value (US$ Bn) Analysis, 2012–2021

Figure 105: Europe Immunoassay Current and Future Market Value (US$ Bn), 2022-2032 & Y-o-Y Growth Trend Analysis

Figure 106: Europe Immunoassay Market Attractiveness Analysis, By Country

Figure 107: Europe Immunoassay Market Attractiveness Analysis, By Product

Figure 108: Europe Immunoassay Market Attractiveness Analysis, By Assay

Figure 109: Europe Immunoassay Market Attractiveness Analysis, By Purpose

Figure 110: Europe Immunoassay Market Attractiveness Analysis, By Specimen

Figure 111: Europe Immunoassay Market Attractiveness Analysis, By Application

Figure 112: Europe Immunoassay Market Attractiveness Analysis, By End User

Figure 113: U.K. Market Value Proportion Analysis, 2021

Figure 114: Global Vs U.K. Y-o-Y Growth Comparison, 2021-2032

Figure 115: U.K. Immunoassay Market Share Analysis (%), By Product, 2021 & 2032

Figure 116: U.K. Immunoassay Market Share Analysis (%), By Assay, 2021 & 2032

Figure 117: U.K. Immunoassay Market Share Analysis (%), By Purpose, 2021 & 2032

Figure 118: U.K. Immunoassay Market Share Analysis (%), By Specimen, 2021 & 2032

Figure 119: U.K. Immunoassay Market Share Analysis (%), By Application, 2021 & 2032

Figure 120: U.K. Immunoassay Market Share Analysis (%), By End User, 2021 & 2032

Figure 121: Germany Market Value Proportion Analysis, 2021

Figure 122: Global Vs Germany Y-o-Y Growth Comparison, 2021-2032

Figure 123: Germany Immunoassay Market Share Analysis (%), By Product, 2021 & 2032

Figure 124: Germany Immunoassay Market Share Analysis (%), By Assay, 2021 & 2032

Figure 125: Germany Immunoassay Market Share Analysis (%), By Purpose, 2021 & 2032

Figure 126: Germany Immunoassay Market Share Analysis (%), By Specimen, 2021 & 2032

Figure 127: Germany Immunoassay Market Share Analysis (%), By Application, 2021 & 2032

Figure 128: Germany Immunoassay Market Share Analysis (%), By End User, 2021 & 2032

Figure 129: Italy Market Value Proportion Analysis, 2021

Figure 130: Global Vs Italy Y-o-Y Growth Comparison, 2021-2032

Figure 131: Italy Immunoassay Market Share Analysis (%), By Product, 2021 & 2032

Figure 132: Italy Immunoassay Market Share Analysis (%), By Assay, 2021 & 2032

Figure 133: Italy Immunoassay Market Share Analysis (%), By Purpose, 2021 & 2032

Figure 134: Italy Immunoassay Market Share Analysis (%), By Specimen, 2021 & 2032

Figure 135: Italy Immunoassay Market Share Analysis (%), By Application, 2021 & 2032

Figure 136: Italy Immunoassay Market Share Analysis (%), By End User, 2021 & 2032

Figure 137: France Market Value Proportion Analysis, 2021

Figure 138: Global Vs France Y-o-Y Growth Comparison, 2021-2032

Figure 139: France Immunoassay Market Share Analysis (%), By Product, 2021 & 2032

Figure 140: France Immunoassay Market Share Analysis (%), By Assay, 2021 & 2032

Figure 141: France Immunoassay Market Share Analysis (%), By Purpose, 2021 & 2032

Figure 142: France Immunoassay Market Share Analysis (%), By Specimen, 2021 & 2032

Figure 143: France Immunoassay Market Share Analysis (%), By Application, 2021 & 2032

Figure 144: France Immunoassay Market Share Analysis (%), By End User, 2021 & 2032

Figure 145: Spain Market Value Proportion Analysis, 2021

Figure 146: Global Vs Spain Y-o-Y Growth Comparison, 2021-2032

Figure 147: Spain Immunoassay Market Share Analysis (%), By Product, 2021 & 2032

Figure 148: Spain Immunoassay Market Share Analysis (%), By Assay, 2021 & 2032

Figure 149: Spain Immunoassay Market Share Analysis (%), By Purpose, 2021 & 2032

Figure 150: Spain Immunoassay Market Share Analysis (%), By Specimen, 2021 & 2032

Figure 151: Spain Immunoassay Market Share Analysis (%), By Application, 2021 & 2032

Figure 152: Spain Immunoassay Market Share Analysis (%), By End User, 2021 & 2032

Figure 153: Russia Market Value Proportion Analysis, 2021

Figure 154: Global Vs Russia Y-o-Y Growth Comparison, 2021-2032

Figure 155: Russia Immunoassay Market Share Analysis (%), By Product, 2021 & 2032

Figure 156: Russia Immunoassay Market Share Analysis (%), By Assay, 2021 & 2032

Figure 157: Russia Immunoassay Market Share Analysis (%), By Purpose, 2021 & 2032

Figure 158: Russia Immunoassay Market Share Analysis (%), By Specimen, 2021 & 2032

Figure 159: Russia Immunoassay Market Share Analysis (%), By Application, 2021 & 2032

Figure 160: Russia Immunoassay Market Share Analysis (%), By End User, 2021 & 2032

Figure 161: Nordic Countries Market Value Proportion Analysis, 2021

Figure 162: Global Vs Nordic Countries Y-o-Y Growth Comparison, 2021-2032

Figure 163: Nordic Countries Immunoassay Market Share Analysis (%), By Product, 2021 & 2032

Figure 164: Nordic Countries Immunoassay Market Share Analysis (%), By Assay, 2021 & 2032

Figure 165: Nordic Countries Immunoassay Market Share Analysis (%), By Purpose, 2021 & 2032

Figure 166: Nordic Countries Immunoassay Market Share Analysis (%), By Specimen, 2021 & 2032

Figure 167: Nordic Countries Immunoassay Market Share Analysis (%), By Application, 2021 & 2032

Figure 168: Nordic Countries Immunoassay Market Share Analysis (%), By End User, 2021 & 2032

Figure 169: BENELUX Market Value Proportion Analysis, 2021

Figure 170: Global Vs BENELUX Y-o-Y Growth Comparison, 2021-2032

Figure 171: BENELUX Immunoassay Market Share Analysis (%), By Product, 2021 & 2032

Figure 172: BENELUX Immunoassay Market Share Analysis (%), By Assay, 2021 & 2032

Figure 173: BENELUX Immunoassay Market Share Analysis (%), By Purpose, 2021 & 2032

Figure 174: BENELUX Immunoassay Market Share Analysis (%), By Specimen, 2021 & 2032

Figure 175: BENELUX Immunoassay Market Share Analysis (%), By Application, 2021 & 2032

Figure 176: BENELUX Immunoassay Market Share Analysis (%), By End User, 2021 & 2032

Figure 177: South Asia Immunoassay Market Share Analysis (%), By Country (2022)

Figure 178: South Asia Immunoassay Market Share Analysis (%), By Product (2022)

Figure 179: South Asia Immunoassay Market Share Analysis (%), By Assay (2022)

Figure 180: South Asia Immunoassay Market Share Analysis (%), By Purpose (2022)

Figure 181: South Asia Immunoassay Market Share Analysis (%), By Specimen (2022)

Figure 182: South Asia Immunoassay Market Share Analysis (%), By Application (2022)

Figure 183: South Asia Immunoassay Market Share Analysis (%), By End User (2022)

Figure 184: South Asia Immunoassay Historical Market Value (US$ Bn) Analysis, 2012–2021

Figure 184: South Asia Immunoassay Current and Future Market Value (US$ Bn), 2022-2032 & Y-o-Y Growth Trend Analysis

Figure 185: South Asia Immunoassay Market Attractiveness Analysis, By Country

Figure 186: South Asia Immunoassay Market Attractiveness Analysis, By Product

Figure 187: South Asia Immunoassay Market Attractiveness Analysis, By Assay

Figure 188: South Asia Immunoassay Market Attractiveness Analysis, By Purpose

Figure 189: South Asia Immunoassay Market Attractiveness Analysis, By Specimen

Figure 190: South Asia Immunoassay Market Attractiveness Analysis, By Application

Figure 191: South Asia Immunoassay Market Attractiveness Analysis, By End User

Figure 192: India Market Value Proportion Analysis, 2021

Figure 193: Global Vs India Y-o-Y Growth Comparison, 2021-2032

Figure 194: India Immunoassay Market Share Analysis (%), By Product, 2021 & 2032

Figure 195: India Immunoassay Market Share Analysis (%), By Assay, 2021 & 2032

Figure 196: India Immunoassay Market Share Analysis (%), By Purpose, 2021 & 2032

Figure 197 India Immunoassay Market Share Analysis (%), By Specimen, 2021 & 2032

Figure 198: India Immunoassay Market Share Analysis (%), By Application, 2021 & 2032

Figure 199: India Immunoassay Market Share Analysis (%), By End User, 2021 & 2032

Figure 200: Thailand Market Value Proportion Analysis, 2021

Figure 201: Global Vs Thailand Y-o-Y Growth Comparison, 2021-2032

Figure 202: Thailand Immunoassay Market Share Analysis (%), By Product, 2021 & 2032

Figure 203: Thailand Immunoassay Market Share Analysis (%), By Assay, 2021 & 2032

Figure 204: Thailand Immunoassay Market Share Analysis (%), By Purpose, 2021 & 2032

Figure 205: Thailand Immunoassay Market Share Analysis (%), By Specimen, 2021 & 2032

Figure 206: Thailand Immunoassay Market Share Analysis (%), By Application, 2021 & 2032

Figure 207: Thailand Immunoassay Market Share Analysis (%), By End User, 2021 & 2032

Figure 208: Indonesia Market Value Proportion Analysis, 2021

Figure 209: Global Vs Indonesia Y-o-Y Growth Comparison, 2021-2032

Figure 210: Indonesia Immunoassay Market Share Analysis (%), By Product, 2021 & 2032

Figure 211: Indonesia Immunoassay Market Share Analysis (%), By Assay, 2021 & 2032

Figure 212: Indonesia Immunoassay Market Share Analysis (%), By Purpose, 2021 & 2032

Figure 213: Indonesia Immunoassay Market Share Analysis (%), By Specimen, 2021 & 2032

Figure 214: Indonesia Immunoassay Market Share Analysis (%), By Application, 2021 & 2032

Figure 215: Indonesia Immunoassay Market Share Analysis (%), By End User, 2021 & 2032

Figure 216: Malaysia Market Value Proportion Analysis, 2021

Figure 217: Global Vs Malaysia Y-o-Y Growth Comparison, 2021-2032

Figure 218: Malaysia Immunoassay Market Share Analysis (%), By Product, 2021 & 2032

Figure 219: Malaysia Immunoassay Market Share Analysis (%), By Assay, 2021 & 2032

Figure 220: Malaysia Immunoassay Market Share Analysis (%), By Purpose, 2021 & 2032

Figure 221: Malaysia Immunoassay Market Share Analysis (%), By Specimen, 2021 & 2032

Figure 222: Malaysia Immunoassay Market Share Analysis (%), By Application, 2021 & 2032

Figure 223: Malaysia Immunoassay Market Share Analysis (%), By End User, 2021 & 2032

Figure 224: Philippines Market Value Proportion Analysis, 2021

Figure 225: Global Vs Philippines Y-o-Y Growth Comparison, 2021-2032

Figure 226: Philippines Immunoassay Market Share Analysis (%), By Product, 2021 & 2032

Figure 227: Philippines Immunoassay Market Share Analysis (%), By Assay, 2021 & 2032

Figure 228: Philippines Immunoassay Market Share Analysis (%), By Purpose, 2021 & 2032

Figure 229: Philippines Immunoassay Market Share Analysis (%), By Specimen, 2021 & 2032

Figure 230: Philippines Immunoassay Market Share Analysis (%), By Application, 2021 & 2032

Figure 231: Philippines Immunoassay Market Share Analysis (%), By End User, 2021 & 2032

Figure 232: Vietnam Market Value Proportion Analysis, 2021

Figure 233: Global Vs Vietnam Y-o-Y Growth Comparison, 2021-2032

Figure 234: Vietnam Immunoassay Market Share Analysis (%), By Product, 2021 & 2032

Figure 235: Vietnam Immunoassay Market Share Analysis (%), By Assay, 2021 & 2032

Figure 236: Vietnam Immunoassay Market Share Analysis (%), By Purpose, 2021 & 2032

Figure 237: Vietnam Immunoassay Market Share Analysis (%), By Specimen, 2021 & 2032

Figure 238: Vietnam Immunoassay Market Share Analysis (%), By Application, 2021 & 2032

Figure 239: Vietnam Immunoassay Market Share Analysis (%), By End User, 2021 & 2032

Figure 240: East Asia Immunoassay Market Share Analysis (%), By Country (2022)

Figure 241: East Asia Immunoassay Market Share Analysis (%), By Product (2022)

Figure 242: East Asia Immunoassay Market Share Analysis (%), By Assay (2022)

Figure 243: East Asia Immunoassay Market Share Analysis (%), By Purpose (2022)

Figure 244: East Asia Immunoassay Market Share Analysis (%), By Specimen (2022)

Figure 245: East Asia Immunoassay Market Share Analysis (%), By Application (2022)

Figure 246: East Asia Immunoassay Market Share Analysis (%), By End User (2022)

Figure 247: East Asia Immunoassay Historical Market Value (US$ Bn) Analysis, 2012–2021

Figure 248: East Asia Immunoassay Current and Future Market Value (US$ Bn), 2022-2032 & Y-o-Y Growth Trend Analysis

Figure 249: East Asia Immunoassay Market Attractiveness Analysis, By Country

Figure 250: East Asia Immunoassay Market Attractiveness Analysis, By Product

Figure 251: East Asia Immunoassay Market Attractiveness Analysis, By Assay

Figure 252: East Asia Immunoassay Market Attractiveness Analysis, By Purpose

Figure 253: East Asia Immunoassay Market Attractiveness Analysis, By Specimen

Figure 254: East Asia Immunoassay Market Attractiveness Analysis, By Application

Figure 255: East Asia Immunoassay Market Attractiveness Analysis, By End User

Figure 256: China Market Value Proportion Analysis, 2021

Figure 257: Global Vs China Y-o-Y Growth Comparison, 2021-2032

Figure 258: China Immunoassay Market Share Analysis (%), By Product, 2021 & 2032

Figure 259: China Immunoassay Market Share Analysis (%), By Assay, 2021 & 2032

Figure 260: China Immunoassay Market Share Analysis (%), By Purpose, 2021 & 2032

Figure 261: China Immunoassay Market Share Analysis (%), By Specimen, 2021 & 2032

Figure 262: China Immunoassay Market Share Analysis (%), By Application, 2021 & 2032

Figure 263: China Immunoassay Market Share Analysis (%), By End User, 2021 & 2032

Figure 264: Japan Market Value Proportion Analysis, 2021

Figure 265: Global Vs Japan Y-o-Y Growth Comparison, 2021-2032

Figure 266: Japan Immunoassay Market Share Analysis (%), By Product, 2021 & 2032

Figure 267: Japan Immunoassay Market Share Analysis (%), By Assay, 2021 & 2032

Figure 268: Japan Immunoassay Market Share Analysis (%), By Purpose, 2021 & 2032

Figure 269: Japan Immunoassay Market Share Analysis (%), By Specimen, 2021 & 2032

Figure 270: Japan Immunoassay Market Share Analysis (%), By Application, 2021 & 2032

Figure 271: Japan Immunoassay Market Share Analysis (%), By End User, 2021 & 2032

Figure 272: South Korea Market Value Proportion Analysis, 2021

Figure 273: Global Vs South Korea Y-o-Y Growth Comparison, 2021-2032

Figure 274: South Korea Immunoassay Market Share Analysis (%), By Product, 2021 & 2032

Figure 275: South Korea Immunoassay Market Share Analysis (%), By Assay, 2021 & 2032

Figure 276: South Korea Immunoassay Market Share Analysis (%), By Purpose, 2021 & 2032

Figure 277: South Korea Immunoassay Market Share Analysis (%), By Specimen, 2021 & 2032

Figure 278: South Korea Immunoassay Market Share Analysis (%), By Application, 2021 & 2032

Figure 279: South Korea Immunoassay Market Share Analysis (%), By End User, 2021 & 2032

Figure 280: Oceania Immunoassay Market Share Analysis (%), By Country (2022)

Figure 281: Oceania Immunoassay Market Share Analysis (%), By Product (2022)

Figure 282: Oceania Immunoassay Market Share Analysis (%), By Assay (2022)

Figure 283: Oceania Immunoassay Market Share Analysis (%), By Purpose (2022)

Figure 284: Oceania Immunoassay Market Share Analysis (%), By Specimen (2022)

Figure 285: Oceania Immunoassay Market Share Analysis (%), By Application (2022)

Figure 286: Oceania Immunoassay Market Share Analysis (%), By End User (2022)

Figure 287: Oceania Immunoassay Historical Market Value (US$ Bn) Analysis, 2012–2021

Figure 288: Oceania Immunoassay Current and Future Market Value (US$ Bn), 2022-2032 & Y-o-Y Growth Trend Analysis

Figure 289: Oceania Immunoassay Market Attractiveness Analysis, By Country

Figure 290: Oceania Immunoassay Market Attractiveness Analysis, By Product

Figure 291: Oceania Immunoassay Market Attractiveness Analysis, By Assay

Figure 292: Oceania Immunoassay Market Attractiveness Analysis, By Purpose

Figure 293: Oceania Immunoassay Market Attractiveness Analysis, By Specimen

Figure 294: Oceania Immunoassay Market Attractiveness Analysis, By Application

Figure 295: Oceania Immunoassay Market Attractiveness Analysis, By End User

Figure 296: Australia Market Value Proportion Analysis, 2021

Figure 297: Global Vs Australia Y-o-Y Growth Comparison, 2021-2032

Figure 298: Australia Immunoassay Market Share Analysis (%), By Product, 2021 & 2032

Figure 299: Australia Immunoassay Market Share Analysis (%), By Assay, 2021 & 2032

Figure 300: Australia Immunoassay Market Share Analysis (%), By Purpose, 2021 & 2032

Figure 301: Australia Immunoassay Market Share Analysis (%), By Specimen, 2021 & 2032

Figure 302: Australia Immunoassay Market Share Analysis (%), By Application, 2021 & 2032

Figure 303: Australia Immunoassay Market Share Analysis (%), By End User, 2021 & 2032

Figure 304: New Zealand Market Value Proportion Analysis, 2021

Figure 305: Global Vs New Zealand Y-o-Y Growth Comparison, 2021-2032

Figure 306: New Zealand Immunoassay Market Share Analysis (%), By Product, 2021 & 2032

Figure 307: New Zealand Immunoassay Market Share Analysis (%), By Assay, 2021 & 2032

Figure 308: New Zealand Immunoassay Market Share Analysis (%), By Purpose, 2021 & 2032

Figure 309: New Zealand Immunoassay Market Share Analysis (%), By Specimen, 2021 & 2032

Figure 310: New Zealand Immunoassay Market Share Analysis (%), By Application, 2021 & 2032

Figure 311: New Zealand Immunoassay Market Share Analysis (%), By End User, 2021 & 2032

Figure 312: Middle East and Africa (MEA) Immunoassay Market Share Analysis (%), By Country (2022)

Figure 313: Middle East and Africa (MEA) Immunoassay Market Share Analysis (%), By Product (2022)

Figure 314: Middle East and Africa (MEA) Immunoassay Market Share Analysis (%), By Assay (2022)

Figure 315: Middle East and Africa (MEA) Immunoassay Market Share Analysis (%), By Purpose (2022)

Figure 316: Middle East and Africa (MEA) Immunoassay Market Share Analysis (%), By Specimen (2022)

Figure 317: Middle East and Africa (MEA) Immunoassay Market Share Analysis (%), By Application (2022)

Figure 318: Middle East and Africa (MEA) Immunoassay Market Share Analysis (%), By End User (2022)

Figure 319: Middle East and Africa (MEA) Immunoassay Historical Market Value (US$ Bn) Analysis, 2012–2021

Figure 320: Middle East and Africa (MEA) Immunoassay Current and Future Market Value (US$ Bn), 2022-2032 & Y-o-Y Growth Trend Analysis

Figure 321: Middle East and Africa (MEA) Immunoassay Market Attractiveness Analysis, By Country

Figure 322: Middle East and Africa (MEA) Immunoassay Market Attractiveness Analysis, By Product

Figure 323: Middle East and Africa (MEA) Immunoassay Market Attractiveness Analysis, By Assay

Figure 324: Middle East and Africa (MEA) Immunoassay Market Attractiveness Analysis, By Purpose

Figure 325: Middle East and Africa (MEA) Immunoassay Market Attractiveness Analysis, By Specimen

Figure 326: Middle East and Africa (MEA) Immunoassay Market Attractiveness Analysis, By Application

Figure 327: Middle East and Africa (MEA) Immunoassay Market Attractiveness Analysis, By End User

Figure 328: Turkey Market Value Proportion Analysis, 2021

Figure 329: Global Vs Turkey Y-o-Y Growth Comparison, 2021-2032

Figure 330: Turkey Immunoassay Market Share Analysis (%), By Product, 2021 & 2032

Figure 331: Turkey Immunoassay Market Share Analysis (%), By Assay, 2021 & 2032

Figure 332: Turkey Immunoassay Market Share Analysis (%), By Purpose, 2021 & 2032

Figure 333: Turkey Immunoassay Market Share Analysis (%), By Specimen, 2021 & 2032

Figure 334: Turkey Immunoassay Market Share Analysis (%), By Application, 2021 & 2032

Figure 335: Turkey Immunoassay Market Share Analysis (%), By End User, 2021 & 2032

Figure 336: Egypt Market Value Proportion Analysis, 2021

Figure 337: Global Vs Egypt Y-o-Y Growth Comparison, 2021-2032

Figure 338: Egypt Immunoassay Market Share Analysis (%), By Product, 2021 & 2032

Figure 339: Egypt Immunoassay Market Share Analysis (%), By Assay, 2021 & 2032

Figure 340: Egypt Immunoassay Market Share Analysis (%), By Purpose, 2021 & 2032

Figure 341: Egypt Immunoassay Market Share Analysis (%), By Specimen, 2021 & 2032

Figure 342: Egypt Immunoassay Market Share Analysis (%), By Application, 2021 & 2032

Figure 343: Egypt Immunoassay Market Share Analysis (%), By End User, 2021 & 2032

Figure 344: GCC Countries Market Value Proportion Analysis, 2021

Figure 345: Global Vs GCC Countries Y-o-Y Growth Comparison, 2021-2032

Figure 346: GCC Countries Immunoassay Market Share Analysis (%), By Product, 2021 & 2032

Figure 347: GCC Countries Immunoassay Market Share Analysis (%), By Assay, 2021 & 2032

Figure 348: GCC Countries Immunoassay Market Share Analysis (%), By Purpose, 2021 & 2032

Figure 349: GCC Countries Immunoassay Market Share Analysis (%), By Specimen, 2021 & 2032

Figure 350: GCC Countries Immunoassay Market Share Analysis (%), By Application, 2021 & 2032

Figure 351: GCC Countries Immunoassay Market Share Analysis (%), By End User, 2021 & 2032

Figure 352: North Africa Market Value Proportion Analysis, 2021

Figure 353: Global Vs North Africa Y-o-Y Growth Comparison, 2021-2032

Figure 354: North Africa Immunoassay Market Share Analysis (%), By Product, 2021 & 2032

Figure 355: North Africa Immunoassay Market Share Analysis (%), By Assay, 2021 & 2032

Figure 356: North Africa Immunoassay Market Share Analysis (%), By Purpose, 2021 & 2032

Figure 357: North Africa Immunoassay Market Share Analysis (%), By Specimen, 2021 & 2032

Figure 358: North Africa Immunoassay Market Share Analysis (%), By Application, 2021 & 2032

Figure 359: North Africa Immunoassay Market Share Analysis (%), By End User, 2021 & 2032

Figure 360: South Africa Market Value Proportion Analysis, 2021

Figure 361: Global Vs South Africa Y-o-Y Growth Comparison, 2021-2032

Figure 362: South Africa Immunoassay Market Share Analysis (%), By Product, 2021 & 2032

Figure 363: South Africa Immunoassay Market Share Analysis (%), By Assay, 2021 & 2032

Figure 364: South Africa Immunoassay Market Share Analysis (%), By Purpose, 2021 & 2032

Figure 365: South Africa Immunoassay Market Share Analysis (%), By Specimen, 2021 & 2032

Figure 366: South Africa Immunoassay Market Share Analysis (%), By Application, 2021 & 2032

Figure 367: South Africa Immunoassay Market Share Analysis (%), By End User, 2021 & 2032

Recommendations

Healthcare

Americas COVID-19 Testing Market

Published : January 2023

Healthcare

COVID-19 Saliva Sampling Test Potential Market

Published : June 2022

Healthcare

Covid-19 Vaccine Development Tools Market

Published : May 2022

Healthcare

Covid-19 Diagnostics Market

Published : August 2020

Explore Healthcare Insights

View Reports

Coronavirus Immunoassay Market