Reports

- Global Locations -

Headquarters

Future Market Insights, Inc.

Christiana Corporate, 200
Continental Drive, Suite 401,
Newark, Delaware - 19713,
United States

T: +1-845-579-5705

Americas

Future Market Insights, Inc.

616 Corporate Way, Suite 2-9018,
Valley Cottage, NY 10989, United States

T: +1-347-918-3531

MEA

Future Market Insights

1602-6 Jumeirah Bay X2 Tower, Plot No: JLT-PH2-X2A,
Jumeirah Lakes Towers, Dubai,
United Arab Emirates

Europe

Future Market Insights

3rd Floor, 207 Regent Street,
W1B 3HH London
United Kingdom

T: + 44 (0) 20 8123 9659
D: +44 (0) 20 3287 4268

Asia Pacific

Future Market Insights

IndiaLand Global Tech Park, Unit UG-1, Behind Grand HighStreet, Phase 1, Hinjawadi, MH, Pune – 411057, India

Immunoassay Market Outlook (2022-2032)

[342 Pages Report] The global immunoassay market is expected to be worth USD 45.78 billion by 2032, growing at a CAGR of 5% from its current value of USD 29.51 billion in 2022.

  • Increased prevalence of chronic and infectious diseases, as well as increased awareness of early disease detection
  • Immunoassay market analysis reveals higher growth prospects due to increased awareness of new viruses and diseases that necessitate higher antibody levels in the body.
  • Demand for immunoassay tests is increasing as the government's hospitals, clinics, and research and development centres consume the most from the market.
  • Rising awareness, government research and development programmes, and the spread of covid-19 have all contributed to an increase in demand for antibody testing systems.

The immunoassay market has been impacted by the market's demanding regulatory frameworks for immunoassay product approval, as well as the technical challenges of immunoassay products and reagents. Due to the pervasive diagnosis of COVID-19, the immunoassay market in numerous countries has expanded dramatically throughout the epidemic. Furthermore, as the number of COVID-19 cases increases in the third wave, the immunoassay market is anticipated to expand even more.

Attribute Details
Immunoassay Market Size (2022E) USD 29.51 Bn
Immunoassay Market Projected Size (2032F) USD 45.78 Bn
Value CAGR (2021-2031) 5% CAGR

Don't pay for what you don't need

Customize your report by selecting specific countries or regions and save 30%!

Asia-Pacific is Deemed to be the Fastest Booming Market for Immunoassays

According to a global market research report on immunoassay, Asia-Pacific is the fastest growing region in the market. The higher CAGR is attributed to governments in China and India investing large sums of money in the advancement of the healthcare sector, including the construction of new hospitals and clinics as well as the redefining of diagnostic practises.

The covid-19 and its wave had a negative impact on the region, fueling sales of immunoassay testing kits. Due to its large geriatric population and high prevalence of infectious diseases, Asia Pacific is expected to be the fastest-growing immunoassay market during the forecast period. One of the factors driving the immunoassay market in the region is the growing adoption of innovative laboratory techniques and procedures for faster investigation and diagnosis of infectious and chronic disorders. These are the consequences of a sedentary lifestyle among children.

Immunoassay Market in North America is Constantly Evolving

According to the immunoassay market demand analysis, the largest market share of 35% in 2022 is expected to hold the same position throughout the forecast period. The rising demand is attributed to an increase in cancer incidence and the ease of access to technologically advanced diagnostic techniques. Infectious disease outbreaks are becoming more common in the region.

The introduction of molecular kits, as well as an increase in the sales of reagents and kits, are also driving demand for immunoassay testing kits. This is due to the rise in infectious and chronic diseases, as well as the geriatric population, becoming infected as a result of them.

Sabyasachi Ghosh
Sabyasachi Ghosh

Principal Consultant

Talk to Analyst

Find your sweet spots for generating winning opportunities in this market.

Product Introductions and Expansions Keep Routine Episodes in the Market

Abbott Laboratories focuses on chia technology and offers the Abbott prism, an automatic immunoassay analyzer. It is very effective for blood screening and produces useful results. Other benefits of these systems include cGMP compliance, error reduction due to the network's resistance to tampering, increased lab productivity, and reduced human involvement because the system handles routine details such as monitoring, processing, and documentation.

Siemens Healthineers announced on November 2020 that its SARS-CoV-2 IgG Antibody Test has demonstrated to evaluate neutralising antibodies and has received CE Marking. This test is an upgraded version of the previously released COVID-19 antibody test.

Suzhou Hybiome Biomedical Engineering Co. Ltd. was acquired by bioMérieux in November 2018 for a majority stake. This acquisition is expected to boost the company's presence in the Chinese market.

What's the Outlook Comparison of Historic and Future Data for Immunoassay Market?

Global study on immunoassay market states that the dynamic shift from the last forecast period (2017-2021) to the current forecast period (2022-2032) is significant. The major factors that have shaped the growth dynamics are the advent of covid-19, the geriatric population, and rising awareness around health. The last forecast period held a higher CAGR as it was hit by a global pandemic. Covid-19 pushed governments to invest huge capital into antigen and antibody tests like immunoassay. Tests like SARS-Cov-2 antibodies tests pushed the market up.

This fueled the market’s growth prospects and brought opportunities for the new medical and healthcare market players to come up with the latest technology and integrate it with immunoassay technology. Furthermore, the breakdown of the third covid-19 wave has partially slowed down the growth of the market as the spread is at lower levels. The market is now growing at a slightly low CAGR but is expected to expand its market space due to the rising awareness and antibodies check-up post-vaccination.

Get the data you need at a Fraction of the cost

Personalize your report by choosing insights you need
and save 40%!

Future Outlook

With the environment changing and climate change-based diseases and viruses growing in the urban and rural areas, the demand for vaccines is on a rise. The immunoassay market survey explains that the tests of the effectiveness of these vaccines are conducted through immunoassays tests that include the strength of antibodies in the immune system, fueling the sales of immunoassay testing kits. New small and easy home immunoassay tests manufactured through various healthcare brands are helping transform the antibodies detection testing technology. For example: SGTi-flex Covid-19 IgG, Rapid COVID-19 IgM/IgG Combo Test Kit, and QUANTA Flash SARS-CoV-2 igG.

What are the major growth drivers for Immunoassay Market?

Covid-19, Vaccines R&D along with higher penetration of chronic diseases amongst geriatric population fuels the immunoassay market’s pace.

Immunoassay market analysis displays the higher growth prospects due to the higher awareness of the new viruses and diseases that demand for higher antibodies in the body. An immunoassay test gives you information about the antibodies present in the body for any specific virus or disease spread by it. Demand for immunoassay tests rises as the hospitals, clinics, and research and development centers established by the government are consuming the most from the market.

The latest technology integrates Artificial Intelligence and advanced healthcare and diagnostic technology. For instance, home care units (Covid-19) include the antigen and antibody test kits that help the infected or vaccinated person to take the tests that help them analyze the improved immunity for any specific disease, thriving the sales of immunoassay tests globally. Also, regions like Asia Pacific includes India and China that are building their medical and healthcare infrastructure consume a huge chunk of immunoassay market.

What are the factors that restrict the growth of the Immunoassay Market?

The regulatory agencies in multiple nations restrict the sales of immunoassay instruments or limit their use of it in research and development centers or labs to prevent any misuse. Furthermore, the limitations associated with these instruments such as low antibody detection, false negative results, and other errors. Other than that, the high process of these immunoassay testing instruments is hindering the market’s growth.

The misinterpretation and the complex earlier immunoassay systems have made it hard for the end users to operate their systems in a good manner, hampering the demand for immunoassay testing kits.

Immunoassay Market:

Attributes Immunoassay Market
CAGR (2022 to 2032) 5%
Market Value (2022) US$ 29.51 Billion
Growth Factor The advent of Covid-19, new healthcare and diagnostics technology, and rising awareness around the application of immunoassay instruments and kits.
Future Opportunities The market holds multiple opportunities for the new market players who come with the latest healthcare technologically driven products, government schemes in the healthcare innovation and startups also fuels the market growth.
Market Trends The new kits that have higher detection capabilities and are logistic friendly are shaping the market trends for the immunoassay market.

Covid-19 Testing Kit Market:

Attributes Covid-19 Testing Kit Market
CAGR (2022 to 2032) 7%
Market Value (2022) US$ 71.47 Billion
Growth Factor Covid-19 has impacted most of the markets globally. Its own diagnostic market has skyrocketed with its advent along with the growing cases of covid-19 all around the world.
Future Opportunities The opportunities that the market brings involve nano diagnostic technology that detects the virus more effectively. Manufacturers using it for enhanced accuracy is fueling the sales of covid-19 testing kits.
Market Trends As the spread and its intensity gets lower the use of these kits become less common, the use of these devices in research and development of drugs are setting up trends for the market.

Blood Glucose Monitoring Devices Market:

Attributes Blood Glucose Monitoring Devices Market
CAGR (2022 to 2032) 7.8%
Market Value (2022) US$ 12.61 Billion
Growth Factor The geriatric population and the higher number of blood-related cases along with the higher health awareness globally are fuelling the demand for blood glucose monitoring devices.
Future Opportunities Latest blood testing technology along with specific diabetes testing formats have created opportunities for the new markets to take interest and produce efficient, green and effective devices for the future.
Market Trends The application of these devices in the United States has skyrocketed as the number of diabetic patients, especially youngsters are rising and setting up the growth trends for the market.

Category-wise Insights

Which is the Leading Product Type of Immunoassay Market?

By product, reagents and kits accounted for 60% share of total revenue generated of the immunoassay market globally and is anticipated to hold the highest share by 2032. As the climate change spreads its space in the world and gives birth to new infectious and autoimmune diseases like Covid-19, Monkeypox etc., the applications of reagents and kits have increased. The approval and launch of novel immunoassayare likely to support the segment growth. Though the software and service segment hold the second position, owing to the cost-effective products, fueling the overall sales of immunoassay testing instrument.

Which Technology form of Immunoassay is Gaining Traction in the Market?

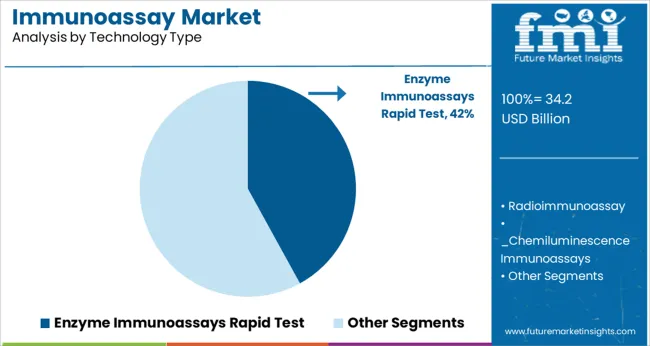
Immunoassay market opportunities rise with the EIA/ELISA technology that is gaining traction in the market with its higher use in reducing the assay time for immunoelectrophoretic and immunodiffusion while providing accurate and quantitive results. This segment holds around 60% of the global market share. Other than that, rapid test technology is more useful in the infections caused by salmonella, campylobacter, Zika and Listeria.

Which Application of Immunoassay is Gaining Traction in the Market?

By application, the infectious disease testing segment accounted for a 30% share of total revenue generated through the immunoassay market globally and is anticipated to hold the highest share by 2032. This growth is attributed to the high share can be attributed to the rise in the incidence of infectious diseases such as HIV, malaria, influenza, and the novel COVID-19.
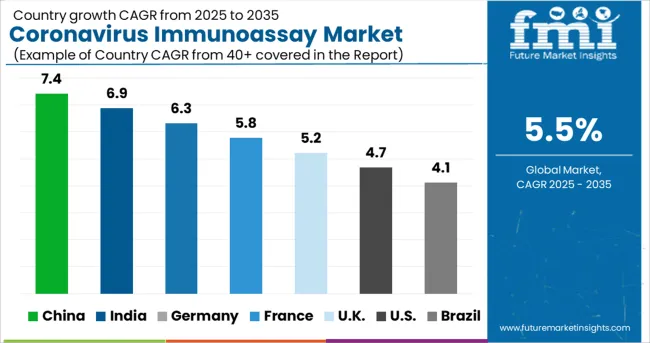
Country-wise Insights

How is the North American Immunoassay Market Shaping?

Immunoassay market demand analysis defines that the largest market share of 35% in 2022 and is forecasted to hold the same position during the forecast period. The rising demand is attributed to increase in the incidence of cancer and the easy availability of technologically advanced diagnostic techniques. Furthermore, an increasing number of incidences of infectious diseases in the region, like HIV, Influenza, and Tuberculosis.

Also, the introduction of molecular kits and the increase in the sales of reagents and kits used are also fueling the demand for immunoassay testing kits. This happens due to the rising infectious and chronic diseases and the geriatric population getting infected through them.

Why is Asia-Pacific considering the Fastest Growing Market for Immunoassay Market?

Global market research report on immunoassay records the Asia-Pacific region as the fastest growing region in the market. The higher CAGR is attributed to the governments in China and India investing huge amounts of capital in the advancement of the healthcare sector, building new hospitals and clinics while redefining its diagnostics practices. The covid-19 and its wave did hit the region adversely, fueling the sales of immunoassay testing kits in the region. Furthermore, the expected hike in the demand for immunoassay kits with the rapidly increasing geriatric population and chronic diseases amongst them. These are the outcomes of the inactive lifestyle amongst youngsters.
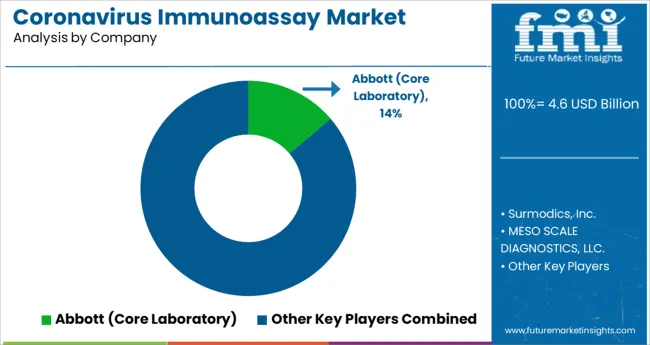
Competitive Landscape

New market research report on immunoassay defines the market space as a younger space where there is a space for innovation and technology. The defining factors key players have are the ability to deliver effective and accurate results while making the end product more logistics friendly and easy to use.

  • Siemens Healthineers has introduced its latest and revised fully automated immunoassay platforms and a comprehensive and disease-specific chart in excess of 100 tests. This enhanced productivity and efficiency while delivers accurate and faster results.
  • Biomerieux, with more than 26000 immunoassay systems globally has introduced its R7D programs that covers high medical value applications, increased automation and decentralized testing, flourishing the sales of immunoassay platforms.
  • Abbott Laboratories focuses on chia technology and offers an automatic immunoassay analyzer named Abbott prism, delivers effectiveness and enhances productivity.

Scope of the Report

Attribute Details
CAGR (2022-2032) 5.0%
Forecast Period 2022 to 2032
Historical Data Available for 2017 to 2021
Market Analysis USD Bn for Value and Mn. Sq. M. for Volume
Key Regions Covered North America, Latin America, Europe, East Asia, South Asia, and the Middle East & Africa
Key Countries Covered USA, Brazil, Mexico, Germany, UK, China, India, Japan, Australia, and GCC Countries
Key Segments Covered Product, Technology, Application, End-use and Region
Key Companies Profiled
  • Siemens Healthineers
  • BioMérieux SA
  • Abbott Laboratories
  • Danaher Corporation (Beckman Coulter)
  • Quidel Corporation
  • Ortho Clinical Diagnostics
  • Sysmex Corporation
  • Bio-Rad Laboratories, Inc.
  • Becton, Dickinson and Company
  • F. Hoffmann-La Roche AG
  • Thermo Fisher Scientific, Inc
Report Coverage Market Forecast, Company Share Analysis, Competition Intelligence, DROT Analysis, Market Dynamics and Challenges, and Strategic Growth Initiatives
Customization & Pricing Available upon Request

Immunoassay Market by Category

By Product, Immunoassay Market is Segmented as:

  • Reagents & Kits
  • Analyzers/Instruments
    • Open-ended Systems
    • Closed-ended Systems
  • Software & Services

By Technology, Immunoassay Market is Segmented as:

  • Radioimmunoassay (RIA)
  • Enzyme Immunoassays (EIA)Rapid Test
    • Chemiluminescence Immunoassays (CLIA)
    • Fluorescence Immunoassays (FIA)
  • Others

By End-use, Immunoassay Market is Segmented as:

  • Therapeutic Drug Monitoring
  • Oncology
  • Cardiology
  • Endocrinology
  • Infectious Disease Testing
  • Autoimmune Diseases

By Application, Immunoassay Market is Segmented as:

  • Hospitals
  • Blood Banks
  • Clinical Laboratories
  • Pharmaceutical and Biotech Companies
  • Academic Research Centers
  • Others

By Form, Immunoassay Market is Segmented as:

  • Natural Immunoassay
  • Synthetic Immunoassay

By Region, Immunoassay Market is Segmented as:

  • North America
  • Latin America
  • Europe
  • East Asia
  • South Asia
  • Oceania
  • MEA

Frequently Asked Questions

How much is the Global Market worth?

The global Immunoassay market is estimated to be worth over USD 29.51 Bn by 2022.

What is the demand outlook forecast for the Market Globally?

The Immunoassay market is forecasted to surpass USD 45.78 Bn by the end of 2032.

What is the market share of North American Immunoassay Market?

North American market holds 35.0% of the global immunoassay market share.

What is the market outlook of Immunoassay Market?

The immunoassay market is anticipated to grow at a CAGR of 5.0% through 2032.

Table of Content

1. Executive Summary

    1.1. Global Market Outlook

    1.2. Demand-side Trends

    1.3. Supply-side Trends

    1.4. Technology Roadmap Analysis

    1.5. Analysis and Recommendations

2. Market Overview

    2.1. Market Coverage / Taxonomy

    2.2. Market Definition / Scope / Limitations

3. Market Background

    3.1. Market Dynamics

        3.1.1. Drivers

        3.1.2. Restraints

        3.1.3. Opportunity

        3.1.4. Trends

    3.2. Scenario Forecast

        3.2.1. Demand in Optimistic Scenario

        3.2.2. Demand in Likely Scenario

        3.2.3. Demand in Conservative Scenario

    3.3. Opportunity Map Analysis

    3.4. Investment Feasibility Matrix

    3.5. PESTLE and Porter’s Analysis

    3.6. Regulatory Landscape

        3.6.1. By Key Regions

        3.6.2. By Key Countries

    3.7. Regional Parent Market Outlook

4. Global Market Analysis 2017-2021 and Forecast, 2022-2032

    4.1. Historical Market Size Value (US$ Mn) Analysis, 2017-2021

    4.2. Current and Future Market Size Value (US$ Mn) Projections, 2022-2032

        4.2.1. Y-o-Y Growth Trend Analysis

        4.2.2. Absolute $ Opportunity Analysis

5. Global Market Analysis 2017-2021 and Forecast 2022-2032, By Product

    5.1. Introduction / Key Findings

    5.2. Historical Market Size Value (US$ Mn) Analysis By Product, 2017-2021

    5.3. Current and Future Market Size Value (US$ Mn) Analysis and Forecast By Product, 2022-2032

        5.3.1. Reagents & Kits

        5.3.2. Analyzers/Instruments

            5.3.2.1. Open-ended Systems

            5.3.2.2. Closed-ended Systems

        5.3.3. Software & Services

    5.4. Y-o-Y Growth Trend Analysis By Product, 2017-2021

    5.5. Absolute $ Opportunity Analysis By Product, 2022-2032

6. Global Market Analysis 2017-2021 and Forecast 2022-2032, By Technology

    6.1. Introduction / Key Findings

    6.2. Historical Market Size Value (US$ Mn) Analysis By Technology, 2017-2021

    6.3. Current and Future Market Size Value (US$ Mn) Analysis and Forecast By Technology, 2022-2032

        6.3.1. Radioimmunoassay

        6.3.2. Enzyme Immunoassays Rapid Test

            6.3.2.1. Chemiluminescence Immunoassays

            6.3.2.2. Fluorescence Immunoassays

        6.3.3. Others

    6.4. Y-o-Y Growth Trend Analysis By Technology, 2017-2021

    6.5. Absolute $ Opportunity Analysis By Technology, 2022-2032

7. Global Market Analysis 2017-2021 and Forecast 2022-2032, By Application

    7.1. Introduction / Key Findings

    7.2. Historical Market Size Value (US$ Mn) Analysis By Application , 2017-2021

    7.3. Current and Future Market Size Value (US$ Mn) Analysis and Forecast By Application , 2022-2032

        7.3.1. Therapeutic Drug Monitoring

        7.3.2. Oncology

        7.3.3. Cardiology

        7.3.4. Endocrinology

        7.3.5. Infectious Disease Testing

        7.3.6. Autoimmune Diseases

        7.3.7. Other Applications

    7.4. Y-o-Y Growth Trend Analysis By Application , 2017-2021

    7.5. Absolute $ Opportunity Analysis By Application , 2022-2032

8. Global Market Analysis 2017-2021 and Forecast 2022-2032, By End-use

    8.1. Introduction / Key Findings

    8.2. Historical Market Size Value (US$ Mn) Analysis By End-use, 2017-2021

    8.3. Current and Future Market Size Value (US$ Mn) Analysis and Forecast By End-use, 2022-2032

        8.3.1. Hospitals

        8.3.2. Blood Banks

        8.3.3. Clinical Laboratories

        8.3.4. Pharmaceutical and Biotech Companies

        8.3.5. Academic Research Centers

        8.3.6. Others

    8.4. Y-o-Y Growth Trend Analysis By End-use, 2017-2021

    8.5. Absolute $ Opportunity Analysis By End-use, 2022-2032

9. Global Market Analysis 2017-2021 and Forecast 2022-2032, By Region

    9.1. Introduction

    9.2. Historical Market Size Value (US$ Mn) Analysis By Region, 2017-2021

    9.3. Current Market Size Value (US$ Mn) Analysis and Forecast By Region, 2022-2032

        9.3.1. North America

        9.3.2. Latin America

        9.3.3. Europe

        9.3.4. Asia Pacific

        9.3.5. MEA

    9.4. Market Attractiveness Analysis By Region

10. North America Market Analysis 2017-2021 and Forecast 2022-2032, By Country

    10.1. Historical Market Size Value (US$ Mn) Trend Analysis By Market Taxonomy, 2017-2021

    10.2. Market Size Value (US$ Mn) Forecast By Market Taxonomy, 2022-2032

        10.2.1. By Country

            10.2.1.1. U.S.

            10.2.1.2. Canada

        10.2.2. By Product

        10.2.3. By Technology

        10.2.4. By Application

        10.2.5. By End-use

    10.3. Market Attractiveness Analysis

        10.3.1. By Country

        10.3.2. By Product

        10.3.3. By Technology

        10.3.4. By Application

        10.3.5. By End-use

    10.4. Key Takeaways

11. Latin America Market Analysis 2017-2021 and Forecast 2022-2032, By Country

    11.1. Historical Market Size Value (US$ Mn) Trend Analysis By Market Taxonomy, 2017-2021

    11.2. Market Size Value (US$ Mn) Forecast By Market Taxonomy, 2022-2032

        11.2.1. By Country

            11.2.1.1. Brazil

            11.2.1.2. Mexico

            11.2.1.3. Rest of Latin America

        11.2.2. By Product

        11.2.3. By Technology

        11.2.4. By Application

        11.2.5. By End-use

    11.3. Market Attractiveness Analysis

        11.3.1. By Country

        11.3.2. By Product

        11.3.3. By Technology

        11.3.4. By Application

        11.3.5. By End-use

    11.4. Key Takeaways

12. Europe Market Analysis 2017-2021 and Forecast 2022-2032, By Country

    12.1. Historical Market Size Value (US$ Mn) Trend Analysis By Market Taxonomy, 2017-2021

    12.2. Market Size Value (US$ Mn) Forecast By Market Taxonomy, 2022-2032

        12.2.1. By Country

            12.2.1.1. Germany

            12.2.1.2. U.K.

            12.2.1.3. France

            12.2.1.4. Spain

            12.2.1.5. Italy

            12.2.1.6. Rest of Europe

        12.2.2. By Product

        12.2.3. By Technology

        12.2.4. By Application

        12.2.5. By End-use

    12.3. Market Attractiveness Analysis

        12.3.1. By Country

        12.3.2. By Product

        12.3.3. By Technology

        12.3.4. By Application

        12.3.5. By End-use

    12.4. Key Takeaways

13. Asia Pacific Market Analysis 2017-2021 and Forecast 2022-2032, By Country

    13.1. Historical Market Size Value (US$ Mn) Trend Analysis By Market Taxonomy, 2017-2021

    13.2. Market Size Value (US$ Mn) Forecast By Market Taxonomy, 2022-2032

        13.2.1. By Country

            13.2.1.1. China

            13.2.1.2. Japan

            13.2.1.3. South Korea

            13.2.1.4. India

            13.2.1.5. Malaysia

            13.2.1.6. Singapore

            13.2.1.7. Australia

            13.2.1.8. New Zealand

            13.2.1.9. Rest of APAC

        13.2.2. By Product

        13.2.3. By Technology

        13.2.4. By Application

        13.2.5. By End-use

    13.3. Market Attractiveness Analysis

        13.3.1. By Country

        13.3.2. By Product

        13.3.3. By Technology

        13.3.4. By Application

        13.3.5. By End-use

    13.4. Key Takeaways

14. MEA Market Analysis 2017-2021 and Forecast 2022-2032, By Country

    14.1. Historical Market Size Value (US$ Mn) Trend Analysis By Market Taxonomy, 2017-2021

    14.2. Market Size Value (US$ Mn) Forecast By Market Taxonomy, 2022-2032

        14.2.1. By Country

            14.2.1.1. GCC Countries

            14.2.1.2. South Africa

            14.2.1.3. Israel

            14.2.1.4. Rest of MEA

        14.2.2. By Product

        14.2.3. By Technology

        14.2.4. By Application

        14.2.5. By End-use

    14.3. Market Attractiveness Analysis

        14.3.1. By Country

        14.3.2. By Product

        14.3.3. By Technology

        14.3.4. By Application

        14.3.5. By End-use

    14.4. Key Takeaways

15. Key Countries Market Analysis

    15.1. U.S.

        15.1.1. Pricing Analysis

        15.1.2. Market Share Analysis, 2021

            15.1.2.1. By Product

            15.1.2.2. By Technology

            15.1.2.3. By Application

            15.1.2.4. By End-use

    15.2. Canada

        15.2.1. Pricing Analysis

        15.2.2. Market Share Analysis, 2021

            15.2.2.1. By Product

            15.2.2.2. By Technology

            15.2.2.3. By Application

            15.2.2.4. By End-use

    15.3. Brazil

        15.3.1. Pricing Analysis

        15.3.2. Market Share Analysis, 2021

            15.3.2.1. By Product

            15.3.2.2. By Technology

            15.3.2.3. By Application

            15.3.2.4. By End-use

    15.4. Mexico

        15.4.1. Pricing Analysis

        15.4.2. Market Share Analysis, 2021

            15.4.2.1. By Product

            15.4.2.2. By Technology

            15.4.2.3. By Application

            15.4.2.4. By End-use

    15.5. Germany

        15.5.1. Pricing Analysis

        15.5.2. Market Share Analysis, 2021

            15.5.2.1. By Product

            15.5.2.2. By Technology

            15.5.2.3. By Application

            15.5.2.4. By End-use

    15.6. U.K.

        15.6.1. Pricing Analysis

        15.6.2. Market Share Analysis, 2021

            15.6.2.1. By Product

            15.6.2.2. By Technology

            15.6.2.3. By Application

            15.6.2.4. By End-use

    15.7. France

        15.7.1. Pricing Analysis

        15.7.2. Market Share Analysis, 2021

            15.7.2.1. By Product

            15.7.2.2. By Technology

            15.7.2.3. By Application

            15.7.2.4. By End-use

    15.8. Spain

        15.8.1. Pricing Analysis

        15.8.2. Market Share Analysis, 2021

            15.8.2.1. By Product

            15.8.2.2. By Technology

            15.8.2.3. By Application

            15.8.2.4. By End-use

    15.9. Italy

        15.9.1. Pricing Analysis

        15.9.2. Market Share Analysis, 2021

            15.9.2.1. By Product

            15.9.2.2. By Technology

            15.9.2.3. By Application

            15.9.2.4. By End-use

    15.10. China

        15.10.1. Pricing Analysis

        15.10.2. Market Share Analysis, 2021

            15.10.2.1. By Product

            15.10.2.2. By Technology

            15.10.2.3. By Application

            15.10.2.4. By End-use

    15.11. Japan

        15.11.1. Pricing Analysis

        15.11.2. Market Share Analysis, 2021

            15.11.2.1. By Product

            15.11.2.2. By Technology

            15.11.2.3. By Application

            15.11.2.4. By End-use

    15.12. South Korea

        15.12.1. Pricing Analysis

        15.12.2. Market Share Analysis, 2021

            15.12.2.1. By Product

            15.12.2.2. By Technology

            15.12.2.3. By Application

            15.12.2.4. By End-use

    15.13. Malaysia

        15.13.1. Pricing Analysis

        15.13.2. Market Share Analysis, 2021

            15.13.2.1. By Product

            15.13.2.2. By Technology

            15.13.2.3. By Application

            15.13.2.4. By End-use

    15.14. Singapore

        15.14.1. Pricing Analysis

        15.14.2. Market Share Analysis, 2021

            15.14.2.1. By Product

            15.14.2.2. By Technology

            15.14.2.3. By Application

            15.14.2.4. By End-use

    15.15. Australia

        15.15.1. Pricing Analysis

        15.15.2. Market Share Analysis, 2021

            15.15.2.1. By Product

            15.15.2.2. By Technology

            15.15.2.3. By Application

            15.15.2.4. By End-use

    15.16. New Zealand

        15.16.1. Pricing Analysis

        15.16.2. Market Share Analysis, 2021

            15.16.2.1. By Product

            15.16.2.2. By Technology

            15.16.2.3. By Application

            15.16.2.4. By End-use

    15.17. GCC Countries

        15.17.1. Pricing Analysis

        15.17.2. Market Share Analysis, 2021

            15.17.2.1. By Product

            15.17.2.2. By Technology

            15.17.2.3. By Application

            15.17.2.4. By End-use

    15.18. South Africa

        15.18.1. Pricing Analysis

        15.18.2. Market Share Analysis, 2021

            15.18.2.1. By Product

            15.18.2.2. By Technology

            15.18.2.3. By Application

            15.18.2.4. By End-use

    15.19. Israel

        15.19.1. Pricing Analysis

        15.19.2. Market Share Analysis, 2021

            15.19.2.1. By Product

            15.19.2.2. By Technology

            15.19.2.3. By Application

            15.19.2.4. By End-use

16. Market Structure Analysis

    16.1. Competition Dashboard

    16.2. Competition Benchmarking

    16.3. Market Share Analysis of Top Players

        16.3.1. By Regional

        16.3.2. By Product

        16.3.3. By Technology

        16.3.4. By Application

        16.3.5. By End-use

17. Competition Analysis

    17.1. Competition Deep Dive

        17.1.1. Siemens Healthineers

            17.1.1.1. Overview

            17.1.1.2. Product Portfolio

            17.1.1.3. Profitability by Market Segments

            17.1.1.4. Sales Footprint

            17.1.1.5. Strategy Overview

                17.1.1.5.1. Marketing Strategy

        17.1.2. bioMérieux SA

            17.1.2.1. Overview

            17.1.2.2. Product Portfolio

            17.1.2.3. Profitability by Market Segments

            17.1.2.4. Sales Footprint

            17.1.2.5. Strategy Overview

                17.1.2.5.1. Marketing Strategy

        17.1.3. Abbott Laboratories

            17.1.3.1. Overview

            17.1.3.2. Product Portfolio

            17.1.3.3. Profitability by Market Segments

            17.1.3.4. Sales Footprint

            17.1.3.5. Strategy Overview

                17.1.3.5.1. Marketing Strategy

        17.1.4. Danaher Corporation

            17.1.4.1. Overview

            17.1.4.2. Product Portfolio

            17.1.4.3. Profitability by Market Segments

            17.1.4.4. Sales Footprint

            17.1.4.5. Strategy Overview

                17.1.4.5.1. Marketing Strategy

        17.1.5. Quidel Corporation

            17.1.5.1. Overview

            17.1.5.2. Product Portfolio

            17.1.5.3. Profitability by Market Segments

            17.1.5.4. Sales Footprint

            17.1.5.5. Strategy Overview

                17.1.5.5.1. Marketing Strategy

        17.1.6. Ortho Clinical Diagnostics

            17.1.6.1. Overview

            17.1.6.2. Product Portfolio

            17.1.6.3. Profitability by Market Segments

            17.1.6.4. Sales Footprint

            17.1.6.5. Strategy Overview

                17.1.6.5.1. Marketing Strategy

        17.1.7. Sysmex Corporation

            17.1.7.1. Overview

            17.1.7.2. Product Portfolio

            17.1.7.3. Profitability by Market Segments

            17.1.7.4. Sales Footprint

            17.1.7.5. Strategy Overview

                17.1.7.5.1. Marketing Strategy

        17.1.8. Bio-Rad Laboratories, Inc.

            17.1.8.1. Overview

            17.1.8.2. Product Portfolio

            17.1.8.3. Profitability by Market Segments

            17.1.8.4. Sales Footprint

            17.1.8.5. Strategy Overview

                17.1.8.5.1. Marketing Strategy

        17.1.9. Becton, Dickinson, and Company

            17.1.9.1. Overview

            17.1.9.2. Product Portfolio

            17.1.9.3. Profitability by Market Segments

            17.1.9.4. Sales Footprint

            17.1.9.5. Strategy Overview

                17.1.9.5.1. Marketing Strategy

        17.1.10. F. Hoffmann-La Roche AG

            17.1.10.1. Overview

            17.1.10.2. Product Portfolio

            17.1.10.3. Profitability by Market Segments

            17.1.10.4. Sales Footprint

            17.1.10.5. Strategy Overview

                17.1.10.5.1. Marketing Strategy

        17.1.11. Thermo Fisher Scientific, Inc.

            17.1.11.1. Overview

            17.1.11.2. Product Portfolio

            17.1.11.3. Profitability by Market Segments

            17.1.11.4. Sales Footprint

            17.1.11.5. Strategy Overview

                17.1.11.5.1. Marketing Strategy

18. Assumptions & Acronyms Used

19. Research Methodology

Don't pay for what you don't need

Customize your report by selecting specific countries or regions and save 30%!

List of Tables

Table 1: Global Market Value (US$ Mn) Forecast by Region, 2017-2032

Table 2: Global Market Value (US$ Mn) Forecast by Product, 2017-2032

Table 3: Global Market Value (US$ Mn) Forecast by Technology, 2017-2032

Table 4: Global Market Value (US$ Mn) Forecast by Application, 2017-2032

Table 5: Global Market Value (US$ Mn) Forecast by End-use, 2017-2032

Table 6: North America Market Value (US$ Mn) Forecast by Country, 2017-2032

Table 7: North America Market Value (US$ Mn) Forecast by Product, 2017-2032

Table 8: North America Market Value (US$ Mn) Forecast by Technology, 2017-2032

Table 9: North America Market Value (US$ Mn) Forecast by Application, 2017-2032

Table 10: North America Market Value (US$ Mn) Forecast by End-use, 2017-2032

Table 11: Latin America Market Value (US$ Mn) Forecast by Country, 2017-2032

Table 12: Latin America Market Value (US$ Mn) Forecast by Product, 2017-2032

Table 13: Latin America Market Value (US$ Mn) Forecast by Technology, 2017-2032

Table 14: Latin America Market Value (US$ Mn) Forecast by Application, 2017-2032

Table 15: Latin America Market Value (US$ Mn) Forecast by End-use, 2017-2032

Table 16: Europe Market Value (US$ Mn) Forecast by Country, 2017-2032

Table 17: Europe Market Value (US$ Mn) Forecast by Product, 2017-2032

Table 18: Europe Market Value (US$ Mn) Forecast by Technology, 2017-2032

Table 19: Europe Market Value (US$ Mn) Forecast by Application, 2017-2032

Table 20: Europe Market Value (US$ Mn) Forecast by End-use, 2017-2032

Table 21: Asia Pacific Market Value (US$ Mn) Forecast by Country, 2017-2032

Table 22: Asia Pacific Market Value (US$ Mn) Forecast by Product, 2017-2032

Table 23: Asia Pacific Market Value (US$ Mn) Forecast by Technology, 2017-2032

Table 24: Asia Pacific Market Value (US$ Mn) Forecast by Application, 2017-2032

Table 25: Asia Pacific Market Value (US$ Mn) Forecast by End-use, 2017-2032

Table 26: MEA Market Value (US$ Mn) Forecast by Country, 2017-2032

Table 27: MEA Market Value (US$ Mn) Forecast by Product, 2017-2032

Table 28: MEA Market Value (US$ Mn) Forecast by Technology, 2017-2032

Table 29: MEA Market Value (US$ Mn) Forecast by Application, 2017-2032

Table 30: MEA Market Value (US$ Mn) Forecast by End-use, 2017-2032
Sabyasachi Ghosh
Sabyasachi Ghosh

Principal Consultant

Talk to Analyst

Find your sweet spots for generating winning opportunities in this market.

List of Charts

Figure 1: Global Market Value (US$ Mn) by Product, 2022-2032

Figure 2: Global Market Value (US$ Mn) by Technology, 2022-2032

Figure 3: Global Market Value (US$ Mn) by Application, 2022-2032

Figure 4: Global Market Value (US$ Mn) by End-use, 2022-2032

Figure 5: Global Market Value (US$ Mn) by Region, 2022-2032

Figure 6: Global Market Value (US$ Mn) Analysis by Region, 2017-2032

Figure 7: Global Market Value Share (%) and BPS Analysis by Region, 2022-2032

Figure 8: Global Market Y-o-Y Growth (%) Projections by Region, 2022-2032

Figure 9: Global Market Value (US$ Mn) Analysis by Product, 2017-2032

Figure 10: Global Market Value Share (%) and BPS Analysis by Product, 2022-2032

Figure 11: Global Market Y-o-Y Growth (%) Projections by Product, 2022-2032

Figure 12: Global Market Value (US$ Mn) Analysis by Technology, 2017-2032

Figure 13: Global Market Value Share (%) and BPS Analysis by Technology, 2022-2032

Figure 14: Global Market Y-o-Y Growth (%) Projections by Technology, 2022-2032

Figure 15: Global Market Value (US$ Mn) Analysis by Application, 2017-2032

Figure 16: Global Market Value Share (%) and BPS Analysis by Application, 2022-2032

Figure 17: Global Market Y-o-Y Growth (%) Projections by Application, 2022-2032

Figure 18: Global Market Value (US$ Mn) Analysis by End-use, 2017-2032

Figure 19: Global Market Value Share (%) and BPS Analysis by End-use, 2022-2032

Figure 20: Global Market Y-o-Y Growth (%) Projections by End-use, 2022-2032

Figure 21: Global Market Attractiveness by Product, 2022-2032

Figure 22: Global Market Attractiveness by Technology, 2022-2032

Figure 23: Global Market Attractiveness by Application, 2022-2032

Figure 24: Global Market Attractiveness by End-use, 2022-2032

Figure 25: Global Market Attractiveness by Region, 2022-2032

Figure 26: North America Market Value (US$ Mn) by Product, 2022-2032

Figure 27: North America Market Value (US$ Mn) by Technology, 2022-2032

Figure 28: North America Market Value (US$ Mn) by Application, 2022-2032

Figure 29: North America Market Value (US$ Mn) by End-use, 2022-2032

Figure 30: North America Market Value (US$ Mn) by Country, 2022-2032

Figure 31: North America Market Value (US$ Mn) Analysis by Country, 2017-2032

Figure 32: North America Market Value Share (%) and BPS Analysis by Country, 2022-2032

Figure 33: North America Market Y-o-Y Growth (%) Projections by Country, 2022-2032

Figure 34: North America Market Value (US$ Mn) Analysis by Product, 2017-2032

Figure 35: North America Market Value Share (%) and BPS Analysis by Product, 2022-2032

Figure 36: North America Market Y-o-Y Growth (%) Projections by Product, 2022-2032

Figure 37: North America Market Value (US$ Mn) Analysis by Technology, 2017-2032

Figure 38: North America Market Value Share (%) and BPS Analysis by Technology, 2022-2032

Figure 39: North America Market Y-o-Y Growth (%) Projections by Technology, 2022-2032

Figure 40: North America Market Value (US$ Mn) Analysis by Application, 2017-2032

Figure 41: North America Market Value Share (%) and BPS Analysis by Application, 2022-2032

Figure 42: North America Market Y-o-Y Growth (%) Projections by Application, 2022-2032

Figure 43: North America Market Value (US$ Mn) Analysis by End-use, 2017-2032

Figure 44: North America Market Value Share (%) and BPS Analysis by End-use, 2022-2032

Figure 45: North America Market Y-o-Y Growth (%) Projections by End-use, 2022-2032

Figure 46: North America Market Attractiveness by Product, 2022-2032

Figure 47: North America Market Attractiveness by Technology, 2022-2032

Figure 48: North America Market Attractiveness by Application, 2022-2032

Figure 49: North America Market Attractiveness by End-use, 2022-2032

Figure 50: North America Market Attractiveness by Country, 2022-2032

Figure 51: Latin America Market Value (US$ Mn) by Product, 2022-2032

Figure 52: Latin America Market Value (US$ Mn) by Technology, 2022-2032

Figure 53: Latin America Market Value (US$ Mn) by Application, 2022-2032

Figure 54: Latin America Market Value (US$ Mn) by End-use, 2022-2032

Figure 55: Latin America Market Value (US$ Mn) by Country, 2022-2032

Figure 56: Latin America Market Value (US$ Mn) Analysis by Country, 2017-2032

Figure 57: Latin America Market Value Share (%) and BPS Analysis by Country, 2022-2032

Figure 58: Latin America Market Y-o-Y Growth (%) Projections by Country, 2022-2032

Figure 59: Latin America Market Value (US$ Mn) Analysis by Product, 2017-2032

Figure 60: Latin America Market Value Share (%) and BPS Analysis by Product, 2022-2032

Figure 61: Latin America Market Y-o-Y Growth (%) Projections by Product, 2022-2032

Figure 62: Latin America Market Value (US$ Mn) Analysis by Technology, 2017-2032

Figure 63: Latin America Market Value Share (%) and BPS Analysis by Technology, 2022-2032

Figure 64: Latin America Market Y-o-Y Growth (%) Projections by Technology, 2022-2032

Figure 65: Latin America Market Value (US$ Mn) Analysis by Application, 2017-2032

Figure 66: Latin America Market Value Share (%) and BPS Analysis by Application, 2022-2032

Figure 67: Latin America Market Y-o-Y Growth (%) Projections by Application, 2022-2032

Figure 68: Latin America Market Value (US$ Mn) Analysis by End-use, 2017-2032

Figure 69: Latin America Market Value Share (%) and BPS Analysis by End-use, 2022-2032

Figure 70: Latin America Market Y-o-Y Growth (%) Projections by End-use, 2022-2032

Figure 71: Latin America Market Attractiveness by Product, 2022-2032

Figure 72: Latin America Market Attractiveness by Technology, 2022-2032

Figure 73: Latin America Market Attractiveness by Application, 2022-2032

Figure 74: Latin America Market Attractiveness by End-use, 2022-2032

Figure 75: Latin America Market Attractiveness by Country, 2022-2032

Figure 76: Europe Market Value (US$ Mn) by Product, 2022-2032

Figure 77: Europe Market Value (US$ Mn) by Technology, 2022-2032

Figure 78: Europe Market Value (US$ Mn) by Application, 2022-2032

Figure 79: Europe Market Value (US$ Mn) by End-use, 2022-2032

Figure 80: Europe Market Value (US$ Mn) by Country, 2022-2032

Figure 81: Europe Market Value (US$ Mn) Analysis by Country, 2017-2032

Figure 82: Europe Market Value Share (%) and BPS Analysis by Country, 2022-2032

Figure 83: Europe Market Y-o-Y Growth (%) Projections by Country, 2022-2032

Figure 84: Europe Market Value (US$ Mn) Analysis by Product, 2017-2032

Figure 85: Europe Market Value Share (%) and BPS Analysis by Product, 2022-2032

Figure 86: Europe Market Y-o-Y Growth (%) Projections by Product, 2022-2032

Figure 87: Europe Market Value (US$ Mn) Analysis by Technology, 2017-2032

Figure 88: Europe Market Value Share (%) and BPS Analysis by Technology, 2022-2032

Figure 89: Europe Market Y-o-Y Growth (%) Projections by Technology, 2022-2032

Figure 90: Europe Market Value (US$ Mn) Analysis by Application, 2017-2032

Figure 91: Europe Market Value Share (%) and BPS Analysis by Application, 2022-2032

Figure 92: Europe Market Y-o-Y Growth (%) Projections by Application, 2022-2032

Figure 93: Europe Market Value (US$ Mn) Analysis by End-use, 2017-2032

Figure 94: Europe Market Value Share (%) and BPS Analysis by End-use, 2022-2032

Figure 95: Europe Market Y-o-Y Growth (%) Projections by End-use, 2022-2032

Figure 96: Europe Market Attractiveness by Product, 2022-2032

Figure 97: Europe Market Attractiveness by Technology, 2022-2032

Figure 98: Europe Market Attractiveness by Application, 2022-2032

Figure 99: Europe Market Attractiveness by End-use, 2022-2032

Figure 100: Europe Market Attractiveness by Country, 2022-2032

Figure 101: Asia Pacific Market Value (US$ Mn) by Product, 2022-2032

Figure 102: Asia Pacific Market Value (US$ Mn) by Technology, 2022-2032

Figure 103: Asia Pacific Market Value (US$ Mn) by Application, 2022-2032

Figure 104: Asia Pacific Market Value (US$ Mn) by End-use, 2022-2032

Figure 105: Asia Pacific Market Value (US$ Mn) by Country, 2022-2032

Figure 106: Asia Pacific Market Value (US$ Mn) Analysis by Country, 2017-2032

Figure 107: Asia Pacific Market Value Share (%) and BPS Analysis by Country, 2022-2032

Figure 108: Asia Pacific Market Y-o-Y Growth (%) Projections by Country, 2022-2032

Figure 109: Asia Pacific Market Value (US$ Mn) Analysis by Product, 2017-2032

Figure 110: Asia Pacific Market Value Share (%) and BPS Analysis by Product, 2022-2032

Figure 111: Asia Pacific Market Y-o-Y Growth (%) Projections by Product, 2022-2032

Figure 112: Asia Pacific Market Value (US$ Mn) Analysis by Technology, 2017-2032

Figure 113: Asia Pacific Market Value Share (%) and BPS Analysis by Technology, 2022-2032

Figure 114: Asia Pacific Market Y-o-Y Growth (%) Projections by Technology, 2022-2032

Figure 115: Asia Pacific Market Value (US$ Mn) Analysis by Application, 2017-2032

Figure 116: Asia Pacific Market Value Share (%) and BPS Analysis by Application, 2022-2032

Figure 117: Asia Pacific Market Y-o-Y Growth (%) Projections by Application, 2022-2032

Figure 118: Asia Pacific Market Value (US$ Mn) Analysis by End-use, 2017-2032

Figure 119: Asia Pacific Market Value Share (%) and BPS Analysis by End-use, 2022-2032

Figure 120: Asia Pacific Market Y-o-Y Growth (%) Projections by End-use, 2022-2032

Figure 121: Asia Pacific Market Attractiveness by Product, 2022-2032

Figure 122: Asia Pacific Market Attractiveness by Technology, 2022-2032

Figure 123: Asia Pacific Market Attractiveness by Application, 2022-2032

Figure 124: Asia Pacific Market Attractiveness by End-use, 2022-2032

Figure 125: Asia Pacific Market Attractiveness by Country, 2022-2032

Figure 126: MEA Market Value (US$ Mn) by Product, 2022-2032

Figure 127: MEA Market Value (US$ Mn) by Technology, 2022-2032

Figure 128: MEA Market Value (US$ Mn) by Application, 2022-2032

Figure 129: MEA Market Value (US$ Mn) by End-use, 2022-2032

Figure 130: MEA Market Value (US$ Mn) by Country, 2022-2032

Figure 131: MEA Market Value (US$ Mn) Analysis by Country, 2017-2032

Figure 132: MEA Market Value Share (%) and BPS Analysis by Country, 2022-2032

Figure 133: MEA Market Y-o-Y Growth (%) Projections by Country, 2022-2032

Figure 134: MEA Market Value (US$ Mn) Analysis by Product, 2017-2032

Figure 135: MEA Market Value Share (%) and BPS Analysis by Product, 2022-2032

Figure 136: MEA Market Y-o-Y Growth (%) Projections by Product, 2022-2032

Figure 137: MEA Market Value (US$ Mn) Analysis by Technology, 2017-2032

Figure 138: MEA Market Value Share (%) and BPS Analysis by Technology, 2022-2032

Figure 139: MEA Market Y-o-Y Growth (%) Projections by Technology, 2022-2032

Figure 140: MEA Market Value (US$ Mn) Analysis by Application, 2017-2032

Figure 141: MEA Market Value Share (%) and BPS Analysis by Application, 2022-2032

Figure 142: MEA Market Y-o-Y Growth (%) Projections by Application, 2022-2032

Figure 143: MEA Market Value (US$ Mn) Analysis by End-use, 2017-2032

Figure 144: MEA Market Value Share (%) and BPS Analysis by End-use, 2022-2032

Figure 145: MEA Market Y-o-Y Growth (%) Projections by End-use, 2022-2032

Figure 146: MEA Market Attractiveness by Product, 2022-2032

Figure 147: MEA Market Attractiveness by Technology, 2022-2032

Figure 148: MEA Market Attractiveness by Application, 2022-2032

Figure 149: MEA Market Attractiveness by End-use, 2022-2032

Figure 150: MEA Market Attractiveness by Country, 2022-2032

Recommendations

Healthcare

Neuro Immunoassay Market

Published : July 2023

Healthcare

Coronavirus Immunoassay Market

Published : June 2022

Explore Healthcare Insights

View Reports