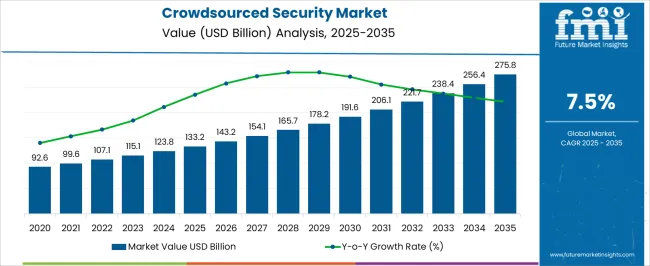
The Crowdsourced Security Market is estimated to be valued at USD 133.2 billion in 2025 and is projected to reach USD 275.8 billion by 2035, registering a compound annual growth rate (CAGR) of 7.5% over the forecast period.
| Metric | Value |
|---|---|
| Crowdsourced Security Market Estimated Value in (2025 E) | USD 133.2 billion |
| Crowdsourced Security Market Forecast Value in (2035 F) | USD 275.8 billion |
| Forecast CAGR (2025 to 2035) | 7.5% |
The crowdsourced security market is gaining traction as enterprises increasingly prioritize proactive vulnerability detection and agile risk management strategies. Growing cyber threats and the sophistication of attack techniques have compelled organizations to adopt diversified security approaches that extend beyond traditional in house testing models.
Crowdsourced platforms leverage a distributed network of ethical hackers to identify vulnerabilities in real time, thereby enhancing security coverage while optimizing cost efficiency. The rise of cloud infrastructure, digital transformation, and the expansion of remote operations have amplified the need for flexible and scalable security solutions.
Enterprises are further motivated by compliance requirements and the need for continuous monitoring across applications, systems, and networks. The market outlook remains positive as businesses of all sizes acknowledge the value of community driven intelligence to strengthen cybersecurity postures and ensure long term resilience against evolving threats.
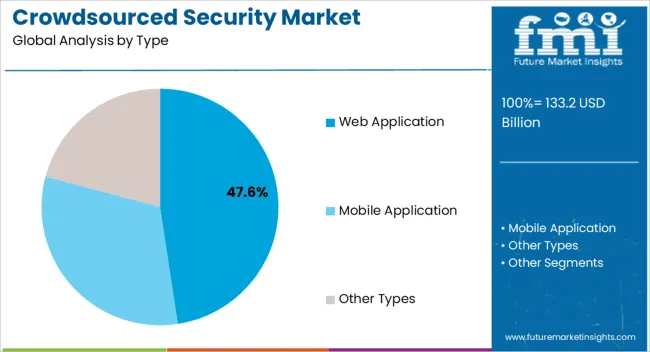
The web application segment is projected to account for 47.60% of total market revenue by 2025, making it the leading type category. This dominance is supported by the rapid proliferation of web based platforms, e commerce portals, and digital services that are increasingly exposed to security risks.
Organizations rely on crowdsourced testing to detect vulnerabilities such as cross site scripting, SQL injection, and session hijacking before they can be exploited by malicious actors. Continuous usage of web applications in customer engagement and digital transactions has elevated their significance, driving investment in specialized testing.
The ability to conduct scalable and real time assessments has reinforced the preference for web application security, consolidating its leading share within the type segment.
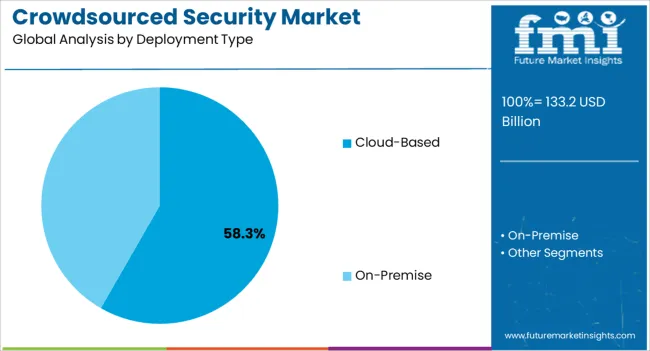
The cloud based segment is expected to capture 58.30% of overall revenue within deployment type, positioning it as the dominant approach. Its leadership is attributed to the widespread migration of enterprise workloads and applications to cloud environments that demand agile and scalable security solutions.
Cloud based deployment enables cost effectiveness, faster implementation, and seamless collaboration with distributed security researchers. Enhanced accessibility and the ability to support continuous vulnerability assessment across diverse geographies have accelerated adoption.
With enterprises pursuing digital first strategies and hybrid IT models, cloud based deployment has become central to managing dynamic and evolving threat landscapes, securing its prominence within the crowdsourced security market.
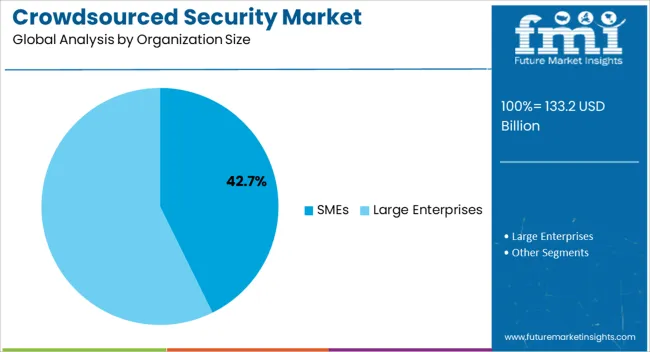
The SMEs segment is projected to represent 42.70% of the total market share by 2025, establishing it as the leading category in organization size. The growth of this segment is linked to increasing awareness among smaller enterprises about the risks of cyberattacks and the need for affordable yet effective security testing models.
Crowdsourced platforms provide SMEs with access to global talent pools and scalable vulnerability assessments without incurring the costs of in house security teams. As digital adoption accelerates across retail, financial services, and professional sectors, SMEs are recognizing the importance of securing their digital assets to maintain trust and comply with regulatory requirements.
The balance of cost efficiency and robust protection has driven SMEs to emerge as the leading contributors within organization size.
Adoption of Various Security Measures to Augment the Market Size
The development and adoption of various security measures are projected to be the significant factor driving the market in the forecast period. The growing demand to upgrade conventional security testing methodologies is likely to propel the market in the coming time. Increasing security demands with the digitization of services are predicted to drive the industry’s expansion.
From the national security front, global crowdsourcing has been the priority. For instance,
The United States Defense Advanced Research Projects Agency (DARPA) integrated crowdsourcing in some of its principal spheres. Such initiatives are expected to drive the market in the forecast period.
Crowdsourced security programs are gaining traction across enterprises since various organizations opt for crowdsourced security programs to audit the security of their application and infrastructure.
The rapid digital transformation occurring globally has transformed the functioning of organizations. As per an analysis conducted by SAP, through 2020, there has been over a 9% rise in revenue owing to digital transformation deployment for enterprises. Hackers have found many opportunities to create potential entry points due to:
This has resulted in organizations demanding strict applications and obtaining systems through crowdsourcing platforms, thereby, offering significant opportunities to the market in the future.
The most significant factor hampering the expansion of the global market is associated with confidential insecurities. The growing cases of cyber-attack and data security are likely to hinder the growth. Furthermore, lack of extent restrains also affects the market growth. Also, the cost of crowdsourced security and the dearth of expertise and technical knowledge are other salient causes impeding market growth.
Test coverage could be challenging to guarantee and can demand efficient managerial management to assure bug identification. This, along with the exploratory nature of crowdsourcing, means that it could be difficult to assure that the product has been tested thoroughly enough to assure usability.
| Attributes | Details |
|---|---|
| Crowdsourced Security Market Share (2025) | USD 107.6 million |
| Crowdsourced Security Market Share (2025) | USD 114.4 million |
| Crowdsourced Security Market Share (2035) | USD 245.4 million |
| Crowdsourced Security Market Share (2025 to 2035) | 7.9% |
| Crowdsourced Security Market Attraction | Growing security demands with digital transformation in organizations to expand the market growth in the forecast period. |
The global crowdsourced security industry size expanded at a CAGR of 5.8% from 2020 to 2025. In 2020, the global market size stood at USD 133.2 million. In the following years, the market witnessed significant growth, accounting for USD 107.6 million in 2025.
Organizations are looking for creative solutions to strengthen their security defenses in light of the proliferation and complexity of cyber threats. Traditional security measures by themselves may be unable to deal with the changing threat scenario.
Ethical hackers pool their collective intellect to find vulnerabilities and improve the state of the overall security stance through crowdsourced security. Several businesses witnessing evolution due to the integration of advanced technologies. The growing cyberattacks and data threats among organizations fuel the crowdsourced security industry.
Based on type, the global market can be segmented into mobile applications, web applications, and others.
Based on deployment type, the global market can be classified into cloud and on-premise.
Based on organization size, the global market can be categorized into SMEs and large enterprises.
Based on vertical, the global market can be segmented into telecom & IT, BFSI, healthcare, travel & hospitality, retail, media & entertainment, and others.
As per the analysis, by type, the mobile application segment is likely to exhibit a growth rate of 7.8% from 2025 to 2035. The expansion of the segment shall be credited to a significant rise in the number of enterprises. The growth of Android and IOS development of the application has resulted in a huge number of organizations adopting security assessment solutions like innovative approaches like crowdsourced security.
The web application type segment is predicted to garner modest growth during the forecast period. In 2025, the web application segment captured 39.2% of the market share. Because web apps are naturally scalable, businesses can reach a large user base. Crowdsourced security offers a scalable method to find vulnerabilities in a wide range of web applications.
Organizations may access a wide range of expertise and viewpoints by utilizing a diversified pool of security researchers, assuring thorough security testing for their online apps. By organization size, the segment is predicted to exhibit a 7.6% CAGR in the assessment period. Large enterprises are likely to occupy a large space in the market during the forecast period. The expansion can be attributed to the presence of resources, a capable decision-making board, and a good budget.
Based on deployment mode, the on-premise segment is predicted to garner enormous growth during the forecast period. In 2025, the on-premise deployment segment captured a 58.3% share of the global market.
There are strict regulatory compliance criteria that must be met in several sectors, including banking, healthcare, and government. By assuring data sovereignty, audibility, and regulatory compliance, on-premise deployment helps businesses to satisfy these demands.
The global market is anticipated to be dominated by North America. The region is expected to propel in the forecast period owing to the early adoption of modern technologies, like the cloud, assisting crowdsourced security providers to deploy competent crowdsourced security methods.
The United States is anticipated to garner USD 133.2 million while exhibiting a CAGR of 7.8% in the forecast period. In 2025, the United States captured a 14.5% share of the global market. Players in the region take various initiatives to expand their reach in the global market. For instance,
NordVPN, a personal virtual private network service provider, launched a bug bounty program on HackerOne. It is part of an initiative to modernize the VPN providers’ security posture.
Europe is projected to make a significant contribution to evolving the regional market. The analysis reveals that the United Kingdom is expected to garner USD 10.5 million, exhibiting a CAGR of 6.9% during the forecast period. In 2025, the United Kingdom garnered a 7.1% share of the global market.
Asia Pacific is projected to exhibit significant growth opportunities during the forecast period. The growth of the market can be attributed to the presence of developing nations such as China, Japan, and South Korea. Also, such countries are top destinations for ethical hackers. In addition, the participation of players is expected to drive the market in the region. For instance,
In January 2025, Uppsala Security announced a collaboration with NSHC. It is set to offer a global Virtual Asset Fund Tracking Solution.
As per the analysis, China, Japan, and South Korea are estimated at USD 17.3 million, USD 14.2 million, and USD 8.7 million respectively. China’s growth rate is anticipated at 7.3%, Japan’s CAGR is estimated at 6.5%, and South Korea is projected at 5.6% during the forecast period.
In 2025, China, Japan, and India captured 7.2%, 5.1%, and 10.2% shares in the global market, respectively.
The European Commission, United Kingdom’s National Cybersecurity Center, and Government Technology Agency have ample opportunities to protect their data from hackers recognizing the weakness in their public-facing systems. Such initiatives are expected to propel the industry in its assessment tenure.
As per the hacker-powered security Report 2020, hacker-powered programs grew up by 30% in each region with Latin America recording significant growth in the forecast period.
| Countries | CAGR Share in Global Market (2025) |
|---|---|
| The United States | 14.5% |
| The United Kingdom | 7.1% |
| China | 7.2% |
| Japan | 5.2% |
| India | 10.2% |
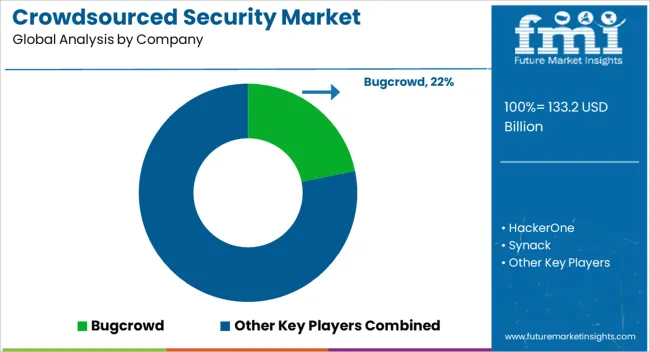
What is the Contribution of Key Players to the Global Market?
Key players frequently collaborate and create alliances with other businesses to broaden their reach, enter new markets, and provide comprehensive solutions. To improve their crowdsourced security services, key players entail collaborating with IT corporations, cybersecurity businesses, or industry-specific organizations. In the crowdsourced security sector, the key players are concerned with expanding their businesses globally.
Recent Developments Observed by FMI:
| Attribute | Details |
|---|---|
| Forecast Period | 2025 to 2035 |
| Historical Data Available for | 2020 to 2025 |
| Market Analysis | USD million for Value |
| Key Regions Covered | North America; Latin America; Europe; Asia Pacific; The Middle East & Africa (MEA) |
| Key Countries Covered | The United States, Canada, Germany, The United Kingdom, Nordic, Russia, BENELUX, Poland, France, Spain, Italy, Czech Republic, Hungary, Rest of EMEAI, Brazil, Peru, Argentina, Mexico, South Africa, Northern Africa, GCC Countries, China, Japan, South Korea, India, ASIAN, Thailand, Malaysia, Indonesia, Australia, New Zealand, Others |
| Key Segments Covered | Type, Deployment Type, Organization Size, Vertical, Region |
| Report Coverage | Market Forecast, Company Share Analysis, Competition Intelligence, Trend Analysis, Market Dynamics and Challenges, and Strategic Growth Initiatives |
The global crowdsourced security market is estimated to be valued at USD 133.2 billion in 2025.
The market size for the crowdsourced security market is projected to reach USD 275.8 billion by 2035.
The crowdsourced security market is expected to grow at a 7.5% CAGR between 2025 and 2035.
The key product types in crowdsourced security market are web application, mobile application and other types.
In terms of deployment type, cloud-based segment to command 58.3% share in the crowdsourced security market in 2025.


Full Research Suite comprises of:
Market outlook & trends analysis
Interviews & case studies
Strategic recommendations
Vendor profiles & capabilities analysis
5-year forecasts
8 regions and 60+ country-level data splits
Market segment data splits
12 months of continuous data updates
DELIVERED AS:
PDF EXCEL ONLINE
Crowdsourced Testing Market Size and Share Forecast Outlook 2025 to 2035
Security Holograms Market Size and Share Forecast Outlook 2025 to 2035
Security Paper Market Size and Share Forecast Outlook 2025 to 2035
Security System Tester Market Size and Share Forecast Outlook 2025 to 2035
Security Advisory Services Market Size and Share Forecast Outlook 2025 to 2035
Security Room Control Market Size and Share Forecast Outlook 2025 to 2035
Security Cameras (IR Illuminator) Market Size and Share Forecast Outlook 2025 to 2035
Security Operation Centre as a Service Market Size and Share Forecast Outlook 2025 to 2035
Security Robots Market Size and Share Forecast Outlook 2025 to 2035
Security Service Edge Market Size and Share Forecast Outlook 2025 to 2035
Security and Surveillance Equipment Market Size and Share Forecast Outlook 2025 to 2035
Security Orchestration Automation and Response (SOAR) Market Size and Share Forecast Outlook 2025 to 2035
Security Bags Market Size and Share Forecast Outlook 2025 to 2035
Security Screening Market Analysis - Size, Share, and Forecast 2025 to 2035
Security Bottles Market Size and Share Forecast Outlook 2025 to 2035
Security Inspection Market Insights – Trends & Forecast 2025 to 2035
Security Labels Market Analysis by Product Type, Material, Pattern, Application, End-Use Industry, and Region Through 2035
Market Share Breakdown of Security Bags Manufacturers
Market Share Insights for Security Tape Providers
Competitive Breakdown of Security Bottles Manufacturers

Thank you!
You will receive an email from our Business Development Manager. Please be sure to check your SPAM/JUNK folder too.
Chat With
MaRIA