
- Market Size (2026)
- USD 1742.5 Mn
- Forecast (2036)
- USD 2341.8 Mn
- CAGR (2026 to 2036)
- 3.0%
How big is the Dead-Burned Magnesia Market in 2026?
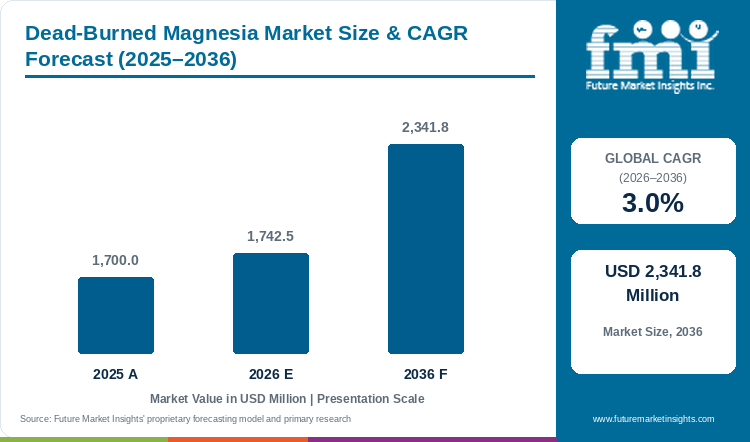
The global dead-burned magnesia market should reach USD 2,341.8 million by 2036 at a 3.0% CAGR across 2026 to 2036. The market was valued at USD 1,700.0 million in 2025, and FMI estimates USD 1,742.5 million for 2026.
Dead-Burned Magnesia Market Size and Forecast
Table 1: Dead-Burned Magnesia Market Size and Forecast
| Market size and forecast | Value |
|---|---|
| Market size in 2025 | USD 1,700.0 million |
| Estimated market size in 2026 | USD 1,742.5 million |
| Projected market size by 2036 | USD 2,341.8 million |
| CAGR from 2026 to 2036 | 3.0% |
Source: Future Market Insights analysis of the Dead-Burned magnesia market, 2026.
The central commercial question is how much refractory performance customers obtain from each tonne of dense magnesia grain. Steelmaking maintains a large installed consumption base, but improvements in lining life limit the translation from steel output into mineral tonnage. RHI Magnesita's 2025 annual report explicitly describes declining refractory consumption per tonne of steel. It also identifies Chinese export quotations as the reference for refractory raw-material pricing. This combination puts pressure on producers that must run kilns steadily while customers seek longer intervals between repairs.
New supply arrives project by project. Grecian Magnesite commissioned a 140.0-tonne-per-day kiln at its Turkish subsidiary in May 2025. That capacity serves both caustic calcined and dead-burned magnesia. FMI expects competition to centre on stable sintering quality, suitable grain fractions and dependable kiln scheduling. Changes in mineral source must be validated in the finished refractory, which makes an apparently cheap raw material more expensive if it shortens the lining campaign.
Key Market Trends & Insights
- Material recovery is becoming a competitive variable. Grecian Magnesite announced a second X-ray processing line in February 2025 to recover more material from old fine ore stockpiles. Improved feed selection offers a route to better mineral utilization before energy-intensive sintering.
- Synthetic magnesium oxide is sold in several burn grades. Martin Marietta's product range distinguishes light-burned, hard-burned and dead-burned products. Purchasing specifications therefore need to state reactivity and physical properties.
- Product carbon declarations are becoming more specific. A valid 2025 environmental declaration covers Terna Mag's dead-burned magnesia.
Regional Highlights
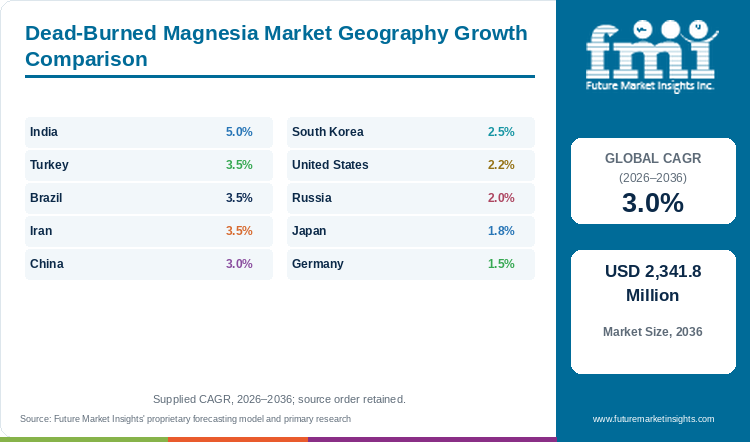
- India, Turkey and Brazil expand faster than the global total. FMI projects India rising from 8.0% to 9.7%, Turkey rising from 4.0% to 4.2% and Brazil rising from 4.0% to 4.2% by 2036.
- Share slips for Germany, Japan and the United States as revenue grows. FMI projects Germany from 5.0% to 4.3%, Japan from 6.0% to 5.4% and the United States from 7.0% to 6.5% by 2036.
Analyst Perspective
“FMI expects the strongest DBM offers to combine a predictable grain structure with a clear cost advantage at the refractory plant. Additional steel capacity supports consumption, but longer lining campaigns reduce material use per tonne of steel. Suppliers need to demonstrate where their mineral lowers the customer's total refractory cost. A broad MgO purity claim alone does not resolve the trade-off between raw-material price and furnace availability.”
- Nikhil Kaitwade, Principal Consultant, FMI
How is the Dead-Burned Magnesia Market segmented?
- By source: Natural Magnesite, Seawater Magnesia, and Brine and Other Sources.
- By end use: Steel Refractories, Cement and Non-ferrous Refractories, Agriculture and Environmental, and Other.
- By supply route: Merchant Sales and Integrated Captive Use.
- By region: East Asia, South Asia, North America, Western Europe, Eastern Europe, Latin America, Middle East, and Rest of world.
Why does the Natural Magnesite segment lead by Source in the Dead-Burned Magnesia Market in 2026?
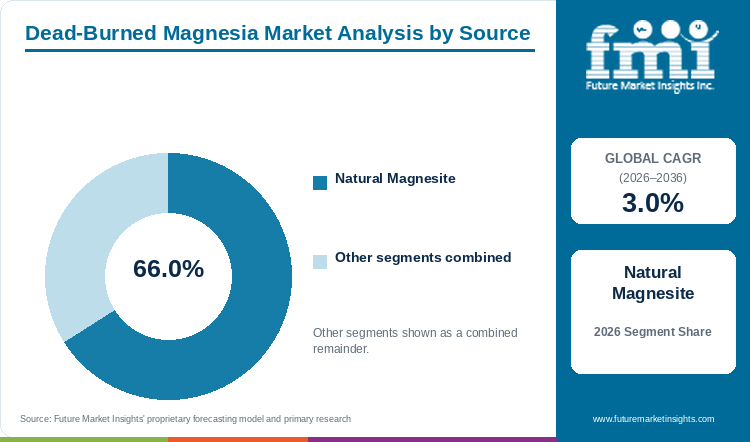
The Natural Magnesite segment holds 66.0% of the Dead-Burned Magnesia Market by source in 2026.
Mine-to-kiln operations make the natural route central to bulk refractory supply. Ore selection determines which impurities enter the sintered grain, while kiln treatment determines the density achieved from that feed. One producer links the properties of its DBM grades to the chemistry of its deposit.
Natural magnesite is projected to grow at 2.8% annually through 2036. Its source share eases to 64.7% as seawater and other sources expand somewhat faster. This is a gradual change in the revenue mix. A producer may choose different sources for distinct grain fractions and service conditions.
FMI's view is that beneficiation and consistent sintering protect the natural route's position. Exporters compete against the cost of synthetic production, but they must also manage the variation within their own orebody. The upstream magnesite market provides context for that raw-material position.
Seawater Magnesia and Brine and Other Sources together hold the remaining 34.0% by source.
Table 2: Source, 2026 Share
| Leading Share | 2026 market share |
|---|---|
| Natural Magnesite | 66.0% |
| All Other Segments Combined Share | 34.0% |
Source: Future Market Insights analysis of the Dead-Burned magnesia market, 2026.
Why does the Steel Refractories segment lead by End Use in the Dead-Burned Magnesia Market in 2026?
The Steel Refractories segment holds 68.0% of the Dead-Burned Magnesia Market by end use in 2026.
Steel operations require replacement material over the life of the furnace. The mineral sale sits within the economics of a lining campaign, where cost includes installation and the consequences of stopping production. DBM competes inside a formulation, where the MgO assay is one input among several. The buyer must establish whether a chosen grain survives the relevant thermal and chemical conditions at an acceptable cost.
Magnezit describes a DBM facility producing material with MgO content up to 98.5% alongside its shaped refractory operations. This illustrates vertical integration between mineral treatment and the finished product. Different operating zones justify different materials.
Steel refractories grow at a 2.7% forecast CAGR and retain 66.0% of DBM revenue in 2036. Their share declines modestly as smaller uses develop, but their absolute revenue continues rising. The broader refractories market covers many other minerals and finished products. For DBM producers, the most durable account is one where mineral consistency has already been demonstrated through actual refractory service.
Cement and Non-ferrous Refractories, Agriculture and Environmental and Other together account for the remaining 32.0% by end use.
Table 3: End Use, 2026 Share
| Leading Share | 2026 market share |
|---|---|
| Steel Refractories | 68.0% |
| All Other Segments Combined Share | 32.0% |
Source: Future Market Insights analysis of the Dead-Burned magnesia market, 2026.
Why does the Merchant Sales segment lead by Supply Route in the Dead-Burned Magnesia Market in 2026?
The Merchant Sales segment holds 56.0% of the Dead-Burned Magnesia Market by supply route in 2026.
Merchant sales lead because most refractory makers outside the integrated groups buy dead-burned magnesia on the open market and set purchasing against quoted mineral prices. One integrated refractory group reported an 8.0% decline in Chinese high-grade DBM prices in 2025, a movement a merchant buyer can benefit from quickly, whereas an integrated producer still carries the cost of its mining and kiln network.
Integrated routes remain a distinct competitor. A Russian producer describes a DBM facility operating alongside its shaped refractory business, and a Turkish steel group's integrated report identifies a vertically integrated magnesite and refractory operation acquired in February 2021. Material that moves inside such groups does not reach the open market, so merchant suppliers compete against rival miners and against their customers' own capacity.
FMI's 2026 assessment values Merchant Sales at USD 975.8 million. An integrated group can sell surplus material to third parties and a merchant buyer can acquire its own source. Suppliers should treat major integrated accounts as potential competitors as well as customers.
Integrated Captive Use together hold the remaining 44.0% by supply route.
Table 4: Supply Route, 2026 Share
| Leading Share | 2026 market share |
|---|---|
| Merchant Sales | 56.0% |
| All Other Segments Combined Share | 44.0% |
Source: Future Market Insights analysis of the Dead-Burned magnesia market, 2026.
What are the key drivers restraints and opportunities?
Refractory replacement supports recurring DBM sales. Longer lining life and pressure on kiln economics restrain tonnage growth. Better ore recovery and product-specific evidence create opportunities to defend value.
Driver
Steel and other high-temperature plants replace worn refractory material even when no new furnace is commissioned.
Restraint
A longer campaign reduces replacement consumption, while an underused kiln still carries fixed operating costs.
Opportunity
Suppliers can differentiate through controlled mineral chemistry, recovered feed and evidence of performance at the customer's operating conditions.
How do purchasing rules and qualification affect Dead-Burned magnesia market demand?
The market's growth depends on additions to active refractory service and the replacement rate within that service. New steel production is one part of the calculation. The mineral consumed in repairing existing vessels is another. Comparing steel output with refractory purchases is therefore useful only when the analyst also considers changes in lining life and the share of a formulation made from fresh DBM.
Natural magnesite's continuing revenue lead makes feed preparation commercially important. Removing unsuitable material before sintering avoids spending fuel on grain that cannot meet the target specification. Producers with access to several grades can direct each fraction towards the appropriate refractory application. The benefit is more saleable output from the mineral resource, instead of an assumption that every tonne should become a premium product.
What limits reliable Dead-Burned magnesia market supply and quality?
Mineral price weakness can narrow the reward for improving kiln efficiency. A refractory producer buying on the merchant market may receive the benefit of lower mineral quotations quickly, while an integrated producer still carries the cost of its mining and kiln network. RHI Magnesita reported an 8.0% decline in Chinese high-grade DBM prices in 2025.
Grade substitution presents a second risk. Lower-cost material can enter less demanding uses, but a chemical assay does not describe all of a grain's service behaviour. The risk increases when buying decisions separate mineral cost from refractory performance. Freight also matters because DBM is a dense bulk cargo. The shipping schedule reproduced by Japan's transport ministry requires a declaration confirming sufficient heat treatment before loading. Correct cargo identification belongs in the commercial delivery process.
Where can suppliers win additional business in the Dead-Burned magnesia market?
Documented environmental performance offers a specific opening for qualified producers. Kümaş publishes verified product carbon information that distinguishes DBM from fused and caustic calcined magnesia. The values should be assessed with their stated boundaries. A comparison between unlike declarations can mislead a purchasing decision.
The opportunity is to supply a tested material with a usable product record. It is strongest where customers already compare alternative mineral origins or seek to reduce the emissions attached to a refractory formulation. The adjacent magnesium carbonate mineral market covers precursor materials. Carbonate sales and the downstream sintered product should remain separate when evaluating the size of this opportunity.
Dead-Burned Magnesia Market by Country (2026 to 2036)
Table 5: Dead-Burned Magnesia Market Country Growth Forecast
| Country | CAGR, 2026 to 2036 |
|---|---|
| India | 5.0% |
| Turkey | 3.5% |
| Brazil | 3.5% |
| Iran | 3.5% |
| China | 3.0% |
| South Korea | 2.5% |
| United States | 2.2% |
| Russia | 2.0% |
| Japan | 1.8% |
| Germany | 1.5% |
Source: Future Market Insights analysis of the Dead-Burned magnesia market, 2026.
India
India offers the fastest expansion among the countries covered individually. Worldsteel reports 164.9 million tonnes of crude steel output in 2025, compared with 149.4 million tonnes in 2024. The immediate implication for DBM suppliers is an enlarging base of refractory service. The mineral opportunity must still be assessed at the actual furnace and ladle configuration, since a change in steel production route can alter the required refractory mix. Crude steel output at industry level is covered in FMI's steel market.
At a 5.0% CAGR from 2026 to 2036, FMI expects Indian DBM revenue to grow from USD 139.4 million to USD 227.7 million. Its share increases from 8.0% to 9.7%. That change gives suppliers a reason to qualify additional customer accounts before competition focuses solely on spot quotations. The opening is not limited to the first lining of a new facility. Subsequent repairs and replacement campaigns can create a longer stream of mineral purchases.
The commercial task is to convert new steelmaking activity into a stable refractory specification. A DBM supplier needs to understand whether the customer makes bricks internally, buys a complete lining package or procures a monolithic product. Each route places the mineral purchase at a different point in the chain. Offering the right grain fractions and a credible delivery sequence is more useful than treating all steel producers as direct raw-material buyers. India's rising weight in DBM revenue rewards suppliers able to enter these purchasing arrangements early.
Turkey
Turkey participates on both sides of the DBM transaction. It consumes refractory material in steelmaking and hosts mineral operations that sell into international markets. Erdemir's 2025 integrated report identifies Kümaş as a vertically integrated magnesite and refractory operation acquired in February 2021. This relationship connects mineral supply with a steel producer's interest in cost control and continuity.
The Turkish DBM market is forecast at USD 69.7 million in 2026 and USD 98.6 million in 2036. FMI's projected CAGR reaches 3.5% across 2026 to 2036. Demand growth should be separated from the country's export production opportunity. A kiln located in Turkey can serve customers abroad without the corresponding revenue becoming Turkish domestic consumption. Turkey's share of global revenue rises from 4.0% to 4.2%.
Recent investment also illustrates the need to distinguish product routes. The new kiln at the Akdeniz subsidiary serves both caustic calcined and dead-burned products. Its combined capacity cannot be assigned entirely to DBM. Producers with this operating flexibility must choose the mix that meets orders and available feed quality. For buyers, local access to magnesite is useful only when the required sintered grade is available at the right time. FMI sees the country's competitive advantage in the combination of mineral resources, operating kilns and links to refractory customers. The value of those assets depends on the specific material offered, instead of a general claim of proximity to European demand.
Brazil
Brazil differs from an import-led DBM customer market because a major integrated refractory producer also operates a mineral base there. A refractory group identifies Brumado among its DBM operations. Exported grain and Brazilian refractory demand are separate commercial flows.
FMI expects Brazilian DBM revenue to rise from USD 69.7 million in 2026 to USD 98.6 million in 2036. The 3.5% CAGR from 2026 to 2036 takes its global revenue share from 4.0% to 4.2%. Brazil contributes USD 28.9 million of new revenue, joint fourth of ten. That increase equals 4.8% of the global gain of USD 599.3 million. At 3.5%, the CAGR for Brazil is 0.5 points above the global 3.0%. Brazil holds joint seventh place by 2026 revenue. Its CAGR equals the rates for Turkey and Iran and trails India's 5.0% by 1.5 points.
The sales opportunity comes from matching local mineral treatment with the requirements of refractory producers and industrial customers. A mine and kiln may provide continuity of feed, while the customer still needs a particular impurity balance and particle-size distribution. Producers serving both captive operations and external customers must make clear which grades are offered to the merchant market. FMI sees Brazil's advantage in the ability to connect a substantial mineral operation with regional customer needs. The strongest offers should show how that connection improves the economics of a defined refractory application.
Iran
Electric steelmaking gives Iran a distinct refractory demand structure. Worldsteel's 2026 publication estimates that electric furnaces produced 91.9% of Iranian steel in 2025. This makes the operating requirements of electric furnaces and associated steel-treatment vessels a relevant starting point for DBM analysis.
FMI forecasts revenue of USD 52.3 million in 2026 and USD 74.0 million in 2036. The projected 3.5% CAGR between 2026 and 2036 is above the global pace. Iran begins from a smaller revenue base than the other named countries, so suppliers need to evaluate the size of individual accounts before treating that growth rate as a large absolute opportunity. A 3.5% CAGR leaves Iran 0.5 points above the 3.0% global pace. In the Dead-Burned magnesia market, Iran ranks tenth of ten on 2026 revenue.
The appropriate commercial discussion concerns the balance between dense mineral grain, finished refractory performance and the replacement schedule. A refractory manufacturer may adjust its blend to meet a mill's operating conditions, but a new DBM source must be demonstrated in that formulation. FMI sees room for suppliers that can deliver a stable grade and maintain continuity across repeat orders. The revenue outlook is best approached through specific furnace and ladle accounts, with operating evidence for each product. Assuming that the high electric-furnace share automatically increases fresh magnesia consumption would ignore changes in lining life and recovery of spent material.
China
China sets the scale of the DBM business through both refractory consumption and mineral supply. Its USD 522.8 million demand base accounts for 30.0% of global revenue in 2026. The US Geological Survey identifies China as the leading magnesia producer and describes the concentration of production in Liaoning. This creates an unusual competitive position. Chinese customers buy within the same industrial system that supplies substantial merchant material to foreign refractory plants. Revenue in China climbs by USD 181.7 million, first among the ten. At 3.0% a year, China grows in line with the global market.
FMI projects a 3.0% CAGR from 2026 to 2036, taking demand to USD 704.5 million. The rate reflects a large established market instead of a small market catching up. For an exporter, the allocation between domestic customers and overseas orders matters alongside total kiln output.
The practical sales argument is consistency at the required furnace duty. An integrated supplier can compare the performance of its own grain in finished refractories, while a merchant supplier needs reliable evidence that each lot matches the agreed specification. Buying on price alone exposes the customer to variation that may become visible only after installation. Producers should therefore direct investment towards repeatable grade preparation and dependable delivery schedules. The country's revenue lead is large enough for modest improvements in retention to matter commercially.
South Korea
South Korea's steel industry provides a concentrated industrial anchor for refractory purchases. Worldsteel reports 62.2 million tonnes of crude steel output in 2025 and a 73.0% oxygen-steelmaking share. The refractory requirement still depends on vessel design, campaign length and the blend used at each operating position.
DBM revenue is forecast to grow from USD 69.7 million in 2026 to USD 89.5 million in 2036. The 2.5% CAGR for 2026 to 2036 suggests steady value expansion within a developed steelmaking system. FMI expects the most credible supplier case to focus on the connection between mineral consistency and the refractory producer's own performance commitments. South Korea's share of global revenue eases from 4.0% to 3.8%. In the Dead-Burned magnesia market, South Korea adds USD 19.8 million, ranking eighth for increase. In 2026 revenue terms, South Korea is joint seventh of the ten countries.
A steelmaker purchasing a refractory service package may influence the specification without buying DBM directly. The mineral producer's immediate customer can therefore be a refractory manufacturer whose sales depend on a successful campaign at the mill. A new source must fit that relationship. Sampling and laboratory results provide an entry point, while the commercial decision ultimately depends on a material performing repeatedly under the agreed conditions. The forecast leaves room for qualified alternatives, but it offers little justification for treating all imported mineral grades as interchangeable inputs across South Korea's steel facilities.
United States
Supplier ownership has changed the structure of the US magnesia business. Martin Marietta completed its acquisition of Premier Magnesia on 25 July 2025. The two names therefore represent related operations when assessing purchasing alternatives. Counting them as independent competing groups would overstate the number of separate ownership choices available to buyers.
The US DBM market is projected to rise from USD 122.0 million in 2026 to USD 152.1 million in 2036. Its 2.2% CAGR between 2026 and 2036 is below the global rate. FMI sees the commercial contest here as a comparison of delivered mineral economics and customer-specific grades within an established refractory industry. Synthetic and natural routes provide different production options, but neither route establishes suitability without a specification matched to the intended refractory. In the Dead-Burned magnesia market, the United States grows 2.2% a year, 0.8 points below the global rate. The United States moves from 7.0% of global revenue in 2026 to 6.5% in 2036.
The acquirer's published magnesium oxide range includes dead-burned material alongside other burn grades. For customers, product selection has to occur at that grade level. Purchasing teams also need to distinguish domestic mineral processing from imported raw materials held in local inventory. These arrangements can carry different lead times and exposure to freight changes. Suppliers that make their production route and product properties clear reduce the work needed to compare offers, especially when a refractory formulation already has a proven operating record.
Russia
Russia has a domestic supplier structure that links mineral processing closely to refractory production. Magnezit describes a DBM facility with 130.0 thousand tonnes of annual output capability and high-temperature shaft kilns. It nevertheless shows why local competition must be understood at both the mineral and finished-refractory stages.
FMI projects Russian demand to grow at 2.0% annually from 2026 to 2036. Revenue increases from USD 87.1 million to USD 106.5 million over that period. The outlook does not require a large increase in the country's share of global consumption. It points instead to continuing refractory replacement and gradual value growth within an existing industrial base. In the Dead-Burned magnesia market, Russia's 2.0% CAGR sits 1.0 points below the global 3.0%.
For a merchant grain seller, an integrated local competitor may have direct access to information on refractory wear and repair schedules. That information can support grade development and customer retention. An independent supplier needs to establish an equally practical relationship with the refractory maker, including consistency across the fractions used in a brick or monolithic blend. The relevant comparison is not simply whether the mineral is domestic or imported. It is whether the source can maintain the agreed properties through successive deliveries and support the customer's production plan. FMI expects technically matched accounts to matter more than an indiscriminate pursuit of volume, particularly where existing refractory producers already have access to captive mineral treatment.
Japan
Japanese demand sits within a large but mature steelmaking base. Worldsteel records crude steel output of 80.7 million tonnes in 2025. For DBM sellers, the useful measure is the refractory service attached to that production, instead of the volume of steel alone. A customer extending the life of a lining may purchase less fresh material without reducing furnace output. This makes replacement schedules and the approved blend important commercial indicators.
FMI forecasts Japanese DBM revenue of USD 104.6 million in 2026 and USD 125.3 million in 2036. The corresponding CAGR is 1.8% from 2026 to 2036. The restrained pace leaves less room for a supplier to rely on national market growth. Share gains require a material that fits an existing refractory specification or solves a defined limitation in service. Japan contributes USD 20.7 million of new revenue, seventh of ten.
Cargo treatment is another point where precision matters. Japan's transport ministry reproduces a separate bulk-cargo schedule for dead-burned magnesia. For an imported lot, documentation connects the mineral's manufacturing condition with the shipping description. That record does not replace product testing at the refractory plant, but it helps prevent uncertainty over what was actually delivered. FMI expects established customer grades and careful delivery execution to remain stronger sales arguments than an undifferentiated expansion of mineral tonnage into the Japanese market.
Germany
Germany's DBM opportunity is concentrated in a demanding industrial customer base instead of rapid growth in basic mineral consumption. Its forecast revenue rises from USD 87.1 million in 2026 to USD 101.4 million in 2036. The 1.5% CAGR between 2026 and 2036 is the lowest of the ten named countries. Suppliers therefore have to defend value within existing accounts and avoid building a sales case around national tonnage expansion alone.
Product environmental information can add a useful comparison dimension. Terna Mag's DBM declaration was registered in April 2025 and is valid through April 2030. For a German refractory producer assessing alternative origins, such documentation makes it possible to examine a named product instead of a broad corporate emissions statement. The declaration does not by itself establish a lower footprint than every competing material. Its use depends on comparable boundaries and a material that also meets the refractory requirement.
FMI sees opportunities in joint evaluation of service performance and product records. A lower-emission grain that requires more frequent lining replacement may not improve the customer's overall result. Conversely, dismissing a proven alternative on its purchase price alone can overlook a longer campaign or a different delivered cost. The strongest supplier discussion brings these considerations together with operating evidence. Germany's modest forecast growth makes the quality of each retained industrial account particularly important. Expansion is more likely to depend on the value obtained from qualified material than on selling more of the same grain without a performance argument.
Who are the notable companies in the Dead-Burned Magnesia Market?
Notable companies in the Dead-Burned Magnesia Market include RHI Magnesita, Magnezit Group, Kumas Manyezit, Grecian Magnesite and Haicheng Houying Group.
RHI Magnesita, Magnezit Group and Grecian Magnesite connect mineral operations with refractory products. Martin Marietta Magnesia Specialties offers synthetic magnesium oxide burn grades. These business models create different routes to the customer. An integrated refractory producer can evaluate its mineral within the final lining, while a merchant supplier needs to support the customer's own blend development.
Ownership also changes the number of independent alternatives. Premier Magnesia became part of Martin Marietta in July 2025. Kümaş is within Erdemir's industrial group. These relationships should be understood before comparing production assets or negotiating alternatives. Brand names alone do not identify separate economic owners.
Imerys requires a different interpretation. Its former High Temperature Solutions business became the independent Calderys group in January 2023. The wider minerals company and the former Calderys refractory operations therefore have different current ownership. A producer's position in industrial minerals should be distinguished from ownership of a specific DBM operation. This keeps the comparison focused on the assets and grades actually offered to refractory customers.
Key Developments in the Dead-Burned Magnesia Market
- On 4 August 2026, RHI Magnesita and Khemka Refractories completed their joint venture and launched MINPRO, a refractory recycling business based in Odisha, India. MINPRO will recover, process and reuse spent refractory materials, so it adds a secondary mineral source and does not add primary dead-burned magnesia capacity.
Key Players in the Dead-Burned Magnesia Market
- RHI Magnesita
- Magnezit Group
- Kumas Manyezit
- Grecian Magnesite
- Haicheng Houying Group
- Martin Marietta Magnesia Specialties
- Premier Magnesia, part of Martin Marietta
- Imerys
Dead-Burned Magnesia Market Report Scope
Table 6: Dead-Burned Magnesia Market Report Scope
| Coverage field | Report scope |
|---|---|
| Market definition | Sintered magnesia produced from magnesite, seawater magnesia, brine and other sources for refractory and specified industrial sales. |
| Product boundary | DBM grain and associated commercial forms. Finished refractory product revenue is excluded. |
| Adjacent exclusions | Fused magnesia, general caustic calcined magnesia, raw magnesite ore and magnesium metal. |
| Quantitative Units | USD million |
| Source breakdown | Natural Magnesite. Seawater Magnesia. Brine and Other Sources. |
| End-use breakdown | Steel Refractories. Cement and Non-ferrous Refractories. Agriculture and Environmental. Other. Agricultural and environmental coverage includes DBM-specific sales only. |
| Named countries | China, India, United States, Japan, Germany, Russia, Turkey, South Korea, Brazil and Iran |
| Company coverage | RHI Magnesita, Magnezit Group, Imerys, Grecian Magnesite, Kumas Manyezit, Martin Marietta Magnesia Specialties, Haicheng Houying Group and Premier Magnesia. |
| Commercial questions | Source mix, refractory replacement, mineral consistency, kiln economics, ownership and product documentation. |
| Supply Route coverage | Merchant Sales, Integrated Captive Use. |
Source: Future Market Insights analysis of the Dead-Burned magnesia market, 2026.
Dead-Burned Magnesia Market Research Methodology
This assessment combines FMI's quantitative outlook with secondary review of mineral statistics, steel production, company ownership and product disclosures. The analysis distinguishes DBM from caustic calcined and fused magnesia, and separates raw-material revenue from finished refractories. Country growth and source shares are checked against the report's revenue framework. Company comparisons use documented product roles and completed transaction status. No primary interviews or independent plant surveys are represented in this assessment.
Dead-Burned Magnesia Market by Segments
Dead-Burned Magnesia Market segmented by Source:
- Natural Magnesite
- Seawater Magnesia
- Brine and Other Sources
Dead-Burned Magnesia Market segmented by End Use:
- Steel Refractories
- Cement and Non-ferrous Refractories
- Agriculture and Environmental
- Other
Dead-Burned Magnesia Market segmented by Supply Route:
- Merchant Sales
- Integrated Captive Use
Dead-Burned Magnesia Market by Region
- East Asia
- China
- Japan
- South Korea
- South Asia
- India
- North America
- United States
- Western Europe
- Germany
- Eastern Europe
- Russia
- Latin America
- Brazil
- Middle East
- Turkey
- Iran
- Rest of world
- All other markets combined
Research Sources and Bibliography
- Calderys. (2023, 31 January). Calderys Becomes a Standalone Company.
- Erdemir. (2026). 2025 Integrated Annual Report. Corporate profile of Kümaş Manyezit.
- Grecian Magnesite. (Accessed 9 November 2026). Our History. Entries for January, February and May 2025.
- Grecian Magnesite. (Accessed 9 November 2026). Products. Deadburned Magnesia.
- International EPD System. (2025, 8 April). Dead Burned Magnesia. EPD-IES-0008303:001, Terna Mag. https://www.environdec.com/library/epd8303
- International Flame Research Foundation. (2003). What Are the Dead Burnt Magnesite Manufacturing Processes? Combustion handbook. https://ifrf.net/research/handbook/what-are-the-dead-burnt-magnesite-manufacturing-processes/
- Japan Ministry of Land, Infrastructure, Transport and Tourism. (Accessed 9 November 2026). IMSBC Code, Amendment 07-23. Magnesia (Deadburnned) cargo schedule. https://www.mlit.go.jp/maritime/content/001852905.pdf
- Kümaş Manyezit. (Accessed 9 November 2026). Verification Statement. Product carbon footprint information. https://kumasref.com/uploads/sertifika/1740124532.pdf
- Magnezit Group. (Accessed 9 November 2026). The Group. Dead-burned magnesia facility and industrial complexes. https://magnezit.ru/eng/the-group/
- Martin Marietta. (2025, 4 August). Martin Marietta and Quikrete to Exchange Certain Cement and Concrete Assets for Aggregates Assets; Company Also Completes Acquisition of Premier Magnesia, LLC. https://ir.martinmarietta.com/news-releases/news-release-details/martin-marietta-and-quikrete-exchange-certain-cement-and
- Martin Marietta Magnesia Specialties. (Accessed 9 November 2026). Products. Magnesium oxide burn grades. https://magnesiaspecialties.com/products/
- RHI Magnesita. (2026). Annual Report and Accounts 2025. Strategy and financial review sections. https://ir.rhimagnesita.com/wp-content/uploads/2026/03/rhim-ar2025.pdf
- RHI Magnesita India Ltd. (2026, August 4). RHI Magnesita and Khemka Refractories Launch MINPRO Following Completion of Joint Venture. Filing to BSE Limited and National Stock Exchange of India. https://beta.bseindia.com/xml-data/corpfiling/AttachHis/140a9f58-1b17-477a-b2c7-7bc722bd48de.pdf
- US Geological Survey. (2026, May revision). Mineral Commodity Summaries 2026. Magnesium Compounds chapter. https://pubs.usgs.gov/periodicals/mcs2026/mcs2026.pdf
- World Steel Association. (2026). World Steel in Figures 2026. Crude steel output and production process tables. https://worldsteel.org/data/world-steel-in-figures/world-steel-in-figures-2026/
Table of Content
- Key Takeaways
- Market Size and CAGR
- Top Growth Driver
- Fastest Growing Segment
- Leading Region
- Key Companies
- Emerging Opportunities
- Executive Summary
- Global Market Outlook
- Demand-side Trends
- Supply-side Trends
- Technology Roadmap Analysis
- Analysis and Recommendations
- Analyst Perspective (What is happening? Why now? What should investors know?)
- Key Questions Answered
- How large is the market?
- What is the CAGR?
- What are key trends?
- Which region dominates?
- Who are the leaders?
Read More...
- Market Overview
- Market Coverage / Taxonomy
- Market Definition / Scope / Limitations
- Research Methodology
- Chapter Orientation
- Analytical Lens and Working Hypotheses
- Market Structure, Signals, and Trend Drivers
- Benchmarking and Cross-market Comparability
- Market Sizing, Forecasting, and Opportunity Mapping
- Research Design and Evidence Framework
- Desk Research Programme (Secondary Evidence)
- Expert Input and Fieldwork (Primary Evidence)
- Tooling, Models, and Reference Databases
- Data Engineering and Model Build
- Quality Assurance and Audit Trail
- Market Background
- Market Dynamics (Drivers, Restraints, Opportunity, Trends)
- Scenario Forecast (Optimistic, Likely, Conservative)
- Impact Analysis
- AI Impact
- Sustainability Impact
- Regulatory Impact
- Technology Impact
- Consumer / Buyer Analysis
- Purchase Drivers
- Adoption Barriers
- Buyer Journey
- Opportunity Map Analysis
- Product Life Cycle Analysis
- Supply Chain Analysis
- Investment Feasibility Matrix
- Value Chain Analysis
- PESTLE and Porter's Analysis
- Regulatory Landscape
- Regional Parent Market Outlook
- Production and Consumption Statistics
- Import and Export Statistics
- Global Market Analysis and Forecast, 2021 to 2036
- Historical Market Size Value (USD Million) Analysis, 2021 to 2025
- Current and Future Market Size Value (USD Million) Projections, 2026 to 2036
- Y-o-Y Growth Trend Analysis
- Absolute $ Opportunity Analysis
- Global Market Pricing Analysis, 2021 to 2036
- Global Market Analysis and Forecast, By Source, 2021 to 2036
- Introduction / Key Findings
- Historical Market Size Value (USD Million) Analysis By Source, 2021 to 2025
- Current and Future Market Size Value (USD Million) Analysis and Forecast By Source, 2026 to 2036
- Natural Magnesite
- Seawater Magnesia
- Brine and Other Sources
- Y-o-Y Growth Trend Analysis By Source, 2021 to 2025
- Absolute $ Opportunity Analysis By Source, 2026 to 2036
- Global Market Analysis and Forecast, By End Use, 2021 to 2036
- Introduction / Key Findings
- Historical Market Size Value (USD Million) Analysis By End Use, 2021 to 2025
- Current and Future Market Size Value (USD Million) Analysis and Forecast By End Use, 2026 to 2036
- Steel Refractories
- Cement and Non-ferrous Refractories
- Agriculture and Environmental
- Other
- Y-o-Y Growth Trend Analysis By End Use, 2021 to 2025
- Absolute $ Opportunity Analysis By End Use, 2026 to 2036
- Global Market Analysis and Forecast, By Supply Route, 2021 to 2036
- Introduction / Key Findings
- Historical Market Size Value (USD Million) Analysis By Supply Route, 2021 to 2025
- Current and Future Market Size Value (USD Million) Analysis and Forecast By Supply Route, 2026 to 2036
- Merchant Sales
- Integrated Captive Use
- Y-o-Y Growth Trend Analysis By Supply Route, 2021 to 2025
- Absolute $ Opportunity Analysis By Supply Route, 2026 to 2036
- Global Market Analysis and Forecast, By Region, 2021 to 2036
- Introduction
- Historical Market Size Value (USD Million) Analysis By Region, 2021 to 2025
- Current Market Size Value (USD Million) Analysis and Forecast By Region, 2026 to 2036
- East Asia
- South Asia
- North America
- Western Europe
- Eastern Europe
- Latin America
- Middle East
- Market Attractiveness Analysis By Region
- East Asia Market Analysis and Forecast, By Country
- Historical Market Size Value (USD Million) Trend Analysis By Market Taxonomy, 2021 to 2025
- Market Size Value (USD Million) Forecast By Market Taxonomy, 2026 to 2036
- By Country
- China
- Japan
- South Korea
- By Source
- By End Use
- By Supply Route
- By Country
- Market Attractiveness Analysis
- By Country
- By Source
- By End Use
- By Supply Route
- Key Takeaways
- South Asia Market Analysis and Forecast, By Country
- Historical Market Size Value (USD Million) Trend Analysis By Market Taxonomy, 2021 to 2025
- Market Size Value (USD Million) Forecast By Market Taxonomy, 2026 to 2036
- By Country
- India
- By Source
- By End Use
- By Supply Route
- By Country
- Market Attractiveness Analysis
- By Country
- By Source
- By End Use
- By Supply Route
- Key Takeaways
- North America Market Analysis and Forecast, By Country, 2021 to 2036
- Historical Market Size Value (USD Million) Trend Analysis By Market Taxonomy, 2021 to 2025
- Market Size Value (USD Million) Forecast By Market Taxonomy, 2026 to 2036
- By Country
- United States
- By Source
- By End Use
- By Supply Route
- By Country
- Market Attractiveness Analysis
- By Country
- By Source
- By End Use
- By Supply Route
- Key Takeaways
- Western Europe Market Analysis and Forecast, By Country
- Historical Market Size Value (USD Million) Trend Analysis By Market Taxonomy, 2021 to 2025
- Market Size Value (USD Million) Forecast By Market Taxonomy, 2026 to 2036
- By Country
- Germany
- By Source
- By End Use
- By Supply Route
- By Country
- Market Attractiveness Analysis
- By Country
- By Source
- By End Use
- By Supply Route
- Key Takeaways
- Eastern Europe Market Analysis and Forecast, By Country
- Historical Market Size Value (USD Million) Trend Analysis By Market Taxonomy, 2021 to 2025
- Market Size Value (USD Million) Forecast By Market Taxonomy, 2026 to 2036
- By Country
- Russia
- By Source
- By End Use
- By Supply Route
- By Country
- Market Attractiveness Analysis
- By Country
- By Source
- By End Use
- By Supply Route
- Key Takeaways
- Latin America Market Analysis and Forecast, By Country
- Historical Market Size Value (USD Million) Trend Analysis By Market Taxonomy, 2021 to 2025
- Market Size Value (USD Million) Forecast By Market Taxonomy, 2026 to 2036
- By Country
- Brazil
- By Source
- By End Use
- By Supply Route
- By Country
- Market Attractiveness Analysis
- By Country
- By Source
- By End Use
- By Supply Route
- Key Takeaways
- Middle East Market Analysis and Forecast, By Country
- Historical Market Size Value (USD Million) Trend Analysis By Market Taxonomy, 2021 to 2025
- Market Size Value (USD Million) Forecast By Market Taxonomy, 2026 to 2036
- By Country
- Turkey
- Iran
- Rest of world
- All other markets combined
- By Source
- By End Use
- By Supply Route
- By Country
- Market Attractiveness Analysis
- By Country
- By Source
- By End Use
- By Supply Route
- Key Takeaways
- Key Countries Market Analysis
- United States
- Pricing Analysis
- Market Share Analysis, 2025
- By Source
- By End Use
- By Supply Route
- Brazil
- Pricing Analysis
- Market Share Analysis, 2025
- By Source
- By End Use
- By Supply Route
- Germany
- Pricing Analysis
- Market Share Analysis, 2025
- By Source
- By End Use
- By Supply Route
- India
- Pricing Analysis
- Market Share Analysis, 2025
- By Source
- By End Use
- By Supply Route
- China
- Pricing Analysis
- Market Share Analysis, 2025
- By Source
- By End Use
- By Supply Route
- Japan
- Pricing Analysis
- Market Share Analysis, 2025
- By Source
- By End Use
- By Supply Route
- South Korea
- Pricing Analysis
- Market Share Analysis, 2025
- By Source
- By End Use
- By Supply Route
- Russia
- Pricing Analysis
- Market Share Analysis, 2025
- By Source
- By End Use
- By Supply Route
- Turkey
- Pricing Analysis
- Market Share Analysis, 2025
- By Source
- By End Use
- By Supply Route
- Iran
- Pricing Analysis
- Market Share Analysis, 2025
- By Source
- By End Use
- By Supply Route
- United States
- Market Structure Analysis
- Competition Dashboard
- Competition Benchmarking
- Market Share Analysis of Top Players
- By Regional
- By Source
- By End Use
- By Supply Route
- Emerging Startups
- Innovation Benchmarking
- Competition Analysis
- Competition Deep Dive
- RHI Magnesita
- Overview
- Product Portfolio
- Profitability by Market Segments
- Sales Footprint
- Strategy Overview
- Marketing Strategy
- Product Strategy
- Channel Strategy
- Magnezit Group
- Grecian Magnesite
- Kumas Manyezit
- Martin Marietta Magnesia Specialties
- Premier Magnesia
- Imerys
- Haicheng Houying Group
- Premier Magnesia, part of Martin Marietta
- RHI Magnesita
- Case Studies
- Success Stories
- Recent Developments
- Competition Deep Dive
- Assumptions & Acronyms Used
List of Tables
- Table 1: Global Market Value (USD Million) Forecast by Region, 2021 to 2036
- Table 2: Global Market Value (USD Million) Forecast by Source, 2021 to 2036
- Table 3: Global Market Value (USD Million) Forecast by End Use, 2021 to 2036
- Table 4: Global Market Value (USD Million) Forecast by Supply Route, 2021 to 2036
- Table 5: East Asia Market Value (USD Million) Forecast by Country, 2021 to 2036
- Table 6: East Asia Market Value (USD Million) Forecast by Source, 2021 to 2036
- Table 7: East Asia Market Value (USD Million) Forecast by End Use, 2021 to 2036
- Table 8: East Asia Market Value (USD Million) Forecast by Supply Route, 2021 to 2036
- Table 9: South Asia Market Value (USD Million) Forecast by Country, 2021 to 2036
- Table 10: South Asia Market Value (USD Million) Forecast by Source, 2021 to 2036
- Table 11: South Asia Market Value (USD Million) Forecast by End Use, 2021 to 2036
- Table 12: South Asia Market Value (USD Million) Forecast by Supply Route, 2021 to 2036
- Table 13: North America Market Value (USD Million) Forecast by Country, 2021 to 2036
- Table 14: North America Market Value (USD Million) Forecast by Source, 2021 to 2036
- Table 15: North America Market Value (USD Million) Forecast by End Use, 2021 to 2036
- Table 16: North America Market Value (USD Million) Forecast by Supply Route, 2021 to 2036
- Table 17: Western Europe Market Value (USD Million) Forecast by Country, 2021 to 2036
- Table 18: Western Europe Market Value (USD Million) Forecast by Source, 2021 to 2036
- Table 19: Western Europe Market Value (USD Million) Forecast by End Use, 2021 to 2036
- Table 20: Western Europe Market Value (USD Million) Forecast by Supply Route, 2021 to 2036
- Table 21: Eastern Europe Market Value (USD Million) Forecast by Country, 2021 to 2036
- Table 22: Eastern Europe Market Value (USD Million) Forecast by Source, 2021 to 2036
- Table 23: Eastern Europe Market Value (USD Million) Forecast by End Use, 2021 to 2036
- Table 24: Eastern Europe Market Value (USD Million) Forecast by Supply Route, 2021 to 2036
- Table 25: Latin America Market Value (USD Million) Forecast by Country, 2021 to 2036
- Table 26: Latin America Market Value (USD Million) Forecast by Source, 2021 to 2036
- Table 27: Latin America Market Value (USD Million) Forecast by End Use, 2021 to 2036
- Table 28: Latin America Market Value (USD Million) Forecast by Supply Route, 2021 to 2036
- Table 29: Middle East Market Value (USD Million) Forecast by Country, 2021 to 2036
- Table 30: Middle East Market Value (USD Million) Forecast by Source, 2021 to 2036
- Table 31: Middle East Market Value (USD Million) Forecast by End Use, 2021 to 2036
- Table 32: Middle East Market Value (USD Million) Forecast by Supply Route, 2021 to 2036
List of Figures
- Figure 1: Global Market Pricing Analysis
- Figure 2: Global Market Value (USD Million) Forecast 2021-2036
- Figure 3: Global Market Value Share and BPS Analysis by Source, 2026 and 2036
- Figure 4: Global Market Y-o-Y Growth Comparison by Source, 2026-2036
- Figure 5: Global Market Attractiveness Analysis by Source
- Figure 6: Global Market Value Share and BPS Analysis by End Use, 2026 and 2036
- Figure 7: Global Market Y-o-Y Growth Comparison by End Use, 2026-2036
- Figure 8: Global Market Attractiveness Analysis by End Use
- Figure 9: Global Market Value Share and BPS Analysis by Supply Route, 2026 and 2036
- Figure 10: Global Market Y-o-Y Growth Comparison by Supply Route, 2026-2036
- Figure 11: Global Market Attractiveness Analysis by Supply Route
- Figure 12: Global Market Value (USD Million) Share and BPS Analysis by Region, 2026 and 2036
- Figure 13: Global Market Y-o-Y Growth Comparison by Region, 2026-2036
- Figure 14: Global Market Attractiveness Analysis by Region
- Figure 15: East Asia Market Incremental Dollar Opportunity, 2026-2036
- Figure 16: South Asia Market Incremental Dollar Opportunity, 2026-2036
- Figure 17: North America Market Incremental Dollar Opportunity, 2026-2036
- Figure 18: Western Europe Market Incremental Dollar Opportunity, 2026-2036
- Figure 19: Eastern Europe Market Incremental Dollar Opportunity, 2026-2036
- Figure 20: Latin America Market Incremental Dollar Opportunity, 2026-2036
- Figure 21: Middle East Market Incremental Dollar Opportunity, 2026-2036
- Figure 22: East Asia Market Value Share and BPS Analysis by Country, 2026 and 2036
- Figure 23: East Asia Market Value Share and BPS Analysis by Source, 2026 and 2036
- Figure 24: East Asia Market Y-o-Y Growth Comparison by Source, 2026-2036
- Figure 25: East Asia Market Attractiveness Analysis by Source
- Figure 26: East Asia Market Value Share and BPS Analysis by End Use, 2026 and 2036
- Figure 27: East Asia Market Y-o-Y Growth Comparison by End Use, 2026-2036
- Figure 28: East Asia Market Attractiveness Analysis by End Use
- Figure 29: East Asia Market Value Share and BPS Analysis by Supply Route, 2026 and 2036
- Figure 30: East Asia Market Y-o-Y Growth Comparison by Supply Route, 2026-2036
- Figure 31: East Asia Market Attractiveness Analysis by Supply Route
- Figure 32: South Asia Market Value Share and BPS Analysis by Country, 2026 and 2036
- Figure 33: South Asia Market Value Share and BPS Analysis by Source, 2026 and 2036
- Figure 34: South Asia Market Y-o-Y Growth Comparison by Source, 2026-2036
- Figure 35: South Asia Market Attractiveness Analysis by Source
- Figure 36: South Asia Market Value Share and BPS Analysis by End Use, 2026 and 2036
- Figure 37: South Asia Market Y-o-Y Growth Comparison by End Use, 2026-2036
- Figure 38: South Asia Market Attractiveness Analysis by End Use
- Figure 39: South Asia Market Value Share and BPS Analysis by Supply Route, 2026 and 2036
- Figure 40: South Asia Market Y-o-Y Growth Comparison by Supply Route, 2026-2036
- Figure 41: South Asia Market Attractiveness Analysis by Supply Route
- Figure 42: North America Market Value Share and BPS Analysis by Country, 2026 and 2036
- Figure 43: North America Market Value Share and BPS Analysis by Source, 2026 and 2036
- Figure 44: North America Market Y-o-Y Growth Comparison by Source, 2026-2036
- Figure 45: North America Market Attractiveness Analysis by Source
- Figure 46: North America Market Value Share and BPS Analysis by End Use, 2026 and 2036
- Figure 47: North America Market Y-o-Y Growth Comparison by End Use, 2026-2036
- Figure 48: North America Market Attractiveness Analysis by End Use
- Figure 49: North America Market Value Share and BPS Analysis by Supply Route, 2026 and 2036
- Figure 50: North America Market Y-o-Y Growth Comparison by Supply Route, 2026-2036
- Figure 51: North America Market Attractiveness Analysis by Supply Route
- Figure 52: Western Europe Market Value Share and BPS Analysis by Country, 2026 and 2036
- Figure 53: Western Europe Market Value Share and BPS Analysis by Source, 2026 and 2036
- Figure 54: Western Europe Market Y-o-Y Growth Comparison by Source, 2026-2036
- Figure 55: Western Europe Market Attractiveness Analysis by Source
- Figure 56: Western Europe Market Value Share and BPS Analysis by End Use, 2026 and 2036
- Figure 57: Western Europe Market Y-o-Y Growth Comparison by End Use, 2026-2036
- Figure 58: Western Europe Market Attractiveness Analysis by End Use
- Figure 59: Western Europe Market Value Share and BPS Analysis by Supply Route, 2026 and 2036
- Figure 60: Western Europe Market Y-o-Y Growth Comparison by Supply Route, 2026-2036
- Figure 61: Western Europe Market Attractiveness Analysis by Supply Route
- Figure 62: Eastern Europe Market Value Share and BPS Analysis by Country, 2026 and 2036
- Figure 63: Eastern Europe Market Value Share and BPS Analysis by Source, 2026 and 2036
- Figure 64: Eastern Europe Market Y-o-Y Growth Comparison by Source, 2026-2036
- Figure 65: Eastern Europe Market Attractiveness Analysis by Source
- Figure 66: Eastern Europe Market Value Share and BPS Analysis by End Use, 2026 and 2036
- Figure 67: Eastern Europe Market Y-o-Y Growth Comparison by End Use, 2026-2036
- Figure 68: Eastern Europe Market Attractiveness Analysis by End Use
- Figure 69: Eastern Europe Market Value Share and BPS Analysis by Supply Route, 2026 and 2036
- Figure 70: Eastern Europe Market Y-o-Y Growth Comparison by Supply Route, 2026-2036
- Figure 71: Eastern Europe Market Attractiveness Analysis by Supply Route
- Figure 72: Latin America Market Value Share and BPS Analysis by Country, 2026 and 2036
- Figure 73: Latin America Market Value Share and BPS Analysis by Source, 2026 and 2036
- Figure 74: Latin America Market Y-o-Y Growth Comparison by Source, 2026-2036
- Figure 75: Latin America Market Attractiveness Analysis by Source
- Figure 76: Latin America Market Value Share and BPS Analysis by End Use, 2026 and 2036
- Figure 77: Latin America Market Y-o-Y Growth Comparison by End Use, 2026-2036
- Figure 78: Latin America Market Attractiveness Analysis by End Use
- Figure 79: Latin America Market Value Share and BPS Analysis by Supply Route, 2026 and 2036
- Figure 80: Latin America Market Y-o-Y Growth Comparison by Supply Route, 2026-2036
- Figure 81: Latin America Market Attractiveness Analysis by Supply Route
- Figure 82: Middle East Market Value Share and BPS Analysis by Country, 2026 and 2036
- Figure 83: Middle East Market Value Share and BPS Analysis by Source, 2026 and 2036
- Figure 84: Middle East Market Y-o-Y Growth Comparison by Source, 2026-2036
- Figure 85: Middle East Market Attractiveness Analysis by Source
- Figure 86: Middle East Market Value Share and BPS Analysis by End Use, 2026 and 2036
- Figure 87: Middle East Market Y-o-Y Growth Comparison by End Use, 2026-2036
- Figure 88: Middle East Market Attractiveness Analysis by End Use
- Figure 89: Middle East Market Value Share and BPS Analysis by Supply Route, 2026 and 2036
- Figure 90: Middle East Market Y-o-Y Growth Comparison by Supply Route, 2026-2036
- Figure 91: Middle East Market Attractiveness Analysis by Supply Route
- Figure 92: Global Market - Tier Structure Analysis
- Figure 93: Global Market - Company Share Analysis
Frequently Asked Questions
How big is the Dead-Burned magnesia market in 2026?
FMI estimates the market at USD 1,742.5 million in 2026, up from USD 1,700.0 million in 2025. It is forecast to reach USD 2,341.8 million by 2036 at a 3.0% CAGR.
Which source leads the Dead-Burned magnesia market in 2026?
Natural Magnesite leads by source with 66.0% in 2026. All other segments together hold 34.0%.
Which end use and supply route lead in 2026?
Steel Refractories holds 68.0% by end use and Merchant Sales holds 56.0% by supply route in FMI's 2026 assessment.
Which market is forecast to grow fastest through 2036?
India has the highest forecast CAGR at 5.0% during 2026 to 2036, followed by Turkey, Brazil and Iran at 3.5%.
Which named country grows fastest?
India has the highest forecast CAGR at 5.0% from 2026 to 2036. China remains the largest 2026 revenue market at USD 522.8 million.
Preview the report firsthand - request a free sample
Get SampleGet the brochure for pricing and purchase details.
Get PDF
