
- Market Size (2026)
- USD 618.0 Mn
- Forecast (2036)
- USD 914.8 Mn
- CAGR (2026 to 2036)
- 4.0%
How big is the Fused Magnesia Market in 2026?
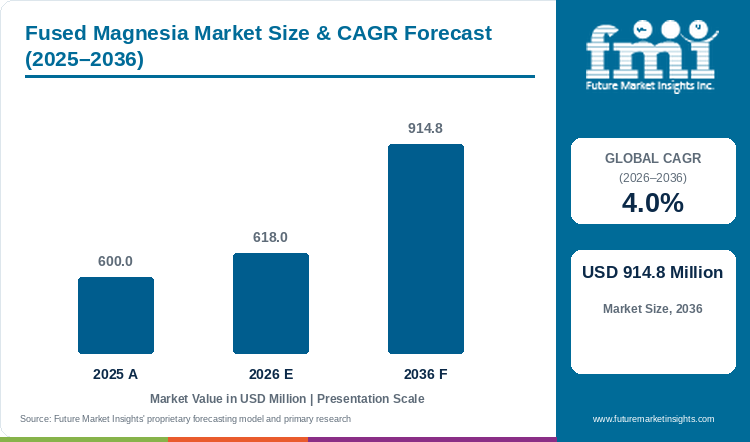
FMI projects the global fused magnesia market at USD 914.8 million in 2036, a 4.0% CAGR over 2026 to 2036. The market was valued at USD 600.0 million in 2025 and is estimated at USD 618.0 million in 2026.
Fused Magnesia Market Size and Forecast
Table 1: Fused Magnesia Market Size and Forecast
| Market size and forecast | Value |
|---|---|
| Market size in 2025 | USD 600.0 million |
| Estimated market size in 2026 | USD 618.0 million |
| Projected market size by 2036 | USD 914.8 million |
| CAGR from 2026 to 2036 | 4.0% |
Source: Future Market Insights analysis of the fused magnesia market, 2026.
Steel customers are pressing refractory suppliers on price even when their own production requires premium furnace linings. RHI Magnesita's March 2026 results described deferred industrial rebuilds and pressure from Chinese refractory exports during 2025. FMI's outlook therefore combines modest tonnage growth with a gradual increase in the value of electrical and specialty grades.
Supply investment is also becoming more selective. Hengrui reports that its Naiman Phase I large-crystal fused magnesia line entered trial production in January 2026. Buyers value the grade and consistency a furnace delivers more than its installed capacity. Furnace-lining customers and heating-element customers leave different openings for suppliers: competitively priced refractory grain for established furnace formulations, and processed powder approved against a component manufacturer's operating conditions. The wider magnesium oxide market covers other production routes and applications.
Key Market Trends & Insights
- Refractory demand follows mill output more than steel capacity announcements. worldsteel reported 1,849.4 million tonnes of global crude steel output in 2025, down from the preceding year. Lower output limits the immediate replacement pull from existing linings.
- Electrical insulation powders compete through handling and finished-heater performance. Tateho identifies powder flow and packing density as manufacturing variables, making downstream processing a separate source of value after fusion.
- Environmental documentation is becoming product specific. Kümaş publishes a verified cradle-to-gate footprint for fused magnesite using a defined reporting period, giving buyers a basis for comparing procurement emissions alongside grade.
Regional Highlights
- The weight of India in global revenue increases. FMI projects India from 9.0% to 10.9% by 2036.
- Germany, Japan and Italy grow more slowly than the global total, so their share slips. FMI projects Germany at 5.2% against 6.0% in 2026, Japan at 7.3% against 8.0% in 2026 and Italy at 2.6% against 3.0% in 2026 by 2036.
Analyst Perspective
“The best commercial opening lies between basic fused grain and an approved finished powder. Steel-facing suppliers need dependable refractory performance at a defensible delivered cost. Electrical specialists need repeatability in the customer's filling and testing process. Expansion that does not resolve one of those requirements risks adding tonnes to a price-sensitive market without creating a durable reason to renew the order.”
- Nikhil Kaitwade, Principal Consultant, FMI
How is the Fused Magnesia Market segmented?
- By grade: Refractory Grade, Electrical Grade, and Other Grades.
- By end use: Steel and Metallurgy Refractories, Heating Elements, Cement and Glass Furnaces, and Electronics and Other.
- By product form: Sized Grain, Electrical Insulation Powder, and Lumps and Other.
- By region: East Asia, South Asia, North America, Europe, Latin America, and the Rest of world aggregate.
Why does the Refractory Grade segment lead by Grade in the Fused Magnesia Market in 2026?
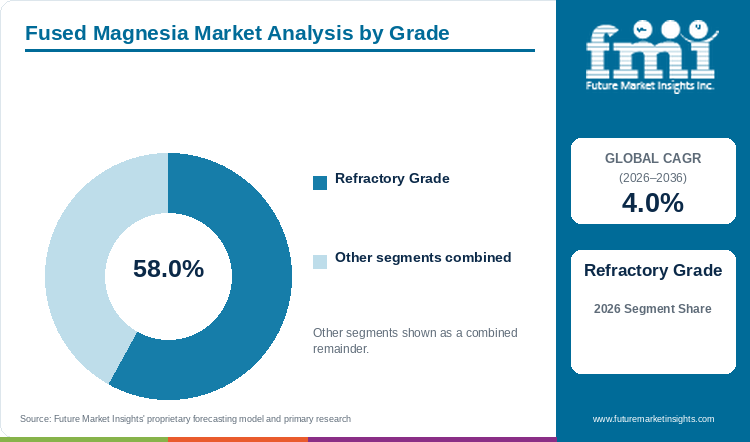
The Refractory Grade segment holds 58.0% of the Fused Magnesia Market by grade in 2026.
Refractory grain serves a large established replacement business. A technical review in Refractories identifies fused magnesia as a raw material for magnesia-carbon bricks used in converters, electric furnaces and ladle slag lines. It also highlights energy demand and quality variation as production difficulties. The connection to specific wear zones explains why refractory sales remain substantial even when steelmakers postpone a major plant investment. The grain's customer base sits within the wider refractories market.
The commercial challenge is that the brick maker sells lining performance while purchasing several mineral and binder inputs. An increase in the price of fused grain must be justified within that finished formulation. Lower-priced substitutes and a change in the blend are therefore credible competitive pressures. A producer's advantage depends on consistency in the specification a customer has already qualified, more than on a high headline MgO content.
FMI projects Refractory Grade revenue of USD 488.0 million in 2036, at a 3.1% CAGR. Its share falls to 53.3% as Electrical Grade expands faster. Suppliers that depend on this leading category need to protect their position in repeat lining programmes while developing a technically distinct offer for other uses.
Electrical Grade and Other Grades together hold the remaining 42.0% by grade.
Table 2: Grade, 2026 Share
| Leading Share | 2026 market share |
|---|---|
| Refractory Grade | 58.0% |
| All Other Segments Combined Share | 42.0% |
Source: Future Market Insights analysis of the fused magnesia market, 2026.
Why does the Steel and Metallurgy Refractories segment lead by End Use in the Fused Magnesia Market in 2026?
The Steel and Metallurgy Refractories segment holds 56.0% of the Fused Magnesia Market by end use in 2026.
The leading end use has two sources of orders: replacement within operating steel facilities and initial lining packages for a new or changed process. They occur on different schedules. Initial purchases are followed by commissioning and then a plant-specific pattern of repair and replacement.
POSCO's June 2026 announcement of its completed Gwangyang electric arc furnace illustrates the investment route. The facility has an annual capacity of 2.5 million tonnes. FMI interprets such projects as opportunities to qualify the lining system for a new operating duty. The equipment side of furnace investments of this kind is covered in FMI's industrial furnaces market.
By 2036, this end use reaches USD 457.4 million and a 50.0% share. Heating Elements grows from USD 123.6 million to USD 217.7 million, giving suppliers a second substantial outlet. Technical ceramics provide a further adjacent context through the industrial ceramics market.
Heating Elements, Cement and Glass Furnaces and Electronics and Other together account for the remaining 44.0% by end use.
Table 3: End Use, 2026 Share
| Leading Share | 2026 market share |
|---|---|
| Steel and Metallurgy Refractories | 56.0% |
| All Other Segments Combined Share | 44.0% |
Source: Future Market Insights analysis of the fused magnesia market, 2026.
Why does the Sized Grain segment lead by Product Form in the Fused Magnesia Market in 2026?
The Sized Grain segment holds 62.0% of the Fused Magnesia Market by product form in 2026.
Sized grain is the form that refractory brick makers and lining producers buy, because a lining formulation combines graded fractions with binders and carbon. A technical review in Refractories identifies fused magnesia as a raw material for magnesia-carbon bricks used in converters, electric furnaces and ladle slag lines. The grain form therefore follows the replacement cycle of steel and metallurgical linings more closely than any electrical demand.
Powder follows a different value logic. One producer identifies powder flow and packing density as manufacturing variables, which makes downstream processing a separate source of value after fusion. Another markets a dead-burned-based product for lower-temperature heaters, so electrical powder also meets a substitute route in part of its customer base. A supplier selling both forms must price grain on furnace economics and powder on finished-heater performance.
FMI's 2026 assessment values Sized Grain at USD 383.2 million, with Electrical Insulation Powder and Lumps and Other sharing the remainder. The grain share should ease as powder sales develop, although grain stays the volume base for lining replacement. A producer that treats the two forms as one product line risks pricing powder without regard to its processing cost.
Electrical Insulation Powder and Lumps and Other together hold the remaining 38.0% by product form.
Table 4: Product Form, 2026 Share
| Leading Share | 2026 market share |
|---|---|
| Sized Grain | 62.0% |
| All Other Segments Combined Share | 38.0% |
Source: Future Market Insights analysis of the fused magnesia market, 2026.
What are the key drivers restraints and opportunities?
Steel replacement demand anchors the market. Furnace electricity exposure and price competition constrain returns, while electrical powder finishing offers a route to higher-value sales.
Driver
Continuing replacement of refractory wear zones links fused grain demand to the operating base of steel and metallurgical furnaces.
Restraint
Mineral suppliers face pressure when energy-intensive production costs cannot be recovered through refractory contract prices.
Opportunity
Grade-specific milling, classification and treatment create a differentiated offer for heating-element manufacturers.
How do purchasing rules and qualification affect fused magnesia market demand?
New furnace routes alter the lining opportunity even where national steel output grows slowly. Nippon Steel decided in May 2025 to invest in three Japanese electric arc furnace projects targeted for completion by fiscal 2029. Such changes require refractory suppliers to match their formulations to a different process and commissioning timetable. Fused grain producers participate through the material specified by those suppliers, instead of through a direct claim on every tonne of new steel capacity.
Electrical Grade has a separate growth path. Its forecast CAGR of 5.9% exceeds Refractory Grade's 3.1%. The benefit accrues to producers that can maintain the physical and electrical characteristics required after fusion. The resulting sales mix is more valuable than an equal increase in commodity refractory grain, although customer qualification limits the speed with which new output can be sold.
What limits reliable fused magnesia market supply and quality?
The central risk is a mismatch between the cost of production and the customer's ability to pass that cost through. RHI Magnesita's 2025 half-year disclosure said higher alumina and fused magnesia raw-material costs were difficult to recover from customers. This is evidence from one refractory group, but it directly identifies the commercial squeeze between mineral purchasing and finished-product pricing.
Substitution also operates within electrical insulation. Grecian Magnesite markets a dead-burned-based product for lower-temperature heaters. Fused powder therefore competes against a different production route in part of its addressable customer base. A higher purity or a fused origin has limited commercial value where the application already meets its operating requirements with a cheaper qualified material.
Where can suppliers win additional business in the fused magnesia market?
The clearest supplier opportunity is a finished powder whose behaviour is stable in the customer's manufacturing process. Kümaş offers low-iron fused magnesite in classified fractions and both coated and uncoated forms. This provides a concrete example of differentiation after the furnace stage. An offer built around a defined temperature duty, packing behaviour and agreed test procedure is easier to defend than a broad claim of premium quality.
Procurement also increasingly distinguishes the production route behind the product. Product-specific emissions documentation gives suppliers another basis for comparison, provided its boundary and reporting year are stated. Buyers must compare the same delivered grade and process boundary before assigning value to the environmental result.
Fused Magnesia Market by Country (2026 to 2036)
Table 5: Fused Magnesia Market Country Growth Forecast
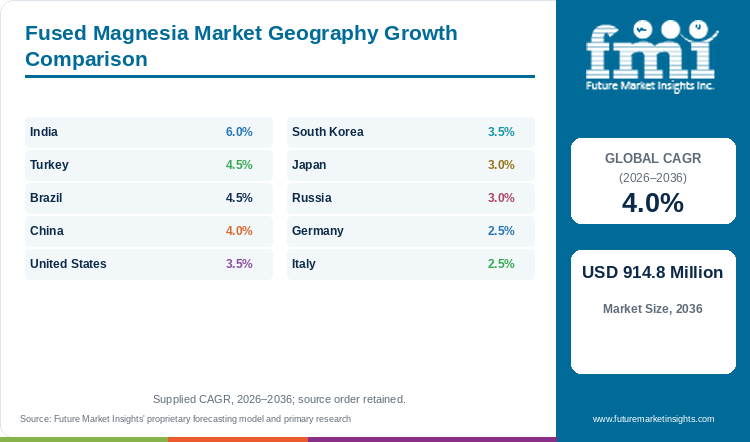
| Country | CAGR, 2026 to 2036 |
|---|---|
| India | 6.0% |
| Turkey | 4.5% |
| Brazil | 4.5% |
| China | 4.0% |
| United States | 3.5% |
| South Korea | 3.5% |
| Japan | 3.0% |
| Russia | 3.0% |
| Germany | 2.5% |
| Italy | 2.5% |
Source: Future Market Insights analysis of the fused magnesia market, 2026.
India
India offers the clearest expansion case among the countries covered. Its market grows from USD 55.6 million in 2026 to USD 99.6 million in 2036, with a 6.0% CAGR during 2026 to 2036. The revenue share rises from 9.0% to 10.9%, indicating a larger role in global mineral purchasing over the decade.
The Ministry of Steel reported around 168.4 million tonnes of crude steel output for India's April 2025 to March 2026 financial year. It also described continuing investment in additional steel capacity. These figures establish an expanding downstream production base, but the commercial opportunity for fused magnesia is more specific than the national steel headline. Suppliers need to reach the refractory producers and plant programmes that use fused grain in the relevant formulation.
A rapidly growing mill network requires both initial lining packages and replacement supply. The first order is tied to construction and commissioning. Subsequent orders depend on actual operation and the performance of the installed lining.
The strongest pricing position will come from a product that survives a meaningful operating comparison. Competing only on the landed price of a tonne leaves the supplier exposed when a refractory producer changes its blend. FMI expects India's rising revenue share to support additional qualified sources, with local technical support and predictable shipment execution determining which exporters retain business after the initial project order.
Turkey
Turkey has an integrated supply position as well as domestic end-user demand. Kümaş states that it produces fused magnesite from its own calcined magnesite and supplies processed fractions for high-temperature resistance applications. That connection between feedstock and finished fraction is commercially different from importing undifferentiated grain for resale.
FMI forecasts a 4.5% CAGR for the Turkish market during 2026 to 2036. Revenue grows from USD 18.5 million to USD 28.8 million. The national share increases from 3.0% to 3.1%, giving Turkey a small but expanding position within the overall outlook. The gain of USD 10.3 million equals 3.5% of the global increase of USD 296.8 million. Turkey contributes USD 10.3 million of new revenue, joint sixth of ten.
Product documentation offers another point of differentiation. Kümaş's verified carbon-footprint statement uses a cradle-to-gate boundary and a 2023 data period. Its relevance is the presence of a specified measurement basis. A purchaser comparing material from different origins still needs equivalent boundaries and a comparable grade before drawing a cost or emissions conclusion.
The national opportunity is strongest where an integrated producer converts raw-material control into a consistent product offer. Coated and uncoated powder provide different ways to serve a heater account, while refractory grain serves another customer requirement. The commercial test is the saleable grade and the customer programme it secures, not the breadth of the producer's catalogue.
Brazil
Brazil's outlook must separate the country's mineral supply role from the activity of its local steel customers. worldsteel reported 33.3 million tonnes of Brazilian crude steel production in 2025, down 1.6%. This is a restrained starting point for refractory consumption even though the country remains an important industrial market.
FMI assigns Brazil a CAGR of 4.5% from 2026 to 2036. Fused magnesia revenue rises from USD 18.5 million to USD 28.8 million, with its global share edging up to 3.1%. This forecast allows for improvement over the decade, but it does not turn a weak base-year steel result into evidence of an immediate increase in mineral orders.
The supplier's opportunity is linked to the timing and value of furnace maintenance. An order for a higher-performing grain must earn its place within the refractory system used by a specific plant. A longer service interval can be valuable to the customer while also reducing the number of tonnes purchased per year. Market revenue therefore depends on the balance between grade realization and consumption intensity, not just the amount of crude steel produced.
Brazilian accounts also provide a useful distinction between regional sourcing and a globally managed refractory contract. A supplier may reach the mill through a refractory group instead of through a direct raw-material order. FMI expects the strongest offers to match the actual procurement relationship and the agreed operating specification. A sales approach built only around national steel growth would overlook both the maintenance cycle and the role of the finished refractory supplier.
China
China combines the largest domestic revenue base with a central position in international magnesia supply. FMI assigns the country USD 222.5 million in 2026, equal to 36.0% of global revenue. Demand reaches USD 329.1 million in 2036 at a 4.0% CAGR over 2026 to 2036. The market's importance therefore extends beyond the rate at which its own steel customers expand. China tracks global growth at 4.0%. Its share of global revenue holds at 36.0% in both 2026 and 2036. China ranks first of ten on 2026 revenue. In the fused magnesia market, China adds USD 106.6 million, ranking first for increase. That increase equals 35.9% of the global gain of USD 296.8 million.
USGS describes Liaoning's magnesite sector as undergoing consolidation. Its 2026 summary reports that the number of mining enterprises fell from 114 to 63 between 2020 and 2024. A producer still needs suitable feedstock, electricity and a grade that the customer will accept.
The technical literature describes substantial fusion capacity in southern Liaoning alongside supply-demand imbalance and quality variation. Refractory customers can compare several Chinese grades, while electrical customers require processing that fits their own production line. A Chinese supplier that improves the saleable consistency of its output has a more defensible opening than one that adds furnace capacity without a committed grade-specific customer base.
United States
The United States is a market in which the source of a qualified mineral remains commercially important. USGS reports that China supplied 69.0% of US imports in the combined dead-burned and fused magnesia category during 2021 to 2024.
FMI projects US fused magnesia revenue of USD 43.3 million in 2026 and USD 61.0 million in 2036. The 3.5% CAGR covers 2026 to 2036. This is a moderate demand increase, with procurement continuity offering a separate reason for customers to consider another qualified source. A second source must still match the refractory or electrical product specification before it becomes a practical substitute. The United States contributes USD 17.7 million of new revenue, third of ten.
A refractory producer completed its acquisition of Resco in January 2025, expanding its North American production network. The development concerns downstream refractories instead of a disclosed new fused magnesia furnace. Its relevance is the location of the customer relationship and the production site through which raw material enters the finished lining offer.
For mineral producers, access to the US market therefore depends on both the importing route and the local refractory or component account. Inventory can reduce shipment uncertainty, but it does not resolve a technical mismatch. Suppliers that couple a stable grade with a realistic replenishment arrangement are better placed to retain business than those treating the United States as a destination for occasional surplus grain.
South Korea
South Korea has a concrete furnace investment that changes the near-term customer conversation. POSCO announced completion of its Gwangyang electric arc furnace in June 2026. For refractory and mineral suppliers, a completed installation provides a more immediate qualification context than a general decarbonization target. The subsequent consumption pattern will depend on commissioning and operating practice.
The Korean fused magnesia market is projected to rise from USD 30.9 million in 2026 to USD 43.5 million in 2036. FMI's CAGR stands at 3.5% over 2026 to 2036. Its revenue share declines slightly from 5.0% to 4.8%, meaning that modernization occurs within a market growing a little more slowly than the global total.
The commercial opening is to work through the refractory formulation and service arrangement attached to a changed furnace duty. A mineral supplier cannot infer the share of fused grain required from the project's steel capacity alone. Differences in lining design, repair practice and the number of heats between interventions all affect the order. Those details make the customer qualification more valuable than a broad statement that electric furnaces need refractories.
Korean purchasing also sits near China's established export supply chain. FMI expects competition to depend on the grade delivered and the ability to support a repeat specification under operating conditions. New installations give suppliers an entry point, but retaining that account requires results after the initial lining. The market therefore favours follow-through in performance and supply more than a one-time project sales claim.
Japan
Japan's outlook depends more on the specifications of new production routes than on a large increase in conventional steel tonnage. FMI forecasts a 3.0% CAGR for 2026 to 2036, taking the market from USD 49.4 million to USD 66.4 million. The country remains a meaningful revenue centre even as its global share eases from 8.0% to 7.3%. Japan's revenue grows 1.3 times over the decade, against 1.5 times globally.
Nippon Steel's announced investment in three domestic electric arc furnace projects creates a defined modernization timetable through fiscal 2029. That programme changes where lining qualifications and material trials may occur. Suppliers face a period in which established consumption and new process development overlap.
Japan also has a specialist electrical powder position. The DENMAG portfolio distinguishes refractory-oriented and electrical uses through grades and particle characteristics. For the market, this puts attention on the value of finishing and application approval. A Japanese customer's specification can create sales for processed powder even when the raw fused material has an international origin.
FMI sees a relatively restrained growth rate with room for higher-value product selection. Refractory grain suppliers should follow the actual furnace conversion schedule and the specifications developed around each project. Electrical suppliers need to demonstrate repeatability across the customer's heater manufacturing process. The two routes require different commercial support, making a single undifferentiated premium-grade claim inadequate for the national market.
Russia
Russia's steel base provides a substantial installed customer pool, but its starting production trend is subdued. worldsteel's January 2026 release estimated Russian crude steel output at 67.8 million tonnes in 2025, a decline of 4.5%.
FMI projects Russian market revenue of USD 24.7 million in 2026 and USD 33.2 million in 2036. The forecast CAGR stands at 3.0% over 2026 to 2036. A 3.0% CAGR leaves Russia 1.0 points below the 4.0% global pace. In the fused magnesia market, Russia ranks seventh of ten on 2026 revenue.
For the refractory chain, an existing furnace can continue generating wear-material orders even when a mill reduces its overall output. However, fewer operating heats can lengthen the calendar interval between some replacement purchases. The result is a sales schedule that may differ from a supplier's original annual tonnage plan. FMI therefore places weight on the actual maintenance programme behind an order and on whether the grade remains approved in the finished refractory.
Electrical and other specialty users provide diversification, though they do not automatically replace a lost large refractory account. The material's physical preparation and performance requirements can differ substantially. A supplier entering another end use needs a separate product qualification and delivery proposition. Russia's forecast is consequently a measured expansion of a mixed customer base, with repeat operating demand offering a firmer commercial foundation than broad industrial growth claims.
Germany
Germany begins the forecast with a demanding industrial backdrop. WV Stahl reported 9.3 million tonnes of first-quarter 2026 crude steel output, up 9.0% from a weak comparison period. The association nevertheless described persistent demand weakness and warned against interpreting the recovery as a full normalization.
FMI forecasts a 2.5% CAGR between 2026 and 2036. Revenue increases from USD 37.1 million to USD 47.4 million, while the global share falls from 6.0% to 5.2%. The market continues to purchase material for an established industrial base, but the forecast does not assume that every furnace returns to a historically stronger operating level.
Refractory suppliers serving this environment face a narrow balance between lining performance and the cash cost of maintenance. A mineral producer gains little by promoting a more expensive specification unless the resulting finished refractory offer solves a documented operating requirement. The important order may be a replacement in a specific wear zone instead of a complete new furnace package.
Electrical applications offer a different basis for competition. Processed powder can be assessed against the behaviour of a heating component, giving a supplier a route that is less directly dependent on national steel tonnage. FMI expects German purchasing to reward proven technical consistency and realistic stock commitments. The relatively low growth rate makes account retention important, because a lost qualification cannot necessarily be offset by a broad expansion in the market.
Italy
Italy presents a relatively compact market within a substantial steelmaking and manufacturing economy. Federacciai reports 20.7 million tonnes of steel production in 2025 and describes the country as Europe's second-largest steel producer.
FMI's Italian forecast is a CAGR of 2.5% during 2026 to 2036. Revenue increases from USD 18.5 million to USD 23.7 million. The share falls to 2.6% from 3.0%, placing greater importance on the quality of an individual customer position than on broad national volume expansion. Italy's share of global revenue eases from 3.0% to 2.6%. The USD 5.2 million rise over the decade ranks Italy last for increase.
The steel route is a repeat business tied to refractory performance and the customer's production programme. The alternative route is processed electrical powder used in a manufactured component. For a supplier considering both, the commercial overlap is limited by the different specifications.
This gives Italian customers two distinct purchasing questions. A mill or refractory producer evaluates the material within a furnace lining. A component manufacturer assesses the powder within a repeat production process. FMI expects suppliers to gain more from a clear application-specific proposition than from treating these customers as one interchangeable industrial group. In a slower-growing national market, a documented improvement in an existing product or delivery arrangement can be more consequential than an ambitious new capacity announcement elsewhere in the supply chain.
Who are the notable companies in the Fused Magnesia Market?
Notable companies in the Fused Magnesia Market include RHI Magnesita, Tateho Chemical Industries, Kumas Manyezit (Kümaş), Haicheng Houying Group and Liaoning Jinding Magnesite Group.
RHI Magnesita, Tateho Chemical Industries and Kümaş demonstrate different commercial positions. RHI combines raw-material exposure with downstream refractory relationships. Tateho specifies electrical and refractory-oriented powder grades. Kümaş links its calcined feedstock to fused magnesite processing. Their revenues cannot be compared as if each disclosed an equivalent stand-alone fused magnesia business.
Imerys requires a historical distinction. The former Imerys Fused Minerals Hull business was acquired by NICHE in 2019, as recorded by USGS, and Companies House identifies the current legal name as NICHE Fused Magnesia Limited. The old Hull name therefore should not be used to attribute that operation to Imerys today. Grecian Magnesite is relevant to electrical powder competition through its NICHE joint venture, whose Electromag CB uses dead-burned magnesia.
Haicheng Houying Group's upstream position is documented by Liaoning's industry authority, which identified a group-associated magnesite mine among the first integrated areas receiving permits in February 2023. Liaoning Jinding Magnesite Group has a separate historical raw-material relationship with RHI, recorded in the latter's 2006 joint-venture announcement. These relationships illustrate different routes into the magnesia chain. FMI does not assign company-level market shares or count a group relationship as an additional independent source of the same material.
Key Developments in the Fused Magnesia Market
- Hengrui reports that its Naiman Phase I large-crystal fused magnesia line entered trial production in January 2026. The company describes a 50,000.0-tonne annual Phase I capacity. Trial production is distinct from a verified year of sales at that capacity.
Key Players in the Fused Magnesia Market
- RHI Magnesita
- Tateho Chemical Industries
- Kumas Manyezit (Kümaş)
- Haicheng Houying Group
- Liaoning Jinding Magnesite Group
- Imerys, with its former Hull business now operating as NICHE Fused Magnesia Limited
- Grecian Magnesite, including its dead-burned-based electrical powder competition
Fused Magnesia Market Report Scope
Table 6: Fused Magnesia Market Report Scope
| Coverage field | Report scope |
|---|---|
| Market definition | Electrofused magnesium oxide produced in arc furnaces and sold as refractory, electrical and specialty grades. |
| Product boundary | Fused grain and processed fused powders for the listed end uses. |
| Exclusions | Magnesium metal, unfused ore, caustic-calcined and dead-burned magnesia sales, and the full value of finished bricks or heaters. |
| Quantitative Units | USD million |
| Grade coverage | Refractory Grade, Electrical Grade, Other Grades. |
| End-use coverage | Steel and Metallurgy Refractories, Heating Elements, Cement and Glass Furnaces, Electronics and Other. |
| Product Form coverage | Sized Grain, Electrical Insulation Powder, Lumps and Other. |
| Country coverage | China, India, Japan, United States, Germany, South Korea, Russia, Turkey, Brazil and Italy |
| Company coverage | RHI Magnesita, Imerys, Tateho Chemical Industries, Haicheng Houying Group, Liaoning Jinding Magnesite Group, Grecian Magnesite and Kumas Manyezit, with former and adjacent roles distinguished. |
Source: Future Market Insights analysis of the fused magnesia market, 2026.
Fused Magnesia Market Research Methodology
The assessment combines FMI's numerical outlook with secondary review of mineral statistics, steel production evidence, technical literature, product specifications and corporate records. Value and volume boundaries distinguish fused MgO from other magnesia routes and from finished products. Segment and country figures are reviewed for consistent years and units. Competitive findings distinguish historical business names, current operating entities and adjacent substitutes, while source-based developments retain their reported status.
Fused Magnesia Market by Segments
Fused Magnesia Market segmented by Grade:
- Refractory Grade
- Electrical Grade
- Other Grades
Fused Magnesia Market segmented by End Use:
- Steel and Metallurgy Refractories
- Heating Elements
- Cement and Glass Furnaces
- Electronics and Other
Fused Magnesia Market segmented by Product Form:
- Sized Grain
- Electrical Insulation Powder
- Lumps and Other
Fused Magnesia Market by Region
- East Asia
- China
- Japan
- South Korea
- South Asia
- India
- North America
- United States
- Western and Southern Europe
- Germany
- Italy
- Eastern Europe and Eurasia
- Russia
- Turkey
- Latin America
- Brazil
- Additional geographic coverage
- Rest of world aggregate
Research Sources and Bibliography
- Companies House. (Accessed 9 November 2026). NICHE Fused Magnesia Limited, company 02765383, overview and previous names.
- Federacciai. (Accessed 9 November 2026). Profilo, 2025 industry production and association coverage.
- Grecian Magnesite. (Accessed 9 November 2026). Electromag CB.
- Hengrui Magnesium Products. (Accessed 9 November 2026). Production Bases and Naiman Phase I timeline.
- Kümaş. (Accessed 9 November 2026). Heating Resistance: Fused Magnesite. https://kumasref.com/en/productsgroup/raw-materials-and-semi-finished-products/heating-resistance/fused-magnesite
- Liaoning Department of Industry and Information Technology. (25 August 2023). Response to proposal 0220 on green and high-end development of the magnesite industry. https://gxt.ln.gov.cn/gxt/zfxxgk/fdzdgknr/jyta/szxta/szxssjychy2023n/2023082511583149212/index.shtml
- Ministry of Steel, Government of India. (8 April 2026). Indian Steel Industry Shows Strong Growth Amid Emerging Challenges in 2025-26. Press Information Bureau, release 2250022. https://www.pib.gov.in/PressReleaseIframePage.aspx?PRID=2250022&lang=2®=48
- Nippon Steel. (Accessed 9 November 2026). Carbon Neutral Vision 2050, domestic electric arc furnace investment decision of May 2025. https://www.nipponsteel.com/en/carbon-neutral/zerocarbon.html
- POSCO. (22 June 2026). POSCO Accelerates Transition to Decarbonized Production System with Completion of Korea's Largest Electric Arc Furnace. https://newsroom.posco.com/en/posco-accelerates-transition-to-decarbonized-production-system-with-completion-of-koreas-largest-electric-arc-furnace/
- QSI for Kümaş Manyezit Sanayi A.Ş. (2 June 2024). Verification Statement SG-GNL-262/67, product carbon footprints, 2023 data period. https://kumasref.com/uploads/sertifika/1740124532.pdf
- RHI. (29 March 2006). RHI AG signs magnesia raw materials joint venture in China (ad hoc). https://ir.rhimagnesita.com/rhi-ag-signs-magnesia-raw-materials-joint-venture-in-china-ad-hoc/
- RHI Magnesita. (28 January 2025). RHI Magnesita expands footprint in North America through Resco Group acquisition. https://www.rhimagnesita.com/en/rhi-magnesita-expands-footprint-in-north-america-through-resco-group-acquisition/
- RHI Magnesita. (July 2025). 2025 Half Year Results. https://ir.rhimagnesita.com/wp-content/uploads/2025/07/rhim-rns-hy-2025.pdf
- RHI Magnesita. (2 March 2026). RHI Magnesita 2025 Full Year Results. https://www.rhimagnesita.com/rhi-magnesita-2025-full-year-results-disciplined-execution-and-strong-h2-performance-deliver-resilient-earnings-in-challenging-market-environment/
- Tateho Chemical Industries. (Accessed 9 November 2026). DENMAG Electrofused Magnesium Oxide, Japanese product specifications. https://tateho.co.jp/products/denmag
- Tateho Chemical Industries. (Accessed 9 November 2026). DENMAG Magnesium Oxide for Electrical Heater. https://tateho-chemical.com/products/denmag-other
- Tateho Chemical Industries. (Accessed 9 November 2026). How Magnesium Oxide is Used. https://tateho-chemical.com/tateho-labo/how-to-use
- US Geological Survey. (2019 reporting year). Minerals Yearbook: Magnesium Compounds, United Kingdom business transfer. https://pubs.usgs.gov/myb/vol1/2019/myb1-2019-magnesium-comp.pdf
- US Geological Survey. (2026). Mineral Commodity Summaries 2026, Magnesium Compounds. https://pubs.usgs.gov/periodicals/mcs2026/mcs2026-magnesium-compounds.pdf
- Wirtschaftsvereinigung Stahl. (24 April 2026). Leichte Erholung der Rohstahlproduktion in Deutschland im ersten Quartal 2026. https://www.wvstahl.de/pressemitteilungen/leichte-erholung-der-rohstahlproduktion-in-deutschland-im-ersten-quartal-2026/
- World Steel Association. (23 January 2026). December 2025 crude steel production and 2025 global crude steel production totals. https://worldsteel.org/media/press-releases/2026/december-2025-crude-steel-production-2025-global-crude-steel-production/
- You, J., Zhao, X., Qian, G., Zhang, X., Zhang, G., and Ma, B. (15 August 2024). Development status of fused magnesia in southern Liaoning. Refractories, 58(4), 357-361. DOI: 10.3969/j.issn.1001-1935.2024.04.016. https://www.nhcl.cn/CN/abstract/abstract4471.shtml
Table of Content
- Key Takeaways
- Market Size and CAGR
- Top Growth Driver
- Fastest Growing Segment
- Leading Region
- Key Companies
- Emerging Opportunities
- Executive Summary
- Global Market Outlook
- Demand-side Trends
- Supply-side Trends
- Technology Roadmap Analysis
- Analysis and Recommendations
- Analyst Perspective (What is happening? Why now? What should investors know?)
- Key Questions Answered
- How large is the market?
- What is the CAGR?
- What are key trends?
- Which region dominates?
- Who are the leaders?
Read More...
- Market Overview
- Market Coverage / Taxonomy
- Market Definition / Scope / Limitations
- Research Methodology
- Chapter Orientation
- Analytical Lens and Working Hypotheses
- Market Structure, Signals, and Trend Drivers
- Benchmarking and Cross-market Comparability
- Market Sizing, Forecasting, and Opportunity Mapping
- Research Design and Evidence Framework
- Desk Research Programme (Secondary Evidence)
- Expert Input and Fieldwork (Primary Evidence)
- Tooling, Models, and Reference Databases
- Data Engineering and Model Build
- Quality Assurance and Audit Trail
- Market Background
- Market Dynamics (Drivers, Restraints, Opportunity, Trends)
- Scenario Forecast (Optimistic, Likely, Conservative)
- Impact Analysis
- AI Impact
- Sustainability Impact
- Regulatory Impact
- Technology Impact
- Consumer / Buyer Analysis
- Purchase Drivers
- Adoption Barriers
- Buyer Journey
- Opportunity Map Analysis
- Product Life Cycle Analysis
- Supply Chain Analysis
- Investment Feasibility Matrix
- Value Chain Analysis
- PESTLE and Porter's Analysis
- Regulatory Landscape
- Regional Parent Market Outlook
- Production and Consumption Statistics
- Import and Export Statistics
- Global Market Analysis and Forecast, 2021 to 2036
- Historical Market Size Value (USD Million) Analysis, 2021 to 2025
- Current and Future Market Size Value (USD Million) Projections, 2026 to 2036
- Y-o-Y Growth Trend Analysis
- Absolute $ Opportunity Analysis
- Global Market Pricing Analysis, 2021 to 2036
- Global Market Analysis and Forecast, By Grade, 2021 to 2036
- Introduction / Key Findings
- Historical Market Size Value (USD Million) Analysis By Grade, 2021 to 2025
- Current and Future Market Size Value (USD Million) Analysis and Forecast By Grade, 2026 to 2036
- Refractory Grade
- Electrical Grade
- Other Grades
- Y-o-Y Growth Trend Analysis By Grade, 2021 to 2025
- Absolute $ Opportunity Analysis By Grade, 2026 to 2036
- Global Market Analysis and Forecast, By End Use, 2021 to 2036
- Introduction / Key Findings
- Historical Market Size Value (USD Million) Analysis By End Use, 2021 to 2025
- Current and Future Market Size Value (USD Million) Analysis and Forecast By End Use, 2026 to 2036
- Steel and Metallurgy Refractories
- Heating Elements
- Cement and Glass Furnaces
- Electronics and Other
- Y-o-Y Growth Trend Analysis By End Use, 2021 to 2025
- Absolute $ Opportunity Analysis By End Use, 2026 to 2036
- Global Market Analysis and Forecast, By Product Form, 2021 to 2036
- Introduction / Key Findings
- Historical Market Size Value (USD Million) Analysis By Product Form, 2021 to 2025
- Current and Future Market Size Value (USD Million) Analysis and Forecast By Product Form, 2026 to 2036
- Sized Grain
- Electrical Insulation Powder
- Lumps and Other
- Y-o-Y Growth Trend Analysis By Product Form, 2021 to 2025
- Absolute $ Opportunity Analysis By Product Form, 2026 to 2036
- Global Market Analysis and Forecast, By Region, 2021 to 2036
- Introduction
- Historical Market Size Value (USD Million) Analysis By Region, 2021 to 2025
- Current Market Size Value (USD Million) Analysis and Forecast By Region, 2026 to 2036
- East Asia
- South Asia
- North America
- Latin America
- Market Attractiveness Analysis By Region
- East Asia Market Analysis and Forecast, By Country
- Historical Market Size Value (USD Million) Trend Analysis By Market Taxonomy, 2021 to 2025
- Market Size Value (USD Million) Forecast By Market Taxonomy, 2026 to 2036
- By Country
- China
- Japan
- South Korea
- By Grade
- By End Use
- By Product Form
- By Country
- Market Attractiveness Analysis
- By Country
- By Grade
- By End Use
- By Product Form
- Key Takeaways
- South Asia Market Analysis and Forecast, By Country
- Historical Market Size Value (USD Million) Trend Analysis By Market Taxonomy, 2021 to 2025
- Market Size Value (USD Million) Forecast By Market Taxonomy, 2026 to 2036
- By Country
- India
- By Grade
- By End Use
- By Product Form
- By Country
- Market Attractiveness Analysis
- By Country
- By Grade
- By End Use
- By Product Form
- Key Takeaways
- North America Market Analysis and Forecast, By Country, 2021 to 2036
- Historical Market Size Value (USD Million) Trend Analysis By Market Taxonomy, 2021 to 2025
- Market Size Value (USD Million) Forecast By Market Taxonomy, 2026 to 2036
- By Country
- United States
- Western and Southern Europe
- Germany
- Italy
- Eastern Europe and Eurasia
- Russia
- Turkey
- By Grade
- By End Use
- By Product Form
- By Country
- Market Attractiveness Analysis
- By Country
- By Grade
- By End Use
- By Product Form
- Key Takeaways
- Latin America Market Analysis and Forecast, By Country
- Historical Market Size Value (USD Million) Trend Analysis By Market Taxonomy, 2021 to 2025
- Market Size Value (USD Million) Forecast By Market Taxonomy, 2026 to 2036
- By Country
- Brazil
- Additional geographic coverage
- Rest of world aggregate
- By Grade
- By End Use
- By Product Form
- By Country
- Market Attractiveness Analysis
- By Country
- By Grade
- By End Use
- By Product Form
- Key Takeaways
- Key Countries Market Analysis
- United States
- Pricing Analysis
- Market Share Analysis, 2025
- By Grade
- By End Use
- By Product Form
- Brazil
- Pricing Analysis
- Market Share Analysis, 2025
- By Grade
- By End Use
- By Product Form
- Germany
- Pricing Analysis
- Market Share Analysis, 2025
- By Grade
- By End Use
- By Product Form
- Italy
- Pricing Analysis
- Market Share Analysis, 2025
- By Grade
- By End Use
- By Product Form
- India
- Pricing Analysis
- Market Share Analysis, 2025
- By Grade
- By End Use
- By Product Form
- China
- Pricing Analysis
- Market Share Analysis, 2025
- By Grade
- By End Use
- By Product Form
- Japan
- Pricing Analysis
- Market Share Analysis, 2025
- By Grade
- By End Use
- By Product Form
- South Korea
- Pricing Analysis
- Market Share Analysis, 2025
- By Grade
- By End Use
- By Product Form
- Russia
- Pricing Analysis
- Market Share Analysis, 2025
- By Grade
- By End Use
- By Product Form
- Turkey
- Pricing Analysis
- Market Share Analysis, 2025
- By Grade
- By End Use
- By Product Form
- United States
- Market Structure Analysis
- Competition Dashboard
- Competition Benchmarking
- Market Share Analysis of Top Players
- By Regional
- By Grade
- By End Use
- By Product Form
- Emerging Startups
- Innovation Benchmarking
- Competition Analysis
- Competition Deep Dive
- RHI Magnesita
- Overview
- Product Portfolio
- Profitability by Market Segments
- Sales Footprint
- Strategy Overview
- Marketing Strategy
- Product Strategy
- Channel Strategy
- Tateho Chemical Industries
- Kumas Manyezit (Kümaş)
- Imerys
- Grecian Magnesite
- Haicheng Houying Group
- Liaoning Jinding Magnesite Group
- Imerys, with its former Hull business now operating as NICHE Fused Magnesia Limited
- Grecian Magnesite, including its dead-burned-based electrical powder competition
- RHI Magnesita
- Case Studies
- Success Stories
- Recent Developments
- Competition Deep Dive
- Assumptions & Acronyms Used
List of Tables
- Table 1: Global Market Value (USD Million) Forecast by Region, 2021 to 2036
- Table 2: Global Market Value (USD Million) Forecast by Grade, 2021 to 2036
- Table 3: Global Market Value (USD Million) Forecast by End Use, 2021 to 2036
- Table 4: Global Market Value (USD Million) Forecast by Product Form, 2021 to 2036
- Table 5: East Asia Market Value (USD Million) Forecast by Country, 2021 to 2036
- Table 6: East Asia Market Value (USD Million) Forecast by Grade, 2021 to 2036
- Table 7: East Asia Market Value (USD Million) Forecast by End Use, 2021 to 2036
- Table 8: East Asia Market Value (USD Million) Forecast by Product Form, 2021 to 2036
- Table 9: South Asia Market Value (USD Million) Forecast by Country, 2021 to 2036
- Table 10: South Asia Market Value (USD Million) Forecast by Grade, 2021 to 2036
- Table 11: South Asia Market Value (USD Million) Forecast by End Use, 2021 to 2036
- Table 12: South Asia Market Value (USD Million) Forecast by Product Form, 2021 to 2036
- Table 13: North America Market Value (USD Million) Forecast by Country, 2021 to 2036
- Table 14: North America Market Value (USD Million) Forecast by Grade, 2021 to 2036
- Table 15: North America Market Value (USD Million) Forecast by End Use, 2021 to 2036
- Table 16: North America Market Value (USD Million) Forecast by Product Form, 2021 to 2036
- Table 17: Latin America Market Value (USD Million) Forecast by Country, 2021 to 2036
- Table 18: Latin America Market Value (USD Million) Forecast by Grade, 2021 to 2036
- Table 19: Latin America Market Value (USD Million) Forecast by End Use, 2021 to 2036
- Table 20: Latin America Market Value (USD Million) Forecast by Product Form, 2021 to 2036
List of Figures
- Figure 1: Global Market Pricing Analysis
- Figure 2: Global Market Value (USD Million) Forecast 2021-2036
- Figure 3: Global Market Value Share and BPS Analysis by Grade, 2026 and 2036
- Figure 4: Global Market Y-o-Y Growth Comparison by Grade, 2026-2036
- Figure 5: Global Market Attractiveness Analysis by Grade
- Figure 6: Global Market Value Share and BPS Analysis by End Use, 2026 and 2036
- Figure 7: Global Market Y-o-Y Growth Comparison by End Use, 2026-2036
- Figure 8: Global Market Attractiveness Analysis by End Use
- Figure 9: Global Market Value Share and BPS Analysis by Product Form, 2026 and 2036
- Figure 10: Global Market Y-o-Y Growth Comparison by Product Form, 2026-2036
- Figure 11: Global Market Attractiveness Analysis by Product Form
- Figure 12: Global Market Value (USD Million) Share and BPS Analysis by Region, 2026 and 2036
- Figure 13: Global Market Y-o-Y Growth Comparison by Region, 2026-2036
- Figure 14: Global Market Attractiveness Analysis by Region
- Figure 15: East Asia Market Incremental Dollar Opportunity, 2026-2036
- Figure 16: South Asia Market Incremental Dollar Opportunity, 2026-2036
- Figure 17: North America Market Incremental Dollar Opportunity, 2026-2036
- Figure 18: Latin America Market Incremental Dollar Opportunity, 2026-2036
- Figure 19: East Asia Market Value Share and BPS Analysis by Country, 2026 and 2036
- Figure 20: East Asia Market Value Share and BPS Analysis by Grade, 2026 and 2036
- Figure 21: East Asia Market Y-o-Y Growth Comparison by Grade, 2026-2036
- Figure 22: East Asia Market Attractiveness Analysis by Grade
- Figure 23: East Asia Market Value Share and BPS Analysis by End Use, 2026 and 2036
- Figure 24: East Asia Market Y-o-Y Growth Comparison by End Use, 2026-2036
- Figure 25: East Asia Market Attractiveness Analysis by End Use
- Figure 26: East Asia Market Value Share and BPS Analysis by Product Form, 2026 and 2036
- Figure 27: East Asia Market Y-o-Y Growth Comparison by Product Form, 2026-2036
- Figure 28: East Asia Market Attractiveness Analysis by Product Form
- Figure 29: South Asia Market Value Share and BPS Analysis by Country, 2026 and 2036
- Figure 30: South Asia Market Value Share and BPS Analysis by Grade, 2026 and 2036
- Figure 31: South Asia Market Y-o-Y Growth Comparison by Grade, 2026-2036
- Figure 32: South Asia Market Attractiveness Analysis by Grade
- Figure 33: South Asia Market Value Share and BPS Analysis by End Use, 2026 and 2036
- Figure 34: South Asia Market Y-o-Y Growth Comparison by End Use, 2026-2036
- Figure 35: South Asia Market Attractiveness Analysis by End Use
- Figure 36: South Asia Market Value Share and BPS Analysis by Product Form, 2026 and 2036
- Figure 37: South Asia Market Y-o-Y Growth Comparison by Product Form, 2026-2036
- Figure 38: South Asia Market Attractiveness Analysis by Product Form
- Figure 39: North America Market Value Share and BPS Analysis by Country, 2026 and 2036
- Figure 40: North America Market Value Share and BPS Analysis by Grade, 2026 and 2036
- Figure 41: North America Market Y-o-Y Growth Comparison by Grade, 2026-2036
- Figure 42: North America Market Attractiveness Analysis by Grade
- Figure 43: North America Market Value Share and BPS Analysis by End Use, 2026 and 2036
- Figure 44: North America Market Y-o-Y Growth Comparison by End Use, 2026-2036
- Figure 45: North America Market Attractiveness Analysis by End Use
- Figure 46: North America Market Value Share and BPS Analysis by Product Form, 2026 and 2036
- Figure 47: North America Market Y-o-Y Growth Comparison by Product Form, 2026-2036
- Figure 48: North America Market Attractiveness Analysis by Product Form
- Figure 49: Latin America Market Value Share and BPS Analysis by Country, 2026 and 2036
- Figure 50: Latin America Market Value Share and BPS Analysis by Grade, 2026 and 2036
- Figure 51: Latin America Market Y-o-Y Growth Comparison by Grade, 2026-2036
- Figure 52: Latin America Market Attractiveness Analysis by Grade
- Figure 53: Latin America Market Value Share and BPS Analysis by End Use, 2026 and 2036
- Figure 54: Latin America Market Y-o-Y Growth Comparison by End Use, 2026-2036
- Figure 55: Latin America Market Attractiveness Analysis by End Use
- Figure 56: Latin America Market Value Share and BPS Analysis by Product Form, 2026 and 2036
- Figure 57: Latin America Market Y-o-Y Growth Comparison by Product Form, 2026-2036
- Figure 58: Latin America Market Attractiveness Analysis by Product Form
- Figure 59: Global Market - Tier Structure Analysis
- Figure 60: Global Market - Company Share Analysis
Frequently Asked Questions
How big is the fused magnesia market in 2026?
FMI estimates the market at USD 618.0 million in 2026, up from USD 600.0 million in 2025. It is forecast to reach USD 914.8 million by 2036 at a 4.0% CAGR.
Which grade leads the fused magnesia market in 2026?
Refractory Grade leads by grade with 58.0% in 2026. All other segments together hold 42.0%.
Which end use and product form lead in 2026?
Steel and Metallurgy Refractories holds 56.0% by end use and Sized Grain holds 62.0% by product form in FMI's 2026 assessment.
Which market is forecast to grow fastest through 2036?
India has the highest forecast CAGR at 6.0% during 2026 to 2036, followed by Turkey and Brazil at 4.5%.
Does electrical-grade magnesia always belong in the fused market?
No. Some electrical insulation powder uses dead-burned magnesia. The report includes fused material and distinguishes competing unfused products.[7]
Preview the report firsthand - request a free sample
Get SampleGet the brochure for pricing and purchase details.
Get PDF
