Reports

- Global Locations -

Headquarters

Future Market Insights, Inc.

Christiana Corporate, 200
Continental Drive, Suite 401,
Newark, Delaware - 19713,
United States

T: +1-845-579-5705

Americas

Future Market Insights, Inc.

616 Corporate Way, Suite 2-9018,
Valley Cottage, NY 10989, United States

T: +1-347-918-3531

MEA

Future Market Insights

1602-6 Jumeirah Bay X2 Tower, Plot No: JLT-PH2-X2A,
Jumeirah Lakes Towers, Dubai,
United Arab Emirates

Europe

Future Market Insights

3rd Floor, 207 Regent Street,
W1B 3HH London
United Kingdom

T: + 44 (0) 20 8123 9659
D: +44 (0) 20 3287 4268

Asia Pacific

Future Market Insights

IndiaLand Global Tech Park, Unit UG-1, Behind Grand HighStreet, Phase 1, Hinjawadi, MH, Pune – 411057, India

DNS Security Market Outlook (2023 to 2033)

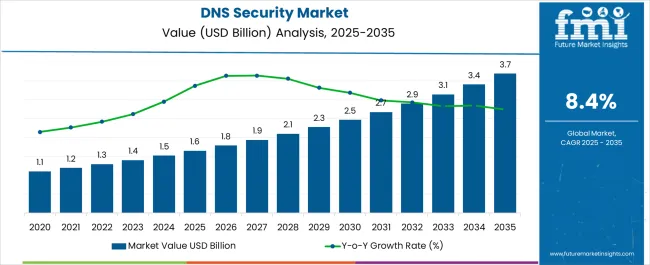
The global DNS security market revenue totaled US$ 1,388.8 Million in 2023. The DNS security market is expected to reach US$ 3,120.8 Million by 2033, growing at a CAGR of 8.4% for 2023 to 2033.

Attributes Details
Estimated Year (2023) DNS Security Market Value US$ 1,388.8 Million
Projected Year (2033) Market Value US$ 3,120.8 Million
CAGR% (2023 to 2033) 8.4%
Top 5 Vendor Market Share Around 40%

Domain Name System (DNS) security market currently represents about 5.5% of global network security market. DNS attacks prevention is becoming increasingly challenging, due to rising complexity of the IT network infrastructure. Organizations are facing different types of DNS attacks such as DDoS, volumetric attacks, amplification and reflection attacks, insidious or slow attacks and other sophisticated network attacks.

Cybercriminals are exploiting vulnerabilities and bugs to penetrate into the organization’s networks to steal critical data from applications, endpoints and enterprise servers. These attacks on domain name servers or networks can hamper organization productivity. It can also create network downtime by disrupting data privacy and network infrastructure functioning.

Market Statistics Details
Jan to Jun (H1), 2021 (A) 8.2%
Jul to Dec (H2), 2021 (A) 8.5%
Jan to Jun (H1),2022 Projected (P) 8.4%
Jan to Jun (H1),2022 Outlook (O) 8.6%
Jul to Dec (H2), 2022 Outlook (O) 8.9%
Jul to Dec (H2), 2022 Projected (P) 8.7%
Jan to Jun (H1), 2023 Projected (P) 8.6%
BPS Change : H1,2022 (O) - H1,2022 (P) (+)20
BPS Change : H1,2021 (O) - H1,2021 (A) (+)40
BPS Change: H2, 2022 (O) - H2, 2022 (P) (+)20
BPS Change: H2, 2021 (O) - H2, 2022 (A) (+)40

Don't pay for what you don't need

Customize your report by selecting specific countries or regions and save 30%!

2018 to 2022 DNS Security Demand Outlook Compared to 2023 to 2033 Forecast

According to Future Market Insights (FMI), the DNS security demand is estimated to grow at 8.4% CAGR between 2023 and 2033 as compared to 6.3% CAGR during the historic period of 2018 to 2022.

Growth in the market is underpinned by the adoption of the traditional firewall was prominent historically. DNS security or DNS Security Extension (DNSSEC) protects the organization against cyber-attacks by filtering out unwanted content and blacklisting malicious sites.

DNS security provides an additional layer of protection to the network. Also, it offers an authentication method for DNS data protection. It helps to protect the organization from denial of service (DOS), distributed denial of service (DDoS), DNS amplification, and DNS-related cyber-attacks.

Why Cloud-Based Deployment is the Most Efficient Platform for DNS Security Software?

By preventing DDoS attacks, cloud-based DNS security software offers benefits such as resiliency, scalability, and security. Cloud-based DNS security software also makes it easier for businesses to set up the DNSSEC which provides a cryptographic means of validating DNS records and providing protection against typical DNS security assaults.

Cloud-based DNS security software allows for better network monitoring and visibility, as well as simple and convenient network setup adjustments for businesses. As a result of this, a number of small and mid-sized enterprises are accepting that cloud deployment is an effective platform for DNS security software implementation.

Sudip Saha
Sudip Saha

Principal Consultant

Talk to Analyst

Find your sweet spots for generating winning opportunities in this market.

Which Region is considered to be the Most Lucrative DNS Security Market?

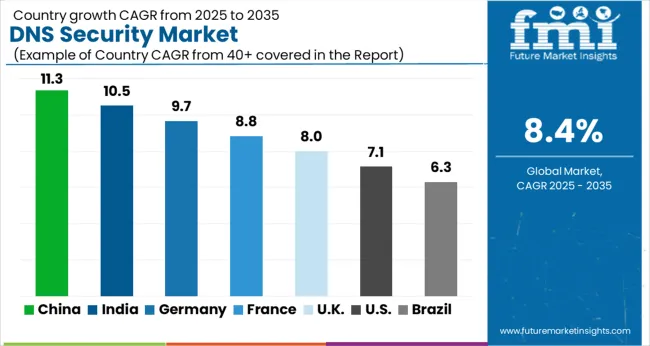
The DNS security market in South Asia and Pacific is expected to grow at the fastest rate. During the forecast period, the region is expected to grow by 10.8% CAGR, as countries such as India and China are being driven by improved security regulatory reforms.

However, North America is expected to account for the largest market share of 29.9% in 2023 in the DNS security market. Early adoption of the DNS security solutions and the presence of major network security vendor world drive market growth in the region. The organizations in the developed region are increasingly implementing DNS security solutions to recognize and prevent threats at the initial stages.
Country-wise Insights

Why is Adoption of DNS Security Increasing in India?

India DNS Security Market to Lead the Global Market through 2022 & beyond

The DNS security demand in India is expected to account for nearly 35% of the South Asia & Pacific market share through 2033. In 2021, India was the most impacted country in terms of DNS attacks. Major industries in India that are prone to cyber-attacks include telecom & IT, banking, healthcare, retail, e-commerce, among others.

For instance, as per FMI analysis, in May 2021, there was an increase in data theft through DNS-based attacks, with 26% of firms reporting that customer’s sensitive information was stolen by cyber-criminals in India. Hence, due to such factors, large enterprises and SMEs in India will continue to adopt DNS security solution to prevent network-based attacks.
How Big is the Opportunity for the USA DNS Security Market?

Growing Cyber Security Awareness in the USA to Push DNS Security Market

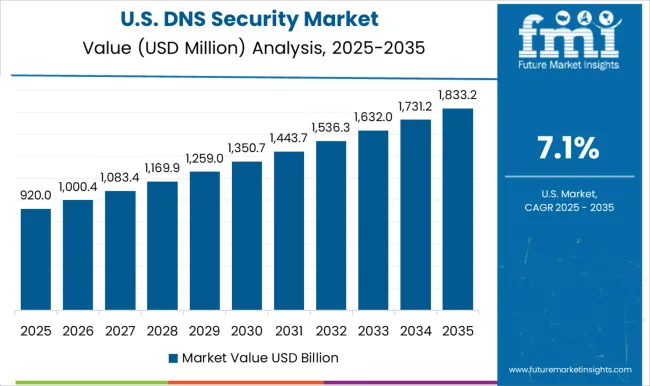
During the forecast period, the USA is expected to account for the largest market share of 72% in 2023 in North America DNS security market.

Increasing adoption of cloud-based DNS security solutions with DNS load balancing, multi DNS functionality, and DDoS protection capabilities are the major drivers of the DNS security market in the USA The untapped opportunities and growing awareness about cyber security among the country's users are estimated to drive growth in the USA market.

For an instance in March 2022, the USA government advised USA firms to enhance their cybersecurity policies as there is a chance of a cyber-attack from Russia for harming the economy of the country, due to Russia-Ukraine conflict. As a result, there will be an increase in adoption of DNS security solutions from North American organizations. Also, the growing small business industry is creating opportunities for growth that will enhance the DNS security market's growth throughout the forecast period.

How will Sales Prospects for DNS Security Unfold in South Korea?

Implementation of Comprehensive Cybersecurity Policies in South Korea to Boost DNS Security Market

Sales revenue in South Korea is estimated to grow at an impressive rate of around 9.8% CAGR between 2023 and 2033. South Korea is one of the most digitally connected and developing nations in the world.

Over the last three years, South Korea government has established better and more comprehensive cybersecurity policies focused on ensuring the capability to prepare, respond, and recover in both the private and public sectors.

South Korea has experienced large volume of cyber-attacks over the years. For instance, in June 2021, The Korean Atomic Energy Research Institute (KAERI), has claimed that it was hacked by the North Korean advanced persistent threat (APT) Group “Kimsuky”.

Due to such factors, South Korean private and public sector organizations will continue to implement DNS security solution, during the forecast period.

Countries BPS Change (H2'22 (O) - H2'22 (P))
USA (+)25
Germany (+)24
South Korea (+)22
Indian (+)26
China (+)23

The H2’22(O)-H2’22(P) BPS change in South Korea was of (+)22 units attributed to the rise in cyber-attacks and threats such as DDoS (Distributed Denial of Service), malware, phishing, and others is increasing the demand for DNS security solutions. Where as in India the widespread adoption of cloud computing and other Internet of Things (IoT) technologies has increased the need for secure and reliable DNS infrastructure leading to the deviation of (+)26 units.

The development of new and advanced DNS security solutions, such as DNSSEC (Domain Name System Security Extensions), is fuelling the growth of the market resulting in China a BPS change of (+)23 units.

Germany encountered a BPS change of (+)24 units for the IoT connectivity management platform market as the organizations becoming increasingly aware of the importance of DNS security, they are investing in solutions to secure their networks against cyber threats.

USA witnessed a BPS of (+)25 BPS units for the IoT connectivity management platform market owing to the implementation of strict government regulations such as the California Consumer Privacy Act (CCPA) is driving the demand for DNS security solutions to comply with data protection regulations.

Get the data you need at a Fraction of the cost

Personalize your report by choosing insights you need
and save 40%!

Category-wise Insights

Why Cloud-Based DNS Security Software is Gaining Traction?

Over 2 Out of 5 DNS Security Sales to be contributed by DNS Security Software

The cloud-based DNS security software segment accounted for around 43.7% market share in the global DNS security market in 2022. However, the segment is likely to grow by 2.5X between 2023 & 2033. The rising application of digital technologies such as AI/ML, IoT, and others are compelling industries to adopt such cloud-based network security solutions.

Enterprises are changing their applications and workload to cloud infrastructure, which offers features like cost-effectiveness, reliability, and scalability. Cloud-based DNS security solution allows businesses to scale up quickly with the help of real-time network configuration, monitoring with enhanced scalability and agility. Due to these reasons, the adoption of cloud-based DNS security solution is set to grow the highest.

Why is Adoption in Small and Mid-Sized Enterprises (SMEs) Surging for DNS Security?

Burgeoning Incidence of Cyber-Attacks in SMEs to Augment DNS Security Software Adoption

The SMEs segment is expected to grow by 2.3X during the forecast period, in the overall DNS security market. Furthermore, due to the increased digitalization across the globe, the segment is expected to showcase a strong growth over the upcoming years.

SMEs are highly investing in DNS security solutions to protect their networks against DDoS attacks and other threat vectors that might compromise the IT networks for the risk of being attacked. This rising awareness about DNS attacks, advanced cyber-attacks are directly impacting a company’s productivity and brand reputation. DNS security helps SMEs to improve data security and also helps to reduce financial losses.

Why is Demand for DNS Security Solutions is Rising in Telecom industry?

Surging Cyber-Attacks Due to Large Volume of Data to Increase DNS Security Solution Sales

In telecom industry, large volume of customer data and information are generated and stored within telecom network infrastructures. This data includes customer’s identity, payment and account details and other sensitive information. Hence, to gain access to such critical customer data, telecom industry is one of the highly targeted industry for network breaches and DNS-based attacks.

As per FMI analysis, nearly 2/3rd of major communication service providers in India have noticed network-based cyber-attacks in 2021, where DNS attacks are prominent one. These attacks also affected telco’s service continuity due to network and service downtime. Service downtime and data breaches are harming the organization’s reputation and trust which results in high customer churn rates. To preventing from cyber and DNS attacks telecom companies are implementing the DNS security solutions, globally.
Competitive Landscape

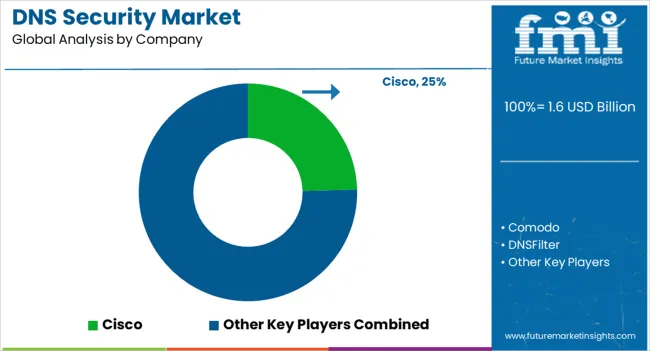
DNS security market players are focusing on various strategies for increasing their investments in research and development to upgrade their technologies as per the market requirement. Also, several organizations are acquiring and entering into a partnership with other companies to develop their own DNS security solution to serve the customer demand.

  • In September 2021, Whalebone partnered with F-Secure to integrate and build multi-layered DNS security approach to prevent mobile devices and edge network devices against sophisticated network attacks
  • In August 2020, IGIT collaborated strategically with NS1 and Cisco to provide agile DNS security application deployments for their customers in EMEA region.

Scope of Report

Attribute Details
Market value in 2023 US$ 1,388.8 Million
Market CAGR 2022 to 2033 8.4%
Share of top 5 players Around 40%
Forecast Period 2023 to 2033
Historical Data Available for 2018 to 2022
Market Analysis USD Million for Value
Key Regions Covered North America, Latin America, Europe, East Asia, South Asia & Pacific, and the Middle East & Africa
Key Countries Covered USA, Canada, Germany, United kingdom, France, Italy, Spain, Russia, China, Japan, South Korea, India, Malaysia, Indonesia, Singapore, Australia & New Zealand, GCC Countries, Turkey, North Africa and South Africa
Key Segments Covered Deployment, Enterprise Size, Industry and Region
Key Companies Profiled
  • Cisco
  • Comodo
  • DNSFilter
  • Webroot
  • Infoblox
  • TitanHQ
  • EfficientIP
  • Akamai
  • MXToolBox
  • F5 Networks
  • Bluecat
  • Neustar
  • CSIS Security Group
Report Coverage Market Forecast, Company Share Analysis, Competition Intelligence, DROT Analysis, Market Dynamics and Challenges, and Strategic Growth Initiatives
Customization & Pricing Available upon Request

Global DNS Security Market Outlook by Category

By Deployment:

  • Cloud-based DNS Security Software
  • On-premises DNS Security Software

By Enterprise Size:

  • Large Enterprises
  • Small and Medium-sized Enterprises (SMEs)

By Industry:

  • IT & Telecom
  • BFSI
  • Healthcare
  • Manufacturing
  • Retail
  • Government
  • Others

By Region:

  • North America
  • Latin America
  • Europe
  • East Asia
  • South Asia & Pacific
  • Middle East and Africa (MEA)

Frequently Asked Questions

What is the Value of DNS Security Market Share?

The total business of the overall market might create US$ 1,388.8 million in revenue in 2023.

What is the Future Scope of Growth for the DNS Security Market?

The global demand for DNS security services could surge at 8.4% CAGR through 2033.

What is the Driving Trend in the DNS Security Market?

Increasing cases of cyber-criminality is the key factor driving the global business.

Which is the Leading Country for the Adoption of DNS Security Services?

The United States leads with a record revenue share of 72% of North America in 2022.

Who are the Leaders in the Global DNS Security Market?

Cisco, Comodo, and DNSFilter are the top companies providing DNS security services.

Table of Content

1. Executive Summary | DNS Security Market

    1.1. Global Market Outlook

    1.2. Demand Side Trends

    1.3. Supply Side Trends

    1.4. Analysis and Recommendations

2. Market Overview

    2.1. Market Coverage / Taxonomy

    2.2. Market Definition / Scope / Limitations

3. Key Market Trends

    3.1. Key Trends Impacting the Market

    3.2. Solution Innovation / Development Trends

4. Pricing Analysis

    4.1. Types of Pricing Models

        4.1.1. Subscription Pricing

        4.1.2. Perpetual Licensing

    4.2. Average Pricing Analysis Benchmark

5. Global Market Demand (Value in US$ Million) Analysis 2018 to 2022 and Forecast, 2023 to 2033

    5.1. Historical Market Value (US$ Million) Analysis, 2018 to 2022

    5.2. Current and Future Market Value (US$ Million) Projections, 2023 to 2033

        5.2.1. Y-o-Y Growth Trend Analysis

        5.2.2. Absolute $ Opportunity Analysis

6. Market Background

    6.1. Macro-Economic Factors

    6.2. Forecast Factors - Relevance & Impact

    6.3. Value Chain

    6.4. COVID-19 Crisis – Impact Assessment

        6.4.1. Current Statistics

        6.4.2. Short-Mid-Long Term Outlook

        6.4.3. Likely Rebound

    6.5. Market Dynamics

        6.5.1. Drivers

        6.5.2. Restraints

        6.5.3. Opportunity Analysis

7. Global Market Analysis 2018 to 2022 and Forecast 2023 to 2033, by Deployment

    7.1. Introduction / Key Findings

    7.2. Historical Market Size (US$ Million) Analysis By Deployment, 2018 to 2022

    7.3. Current and Future Market Size (US$ Million) Analysis and Forecast By Deployment, 2023 to 2033

        7.3.1. On-Premise Software

        7.3.2. Cloud-based Software

    7.4. Market Attractiveness Analysis By Deployment

8. Global Market Analysis 2018 to 2022 and Forecast 2023 to 2033, by Enterprise Size

    8.1. Introduction / Key Findings

    8.2. Historical Market Size (US$ Million) Analysis By Enterprise Size, 2018 to 2022

    8.3. Current and Future Market Size (US$ Million) Analysis and Forecast By Enterprise Size, 2023 to 2033

        8.3.1. Small and Medium Enterprises(SMEs)

        8.3.2. Large Enterprises

    8.4. Market Attractiveness Analysis By Enterprise Size

9. Global Market Analysis 2018 to 2022 and Forecast 2023 to 2033, by Industry

    9.1. Introduction / Key Findings

    9.2. Historical Market Size (US$ Million) Analysis By Industry, 2018 to 2022

    9.3. Current and Future Market Size (US$ Million) Analysis and Forecast By Industry, 2023 to 2033

        9.3.1. IT & Telecom

        9.3.2. BFSI

        9.3.3. Healthcare

        9.3.4. Manufacturing

        9.3.5. Retail

        9.3.6. Government

        9.3.7. Others

    9.4. Market Attractiveness Analysis By Industry

10. Global Market Analysis 2018 to 2022 and Forecast 2023 to 2033, by Region

    10.1. Introduction

    10.2. Historical Market Size (US$ Million) Analysis By Region, 2018 to 2022

    10.3. Current and Future Market Size (US$ Million) Analysis and Forecast By Region, 2023 to 2033

        10.3.1. North America

        10.3.2. Latin America

        10.3.3. Europe

        10.3.4. East Asia

        10.3.5. South Asia and Pacific

        10.3.6. Middle East and Africa (MEA)

    10.4. Market Attractiveness Analysis By Region

11. North America Market Analysis 2018 to 2022 and Forecast 2023 to 2033

    11.1. Introduction

    11.2. Historical Market Size (US$ Million) and Trend Analysis By Market Taxonomy, 2018 to 2022

    11.3. Current and Future Market Size (US$ Million) and Forecast By Market Taxonomy, 2023 to 2033

        11.3.1. By Country

            11.3.1.1. USA

            11.3.1.2. Canada

        11.3.2. By Deployment

        11.3.3. By Enterprise Size

        11.3.4. By Industry

    11.4. Market Attractiveness Analysis

        11.4.1. By Country

        11.4.2. By Deployment

        11.4.3. By Enterprise Size

        11.4.4. By Industry

12. Latin America Market Analysis 2018 to 2022 and Forecast 2023 to 2033

    12.1. Introduction

    12.2. Historical Market Size (US$ Million) and Trend Analysis By Market Taxonomy, 2018 to 2022

    12.3. Current and Future Market Size (US$ Million) and Forecast By Market Taxonomy, 2023 to 2033

        12.3.1. By Country

            12.3.1.1. Brazil

            12.3.1.2. Mexico

            12.3.1.3. Rest of Latin America

        12.3.2. By Deployment

        12.3.3. By Enterprise Size

        12.3.4. By Industry

    12.4. Market Attractiveness Analysis

        12.4.1. By Country

        12.4.2. By Deployment

        12.4.3. By Enterprise Size

        12.4.4. By Industry

13. Europe Market Analysis 2018 to 2022 and Forecast 2023 to 2033

    13.1. Introduction

    13.2. Historical Market Size (US$ Million) and Trend Analysis By Market Taxonomy, 2018 to 2022

    13.3. Current and Future Market Size (US$ Million) and Forecast By Market Taxonomy, 2023 to 2033

        13.3.1. By Country

            13.3.1.1. Germany

            13.3.1.2. Italy

            13.3.1.3. France

            13.3.1.4. United kingdom

            13.3.1.5. Spain

            13.3.1.6. BENELUX

            13.3.1.7. Russia

            13.3.1.8. Rest of Europe

        13.3.2. By Deployment

        13.3.3. By Enterprise Size

        13.3.4. By Industry

    13.4. Market Attractiveness Analysis

        13.4.1. By Country

        13.4.2. By Deployment

        13.4.3. By Enterprise Size

        13.4.4. By Industry

14. South Asia and Pacific Market Analysis 2018 to 2022 and Forecast 2023 to 2033

    14.1. Introduction

    14.2. Historical Market Size (US$ Million) and Trend Analysis By Market Taxonomy, 2018 to 2022

    14.3. Current and Future Market Size (US$ Million) and Forecast By Market Taxonomy, 2023 to 2033

        14.3.1. By Country

            14.3.1.1. India

            14.3.1.2. Malaysia

            14.3.1.3. Indonesia

            14.3.1.4. Singapore

            14.3.1.5. Australia & New Zealand

            14.3.1.6. Rest of South Asia & Pacific

        14.3.2. By Deployment

        14.3.3. By Enterprise Size

        14.3.4. By Industry

    14.4. Market Attractiveness Analysis

        14.4.1. By Country

        14.4.2. By Deployment

        14.4.3. By Enterprise Size

        14.4.4. By Industry

15. East Asia Market Analysis 2018 to 2022 and Forecast 2023 to 2033

    15.1. Introduction

    15.2. Historical Market Size (US$ Million) and Trend Analysis By Market Taxonomy, 2018 to 2022

    15.3. Current and Future Market Size (US$ Million) and Forecast By Market Taxonomy, 2023 to 2033

        15.3.1. By Country

            15.3.1.1. China

            15.3.1.2. Japan

            15.3.1.3. South Korea

        15.3.2. By Deployment

        15.3.3. By Enterprise Size

        15.3.4. By Industry

    15.4. Market Attractiveness Analysis

        15.4.1. By Country

        15.4.2. By Deployment

        15.4.3. By Enterprise Size

        15.4.4. By Industry

16. Middle East and Africa Market Analysis 2018 to 2022 and Forecast 2023 to 2033

    16.1. Introduction

    16.2. Historical Market Size (US$ Million) and Trend Analysis By Market Taxonomy, 2018 to 2022

    16.3. Current and Future Market Size (US$ Million) and Forecast By Market Taxonomy, 2023 to 2033

        16.3.1. By Country

            16.3.1.1. GCC Countries

            16.3.1.2. Turkey

            16.3.1.3. Northern Africa

            16.3.1.4. South Africa

            16.3.1.5. Rest of Middle East and Africa

        16.3.2. By Deployment

        16.3.3. By Enterprise Size

        16.3.4. By Industry

    16.4. Market Attractiveness Analysis

        16.4.1. By Country

        16.4.2. By Deployment

        16.4.3. By Enterprise Size

        16.4.4. By Industry

17. Emerging Countries Market Analysis

    17.1. USA Market Analysis

        17.1.1. By Deployment

        17.1.2. By Enterprise Size

        17.1.3. By Industry

    17.2. Canada Market Analysis

        17.2.1. By Deployment

        17.2.2. By Enterprise Size

        17.2.3. By Industry

    17.3. Mexico Market Analysis

        17.3.1. By Deployment

        17.3.2. By Enterprise Size

        17.3.3. By Industry

    17.4. Brazil Market Analysis

        17.4.1. By Deployment

        17.4.2. By Enterprise Size

        17.4.3. By Industry

    17.5. Germany Market Analysis

        17.5.1. By Deployment

        17.5.2. By Enterprise Size

        17.5.3. By Industry

    17.6. Italy Market Analysis

        17.6.1. By Deployment

        17.6.2. By Enterprise Size

        17.6.3. By Industry

    17.7. France Market Analysis

        17.7.1. By Deployment

        17.7.2. By Enterprise Size

        17.7.3. By Industry

    17.8.United kingdom Market Analysis

        17.8.1. By Deployment

        17.8.2. By Enterprise Size

        17.8.3. By Industry

    17.9. Spain Market Analysis

        17.9.1. By Deployment

        17.9.2. By Enterprise Size

        17.9.3. By Industry

    17.10. BENELUX Market Analysis

        17.10.1. By Deployment

        17.10.2. By Enterprise Size

        17.10.3. By Industry

    17.11. Russia Market Analysis

        17.11.1. By Deployment

        17.11.2. By Enterprise Size

        17.11.3. By Industry

    17.12. China Market Analysis

        17.12.1. By Deployment

        17.12.2. By Enterprise Size

        17.12.3. By Industry

    17.13. Japan Market Analysis

        17.13.1. By Deployment

        17.13.2. By Enterprise Size

        17.13.3. By Industry

    17.14. South Korea Market Analysis

        17.14.1. By Deployment

        17.14.2. By Enterprise Size

        17.14.3. By Industry

    17.15. India Market Analysis

        17.15.1. By Deployment

        17.15.2. By Enterprise Size

        17.15.3. By Industry

    17.16. Malaysia Market Analysis

        17.16.1. By Deployment

        17.16.2. By Enterprise Size

        17.16.3. By Industry

    17.17. Indonesia Market Analysis

        17.17.1. By Deployment

        17.17.2. By Enterprise Size

        17.17.3. By Industry

    17.18. Singapore Market Analysis

        17.18.1. By Deployment

        17.18.2. By Enterprise Size

        17.18.3. By Industry

    17.19. Australia and New Zealand Market Analysis

        17.19.1. By Deployment

        17.19.2. By Enterprise Size

        17.19.3. By Industry

    17.20. GCC Countries Market Analysis

        17.20.1. By Deployment

        17.20.2. By Enterprise Size

        17.20.3. By Industry

    17.21. Turkey Market Analysis

        17.21.1. By Deployment

        17.21.2. By Enterprise Size

        17.21.3. By Industry

    17.22. Northern Africa Market Analysis

        17.22.1. By Deployment

        17.22.2. By Enterprise Size

        17.22.3. By Industry

    17.23. South Africa Market Analysis

        17.23.1. By Deployment

        17.23.2. By Enterprise Size

        17.23.3. By Industry

18. Market Structure Analysis

    18.1. Market Analysis by Tier of Companies

    18.2. Market Share Analysis of Top Players

19. Competition Analysis

    19.1. Competition Dashboard

    19.2. Competition Deep Dive

        19.2.1. Cisco

            19.2.1.1. Business Overview

            19.2.1.2. Solution Portfolio

            19.2.1.3. Profitability by Market Segments

            19.2.1.4. Key Strategy & Developments

        19.2.2. Comodo

            19.2.2.1. Business Overview

            19.2.2.2. Solution Portfolio

            19.2.2.3. Profitability by Market Segments

            19.2.2.4. Key Strategy & Developments

        19.2.3. DNSFilter

            19.2.3.1. Business Overview

            19.2.3.2. Solution Portfolio

            19.2.3.3. Profitability by Market Segments

            19.2.3.4. Key Strategy & Developments

        19.2.4. Webroot

            19.2.4.1. Business Overview

            19.2.4.2. Solution Portfolio

            19.2.4.3. Profitability by Market Segments

            19.2.4.4. Key Strategy & Developments

        19.2.5. Infoblox

            19.2.5.1. Business Overview

            19.2.5.2. Solution Portfolio

            19.2.5.3. Profitability by Market Segments

            19.2.5.4. Key Strategy & Developments

        19.2.6. TitanHQ

            19.2.6.1. Business Overview

            19.2.6.2. Solution Portfolio

            19.2.6.3. Profitability by Market Segments

            19.2.6.4. Key Strategy & Developments

        19.2.7. EfficientIP

            19.2.7.1. Business Overview

            19.2.7.2. Solution Portfolio

            19.2.7.3. Profitability by Market Segments

            19.2.7.4. Key Strategy & Developments

        19.2.8. Akamai

            19.2.8.1. Business Overview

            19.2.8.2. Solution Portfolio

            19.2.8.3. Profitability by Market Segments

            19.2.8.4. Key Strategy & Developments

        19.2.9. MXToolBox

            19.2.9.1. Business Overview

            19.2.9.2. Solution Portfolio

            19.2.9.3. Profitability by Market Segments

            19.2.9.4. Key Strategy & Developments

        19.2.10. F5 Networks

            19.2.10.1. Business Overview

            19.2.10.2. Solution Portfolio

            19.2.10.3. Profitability by Market Segments

            19.2.10.4. Key Strategy & Developments

        19.2.11. Bluecat

            19.2.11.1. Business Overview

            19.2.11.2. Solution Portfolio

            19.2.11.3. Profitability by Market Segments

            19.2.11.4. Key Strategy & Developments

        19.2.12. Neustar

            19.2.12.1. Business Overview

            19.2.12.2. Solution Portfolio

            19.2.12.3. Profitability by Market Segments

            19.2.12.4. Key Strategy & Developments

        19.2.13. CSIS Security Group

            19.2.13.1. Business Overview

            19.2.13.2. Solution Portfolio

            19.2.13.3. Profitability by Market Segments

            19.2.13.4. Key Strategy & Developments

20. Assumptions and Acronyms Used

21. Research Methodology

Don't pay for what you don't need

Customize your report by selecting specific countries or regions and save 30%!

List of Tables

Table 01: Global Market Value (US$ Million) Analysis (2018 to 2022) by Deployment

Table 02: Global Market Value (US$ Million) Forecast (2023 to 2033) by Deployment

Table 03: Global Market Value (US$ Million) Analysis (2018 to 2022) by Enterprise Size

Table 04: Global Market Value (US$ Million) Forecast (2023 to 2033) by Enterprise Size

Table 05: Global Market Value (US$ Million) Analysis (2018 to 2022) by Industry

Table 06: Global Market Value (US$ Million) Forecast (2023 to 2033) by Industry

Table 07: Global Market Value (US$ Million) Analysis (2018 to 2022) by Region

Table 08: Global Market Value (US$ Million) Forecast (2023 to 2033) by Region

Table 09: North America Market Value (US$ Million) Analysis (2018 to 2022) by Deployment

Table 10: North America Market Value (US$ Million) Forecast (2023 to 2033) by Deployment

Table 11: North America Market Value (US$ Million) Analysis (2018 to 2022) by Enterprise Size

Table 12: North America Market Value (US$ Million) Forecast (2023 to 2033) by Enterprise Size

Table 13: North America Market Value (US$ Million) Analysis (2018 to 2022) by Industry

Table 14: North America Market Value (US$ Million) Forecast (2023 to 2033) by Industry

Table 15: North America Market Value (US$ Million) Analysis (2018 to 2022) by Country

Table 16: North America Market Value (US$ Million) Forecast (2023 to 2033) by Country

Table 17: Latin America Market Value (US$ Million) Analysis (2018 to 2022) by Deployment

Table 18: Latin America Market Value (US$ Million) Forecast (2023 to 2033) by Deployment

Table 19: Latin America Market Value (US$ Million) Analysis (2018 to 2022) by Enterprise Size

Table 20: Latin America Market Value (US$ Million) Forecast (2023 to 2033) by Enterprise Size

Table 21: Latin America Market Value (US$ Million) Analysis (2018 to 2022) by Industry

Table 22: Latin America Market Value (US$ Million) Forecast (2023 to 2033) by Industry

Table 23: Latin America Market Value (US$ Million) Analysis (2018 to 2022) by Country

Table 24: Latin America Market Value (US$ Million) Forecast (2023 to 2033) by Country

Table 25: Europe Market Value (US$ Million) Analysis (2018 to 2022) by Deployment

Table 26: Europe Market Value (US$ Million) Forecast (2023 to 2033) by Deployment

Table 27: Europe Market Value (US$ Million) Analysis (2018 to 2022) by Enterprise Size

Table 28: Europe Market Value (US$ Million) Forecast (2023 to 2033) by Enterprise Size

Table 29: Europe Market Value (US$ Million) Analysis (2018 to 2022) by Industry

Table 30: Europe Market Value (US$ Million) Forecast (2023 to 2033) by Industry

Table 31: Europe Market Value (US$ Million) Analysis (2018 to 2022) by Country

Table 32: Europe Market Value (US$ Million) Forecast (2023 to 2033) by Country

Table 33: South Asia & Pacific Market Value (US$ Million) Analysis (2018 to 2022) by Deployment

Table 34: South Asia & Pacific Market Value (US$ Million) Forecast (2023 to 2033) by Deployment

Table 35: South Asia & Pacific Market Value (US$ Million) Analysis (2018 to 2022) by Enterprise Size

Table 36: South Asia & Pacific Market Value (US$ Million) Forecast (2023 to 2033) by Enterprise Size

Table 37: Europe Market Value (US$ Million) Analysis (2018 to 2022) by Industry

Table 38: Europe Market Value (US$ Million) Forecast (2023 to 2033) by Industry

Table 39: South Asia & Pacific Market Value (US$ Million) Analysis (2018 to 2022) by Country

Table 40: South Asia & Pacific Market Value (US$ Million) Forecast (2023 to 2033) by Country

Table 41: East Asia Market Value (US$ Million) Analysis (2018 to 2022) by Deployment

Table 42: East Asia Market Value (US$ Million) Forecast (2023 to 2033) by Deployment

Table 43: East Asia Market Value (US$ Million) Analysis (2018 to 2022) by Enterprise Size

Table 44: East Asia Market Value (US$ Million) Forecast (2023 to 2033) by Enterprise Size

Table 45: Europe Market Value (US$ Million) Analysis (2018 to 2022) by Industry

Table 46: Europe Market Value (US$ Million) Forecast (2023 to 2033) by Industry

Table 47: East Asia Market Value (US$ Million) Analysis (2018 to 2022) by Country

Table 48: East Asia Market Value (US$ Million) Forecast (2023 to 2033) by Country

Table 49: Middle East & Africa Market Value (US$ Million) Analysis (2018 to 2022) by Deployment

Table 50: Middle East & Africa Market Value (US$ Million) Forecast (2023 to 2033) by Deployment

Table 51: Middle East & Africa Market Value (US$ Million) Analysis (2018 to 2022) by Enterprise Size

Table 52: Middle East & Africa Market Value (US$ Million) Forecast (2023 to 2033) by Enterprise Size

Table 53: Europe Market Value (US$ Million) Analysis (2018 to 2022) by Industry

Table 54: Europe Market Value (US$ Million) Forecast (2023 to 2033) by Industry

Table 55: Middle East & Africa Market Value (US$ Million) Analysis (2018 to 2022) by Country

Table 56: Middle East & Africa Market Value (US$ Million) Forecast (2023 to 2033) by Country
Sudip Saha
Sudip Saha

Principal Consultant

Talk to Analyst

Find your sweet spots for generating winning opportunities in this market.

List of Charts

Figure 01: Global Market Value (US$ Million), 2018 to 2022

Figure 02: Global Market Value (US$ Million), 2023 to 2033

Figure 03: Global Market Size (US$ Million) and Y-o-Y Growth Rate from 2023 to 2033

Figure 04: Global Market Size and Y-o-Y Growth Rate from 2023 to 2033

Figure 05: Global Market Value Y-o-Y Growth Trend Analysis (2018 to 2033) by Deployment

Figure 06: Global Market Value Share Analysis (2023 to 2033) by Deployment

Figure 07: Global Market Attractiveness by Deployment

Figure 08: Global Market Value Y-o-Y Growth Trend Analysis (2018 to 2033) by Enterprise Size

Figure 09: Global Market Value Share Analysis (2023 to 2033) by Enterprise Size

Figure 10: Global Market Attractiveness by Enterprise Size

Figure 11: Global Market Value Y-o-Y Growth Trend Analysis (2018 to 2033) by Industry

Figure 12: Global Market Value Share Analysis (2023 to 2033) by Industry

Figure 13: Global Market Attractiveness by Industry

Figure 14: Global Market Value Y-o-Y Growth Trend Analysis (2018 to 2033) by Region

Figure 15: Global Market Value Share Analysis (2023 to 2033) by Region

Figure 16: Global Market Attractiveness by Region

Figure 17: North America Market Absolute $ Opportunity (US$ Million), 2018 to 2033

Figure 18: Latin America Market Absolute $ Opportunity (US$ Million), 2018 to 2033

Figure 19: Europe Market Absolute $ Opportunity (US$ Million), 2018 to 2033

Figure 20: East Asia Market Absolute $ Opportunity (US$ Million), 2018 to 2033

Figure 21: South Asia & Pacific Market Absolute $ Opportunity (US$ Million), 2018 to 2033

Figure 22: Middle East & Africa Market Absolute $ Opportunity (US$ Million), 2018 to 2033

Figure 23: North America Market Value (US$ Million), 2018 to 2022

Figure 24: North America Market Value (US$ Million), 2023 to 2033

Figure 25: North America Market Value Y-o-Y Growth Trend Analysis (2018 to 2033) by Deployment

Figure 26: North America Market Value Share Analysis (2023 to 2033) by Deployment

Figure 27: North America Market Attractiveness by Deployment

Figure 28: North America Market Value Y-o-Y Growth Trend Analysis (2018 to 2033) by Enterprise Size

Figure 29: North America Market Value Share Analysis (2023 to 2033) by Enterprise Size

Figure 30: North America Market Attractiveness by Enterprise Size

Figure 31: North America Market Value Y-o-Y Growth Trend Analysis (2018 to 2033) by Industry

Figure 32: North America Market Value Share Analysis (2023 to 2033) by Industry

Figure 33: North America Market Attractiveness by Industry

Figure 34: North America Market Value Y-o-Y Growth Trend Analysis (2018 to 2033) by Country

Figure 35: North America Market Value Share Analysis (2023 to 2033) by Country

Figure 36: North America Market Attractiveness by Country

Figure 37: USA Market Absolute $ Opportunity (US$ Million), 2018 to 2033

Figure 38: Canada Market Absolute $ Opportunity (US$ Million), 2018 to 2033

Figure 39: Latin America Market Value (US$ Million), 2018 to 2022

Figure 40: Latin America Market Value (US$ Million), 2023 to 2033

Figure 41: Latin America Market Value Y-o-Y Growth Trend Analysis (2018 to 2033) by Deployment

Figure 42: Latin America Market Value Share Analysis (2023 to 2033) by Deployment

Figure 43: Latin America Market Attractiveness by Deployment

Figure 44: Latin America Market Value Y-o-Y Growth Trend Analysis (2018 to 2033) by Enterprise Size

Figure 45: Latin America Market Value Share Analysis (2023 to 2033) by Enterprise Size

Figure 46: Latin America Market Attractiveness by Enterprise Size

Figure 47: Latin America Market Value Y-o-Y Growth Trend Analysis (2018 to 2033) by Industry

Figure 48: Latin America Market Value Share Analysis (2023 to 2033) by Industry

Figure 49: Latin America Market Attractiveness by Industry

Figure 50: Latin America Market Value Y-o-Y Growth Trend Analysis (2018 to 2033) by Country

Figure 51: Latin America Market Value Share Analysis (2023 to 2033) by Country

Figure 52: Latin America Market Attractiveness by Country

Figure 53: Brazil Market Absolute $ Opportunity (US$ Million), 2018 to 2033

Figure 54: Mexico Market Absolute $ Opportunity (US$ Million), 2018 to 2033

Figure 55: Rest of Latin America Market Absolute $ Opportunity (US$ Million), 2018 to 2033

Figure 56: Europe Market Value (US$ Million), 2018 to 2022

Figure 57: Europe Market Value (US$ Million), 2023 to 2033

Figure 58: Europe Market Value Y-o-Y Growth Trend Analysis (2018 to 2033) by Deployment

Figure 59: Europe Market Value Share Analysis (2023 to 2033) by Deployment

Figure 60: Europe Market Attractiveness by Deployment

Figure 61: Europe Market Value Y-o-Y Growth Trend Analysis (2018 to 2033) by Enterprise Size

Figure 62: Europe Market Value Share Analysis (2023 to 2033) by Enterprise Size

Figure 63: Europe Market Attractiveness by Enterprise Size

Figure 64: Europe Market Value Y-o-Y Growth Trend Analysis (2018 to 2033) by Industry

Figure 65: Europe Market Value Share Analysis (2023 to 2033) by Industry

Figure 66: Europe Market Attractiveness by Industry

Figure 67: Europe Market Value Y-o-Y Growth Trend Analysis (2018 to 2033) by Country

Figure 68: Europe Market Value Share Analysis (2023 to 2033) by Country

Figure 69: Europe Market Attractiveness by Country

Figure 70: Germany Market Absolute $ Opportunity (US$ Million), 2018 to 2033

Figure 71: Italy Market Absolute $ Opportunity (US$ Million), 2018 to 2033

Figure 72: France Market Absolute $ Opportunity (US$ Million), 2018 to 2033

Figure 73:United kingdom Market Absolute $ Opportunity (US$ Million), 2018 to 2033

Figure 74: Spain Market Absolute $ Opportunity (US$ Million), 2018 to 2033

Figure 75: BENELUX Market Absolute $ Opportunity (US$ Million), 2018 to 2033

Figure 76: Russia Market Absolute $ Opportunity (US$ Million), 2018 to 2033

Figure 77: Rest of Europe Market Absolute $ Opportunity (US$ Million), 2018 to 2033

Figure 78: East Asia Market Value (US$ Million), 2018 to 2022

Figure 79: East Asia Market Value (US$ Million), 2023 to 2033

Figure 80: East Asia Market Value Y-o-Y Growth Trend Analysis (2018 to 2033) by Deployment

Figure 81: East Asia Market Value Share Analysis (2023 to 2033) by Deployment

Figure 82: East Asia Market Attractiveness by Deployment

Figure 83: East Asia Market Value Y-o-Y Growth Trend Analysis (2018 to 2033) by Enterprise Size

Figure 84: East Asia Market Value Share Analysis (2023 to 2033) by Enterprise Size

Figure 85: East Asia Market Attractiveness by Enterprise Size

Figure 86: East Asia Market Value Y-o-Y Growth Trend Analysis (2018 to 2033) by Industry

Figure 87: East Asia Market Value Share Analysis (2023 to 2033) by Industry

Figure 88: East Asia Market Attractiveness by Industry

Figure 89: East Asia Market Value Y-o-Y Growth Trend Analysis (2018 to 2033) by Country

Figure 90: East Asia Market Value Share Analysis (2023 to 2033) by Country

Figure 91: East Asia Market Attractiveness by Country

Figure 92: China Market Absolute $ Opportunity (US$ Million), 2018 to 2033

Figure 93: Japan Market Absolute $ Opportunity (US$ Million), 2018 to 2033

Figure 94: South Korea Market Absolute $ Opportunity (US$ Million), 2018 to 2033

Figure 95: South Asia & Pacific Market Value (US$ Million), 2018 to 2022

Figure 96: South Asia & Pacific Market Value (US$ Million), 2023 to 2033

Figure 97: South Asia & Pacific Market Value Y-o-Y Growth Trend Analysis (2018 to 2033) by Deployment

Figure 98: South Asia & Pacific Market Value Share Analysis (2023 to 2033) by Deployment

Figure 99: South Asia & Pacific Market Attractiveness by Deployment

Figure 100: South Asia & Pacific Market Value Y-o-Y Growth Trend Analysis (2018 to 2033) by Enterprise Size

Figure 101: South Asia & Pacific Market Value Share Analysis (2023 to 2033) by Enterprise Size

Figure 102: South Asia & Pacific Market Attractiveness by Enterprise Size

Figure 103: South Asia & Pacific Market Value Y-o-Y Growth Trend Analysis (2018 to 2033) by Industry

Figure 104: South Asia & Pacific Market Value Share Analysis (2023 to 2033) by Industry

Figure 105: South Asia & Pacific Market Attractiveness by Industry

Figure 106: South Asia & Pacific Market Value Y-o-Y Growth Trend Analysis (2018 to 2033) by Country

Figure 107: South Asia & Pacific Market Value Share Analysis (2023 to 2033) by Country

Figure 108: South Asia & Pacific Market Attractiveness by Country

Figure 109: India Market Absolute $ Opportunity (US$ Million), 2018 to 2033

Figure 110: Malaysia Market Absolute $ Opportunity (US$ Million), 2018 to 2033

Figure 111: Indonesia Market Absolute $ Opportunity (US$ Million), 2018 to 2033

Figure 112: Singapore Market Absolute $ Opportunity (US$ Million), 2018 to 2033

Figure 113: Australia & New Zealand Market Absolute $ Opportunity (US$ Million), 2018 to 2033

Figure 114: Rest of South Asia & Pacific Market Absolute $ Opportunity (US$ Million), 2018 to 2033

Figure 115: Middle East & Africa Market Value (US$ Million), 2018 to 2022

Figure 116: Middle East & Africa Market Value (US$ Million), 2023 to 2033

Figure 117: Middle East & Africa Market Value Y-o-Y Growth Trend Analysis (2018 to 2033) by Deployment

Figure 118: Middle East & Africa Market Value Share Analysis (2023 to 2033) by Deployment

Figure 119: Middle East & Africa Market Attractiveness by Deployment

Figure 120: Middle East & Africa Market Value Y-o-Y Growth Trend Analysis (2018 to 2033) by Enterprise Size

Figure 121: Middle East & Africa Market Value Share Analysis (2023 to 2033) by Enterprise Size

Figure 122: Middle East & Africa Market Attractiveness by Enterprise Size

Figure 123: Middle East & Africa Market Value Y-o-Y Growth Trend Analysis (2018 to 2033) by Industry

Figure 124: Middle East & Africa Market Value Share Analysis (2023 to 2033) by Industry

Figure 125: Middle East & Africa Market Attractiveness by Industry

Figure 126: Middle East & Africa Market Value Y-o-Y Growth Trend Analysis (2018 to 2033) by Country

Figure 127: Middle East & Africa Market Value Share Analysis (2023 to 2033) by Country

Figure 128: Middle East & Africa Market Attractiveness by Country

Figure 129: GCC Countries Market Absolute $ Opportunity (US$ Million), 2018 to 2033

Figure 130: Turkey Market Absolute $ Opportunity (US$ Million), 2018 to 2033

Figure 131: Northern Africa Market Absolute $ Opportunity (US$ Million), 2018 to 2033

Figure 132: South Africa Market Absolute $ Opportunity (US$ Million), 2018 to 2033

Figure 133: Rest of Middle East & Africa Market Absolute $ Opportunity (US$ Million), 2018 to 2033

Recommendations

Technology

Network Encryption Market

Published : February 2023

Technology

SD-WAN Security Market

Published : February 2023

Technology

Next-Gen Firewall Market

Published : February 2023

Technology

Zero Trust Security Market

Published : October 2022

Explore Technology Insights

View Reports