

- Market Size (2026)
- USD 640.7 Mn
- Forecast (2036)
- USD 1104.8 Mn
- CAGR (2026 to 2036)
- 5.6%
How big is the Duct Pullers Market size?
USD 640.7 million in 2026 and USD 1,104.8 million by 2036 at a 5.6% CAGR.
Sales in duct pullers market are projected to grow at 5.6% CAGR during the forecast period, driving valuation to USD 1,104.8 million by 2036 from USD 640.7 million in 2026. Installing new power cables across long distances requires steady and a controlled force so crews do not snap the wires or delay construction. The necessity for reliable conduit tools continues to grow as modern buildings and expanding grids consume significantly more power. According to a 2025 International Energy Agency report, global electricity consumption rose 4.3% in 2024. This significant increase in energy usage drives heavier installation workloads, forcing field teams to rely on planned cable movement and safer pulling practices.
Purchasing teams in Japan and Germany emphasize documented load ratings and safe operation to navigate cramped building spaces and dense power grids. At the same time, contractor groups in India and China focus on readily available service stock and faster crew output to support booming telecom expansions. Equipment selection varies widely depending on local jobsite conditions and regional safety standards. International Telecommunication Union figures published in November 2024 recorded 5.5 billion people online during 2024. Extensive internet connectivity drives continuous network upgrades, making efficient cable routing and duct installation equipment essential worldwide.
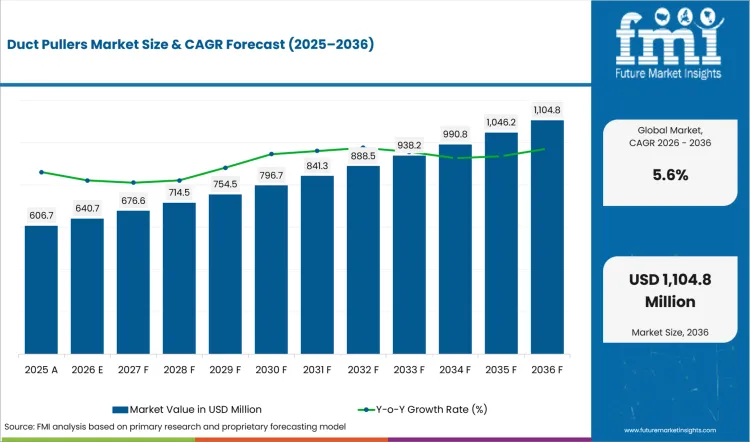
Key Takeaways of Duct Pullers Market
- Demand for duct pullers is driven by electrical and telecom crews' need for controlled pulling force with fewer cable damage events, with account decisions reflecting capstan control and local tool availability.
- By capacity, 1-3 Ton pullers are expected to lead with 39.0% share in 2026, driven by common power and telecom pulling needs.
- Tool distributors are the dominant sales channel segment, projected to hold 37.0% share in 2026, aided by contractor comparison needs and nearby inventory support.
- Electrical contractors are estimated to lead the end-use category with 36.0% share in 2026, led by repeated conduit work across buildings and infrastructure sites.
- Rental providers and tool channels remain important factors, supporting contractors who need capacity flexibility and accessory matching across changing jobsites.
- India, China, and Mexico are expected to form the higher-growth country tier, advancing at 7.4%, 6.7%, and 5.2% CAGR respectively through 2036, supported by transmission activity, telecom network scale, and utility contractor demand.
- Competition centers on Greenlee, Southwire, Current Tools, Maxis Tools, RIDGID, and Hubbell, with vendors differentiating through pulling capacity, rope systems, and field service reliability.
Analyst Perspective
"Contractors are selecting duct pullers based on their ability to deliver controlled cable installation while minimizing project delays and equipment-related risks. Reliable pulling performance, compatibility with varying conduit conditions, and ease of deployment are becoming important factors during equipment evaluation. Suppliers that provide practical application guidance, readily available accessories, and responsive local service are likely to strengthen customer loyalty across telecom and utility infrastructure projects."
- Nikhil Kaitwade, Principal Consultant for Industrial Automation at Future Market Insights
How is Duct Pullers Market segmented?
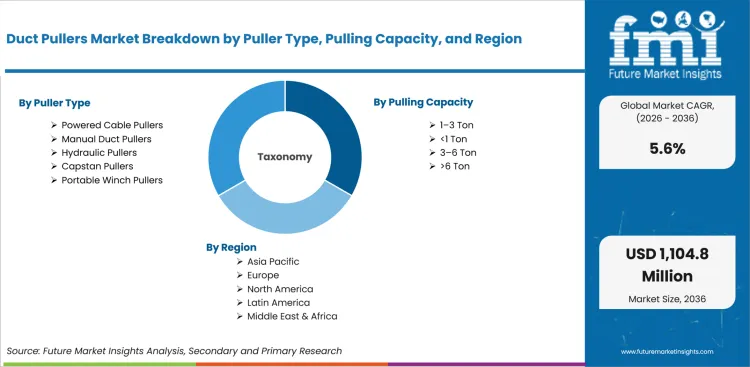
The duct pullers industry is segmented by puller type, pulling capacity, application, end use, sales channel and region.
The duct pullers market coverage includes six parent segments aligned with the stated report structure. Puller type coverage includes manual duct pullers alongside powered cable pullers, hydraulic pullers, capstan pullers and portable winch pullers. Pulling capacity coverage includes below 1 Ton, 1-3 Ton, 3-6 Ton and above 6 Ton. Application coverage includes power cable pulling, telecom and fiber duct pulling, utility duct installation and industrial cable routing. End-use coverage includes electrical contractors, telecom contractors, utilities and rail or infrastructure users. Sales channel coverage includes tool distributors, rental providers, direct OEM and online or catalog sales. Regional coverage includes North America and Latin America. Coverage also includes Western Europe, Eastern Europe, East Asia, South Asia and Pacific, Middle East and Africa.
How do powered cable pullers shape puller type purchasing?
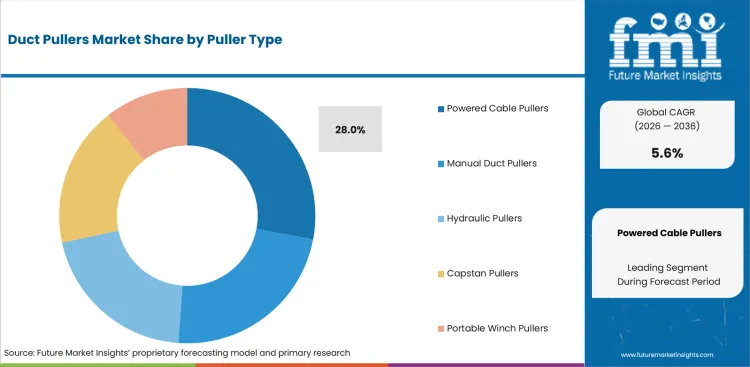
International Renewable Energy Agency reported on March 2026 stating renewable power capacity expanded by 692 GW in 2025, encouraging grid and interconnection work requiring dependable cable movement tools. Equipment choice often reflects motorized control and reduced manual effort during heavy or time-sensitive installations. Powered cable pullers are projected to shape puller type purchasing as crews need steady pulling pace across longer cable paths.
- Powered cable pullers are expected to hold 28.0% share in 2026, driven by controlled force delivery and lower crew strain across longer conduit hauls. Contractor teams assess powered units led by mounting stability and safe load handling before repeated use.
- Manual duct pullers and portable winch pullers address lighter jobs and specialized force profiles. Powered cable pullers keep purchasing attention as crews need repeatable performance and reduced start-stop movement during cable installation.
How does 1-3 Ton shape pulling capacity demand?
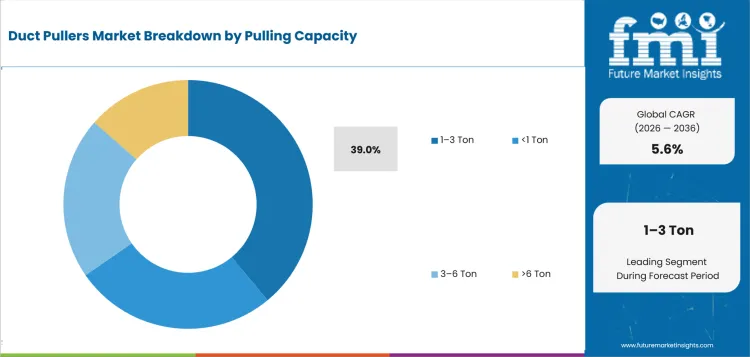
1-3 Ton pullers are estimated to lead pulling capacity demand as crews need equipment strong enough for repeated cable hauls without shifting into larger site setups. Work linked to wire and cable management keeps mid-capacity selection active across conduit-heavy projects. United States Energy Information Administration reported on February 2026 stating 53 GW of new capacity was added to the United States grid in 2025, highlighting installation workloads requiring force-rated pulling tools.
- Based on pulling capacity, 1-3 Ton is anticipated to represent 39.0% share in 2026 as many jobs require controlled force without heavy rigging. Contractor teams select this range as a practical bridge between manual pulling and larger equipment needs across repeated conduit work.
- Below 1 Ton and above 6 Ton ranges support lighter service tasks and heavier utility projects. 1-3 Ton remains central as crews seek capacity flexibility and dependable force control across routine jobsites.
Where does power cable pulling create repeat use?
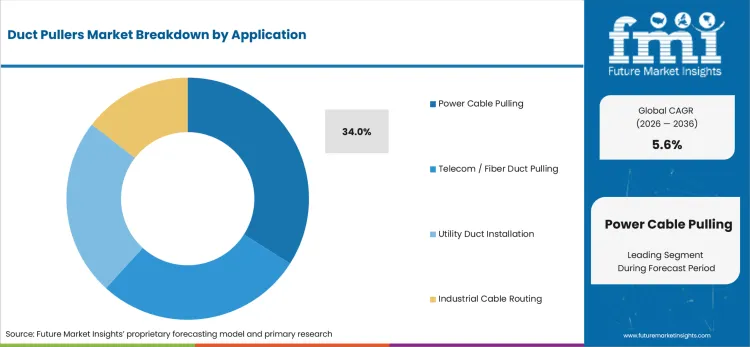
Power cable pulling is anticipated to create repeat use as electrical projects require safe handling and cable protection due to long conduit paths. Project teams compare duct pullers by grip compatibility and reel control before scheduling field work.Ember reported in April 2025 stating global electricity demand grew 4.0% in 2024, promoting long-term installation workloads tied to power infrastructure and cable routing.
- Power cable pulling is predicted to garner 34.0% share of application in 2026, helped by repeated building and industrial installation activity. Contractors approve pullers based on reviewing cable protection and crew productivity across power jobs.
- Telecom and fiber duct pulling and industrial cable routing support additional use across network and infrastructure projects. Power cable pulling maintains selection strength as conduit length and safety planning influence equipment use.
Why do electrical contractors lead end-use demand?
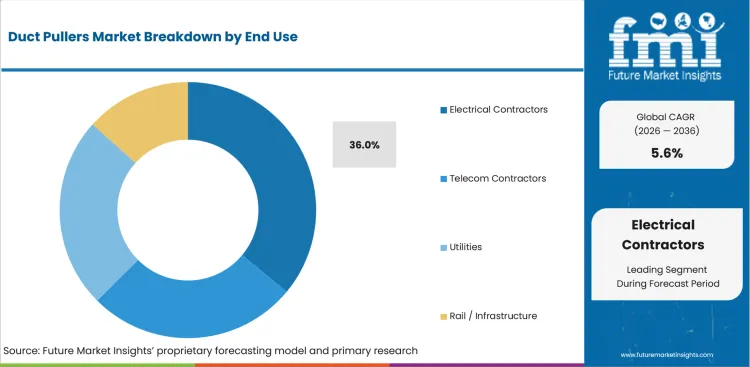
Electrical contractors are anticipated to lead end-use due to conduit-based cable movement appears across utility connections and infrastructure projects. Field supervisors review residential electrical conduit and crew count before starting each cable haul. United States Census Bureau reported in June 2026 stating privately owned housing units authorized in May 2026 reached a seasonally adjusted annual rate of 1,393,000, reflecting continued contractor attention to cable installation equipment across building projects.
- In 2026, electrical contractors are estimated to secure 36.0% share due to repeated cable movement driven by conduit systems and jobsite time control needs. Crews choose duct pullers to reduce manual strain and protect cable jackets during planned installation work.
- Telecom contractors and rail or infrastructure users create steady demand across fiber and corridor projects. Electrical contractors lead end-use selection as building and industrial work frequently requires repeatable pulling practices across several cable sizes.
How do tool distributors retain sales channel strength?
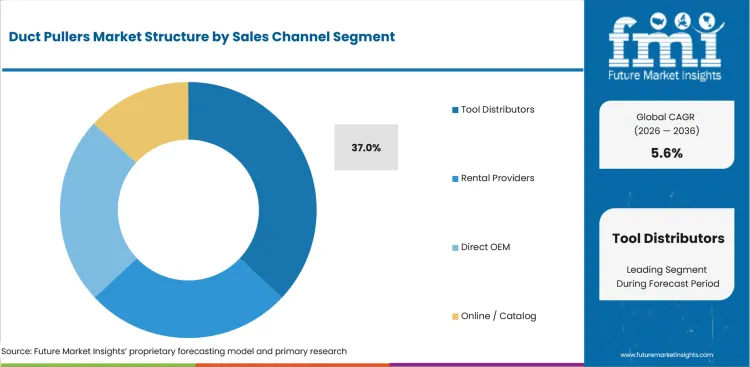
Tool distributors are expected to retain sales channel strength led by contractors often needing reel stands and accessories from one nearby purchasing path. Channel guidance assists crews comparing pulling capacity and replacement part availability before approving equipment. Rexel reported in March 2025 stating its network included more than 1,950 branches in 19 countries, influencing distributor-led comparison and local tool access for electrical contractors.
- By sales channel, tool distributors are projected to capture 37.0% share in 2026 since contractors need nearby access to pullers and jobsite accessories. Purchasing teams use distributor support to compare force rating and compatible installation tools before ordering.
- Rental providers and online or catalog sales dictate different purchase cycles across project and replacement activity. Tool distributors keep share strength depending on crews often needing inventory access and accessory matching during installation work.
What are drivers, restraints, and opportunities in Duct Pullers Market?
Duct puller selection advances through controlled pulling force and safer installation planning. Incorrect sizing and limited distributor guidance may slow approvals.
- Driver: Electrical and telecom crews are adopting controlled pulling equipment to reduce manual strain across longer conduit jobs.
- Restraint: Incorrect sizing and weak setup discipline may raise cable damage risk and increase jobsite rework.
- Opportunity: Rental providers and distributors may expand by matching puller capacity and reel handling with contractor job profiles.
Driver
Growth in the duct pullers market is expected to be supported by rising investment in power networks and connected infrastructure projects. Utilities are increasing spending on grid expansion and underground cable deployment, creating greater demand for efficient cable installation equipment. Duct pullers help reduce manual effort, improve installation speed, and lower the risk of cable damage during pulling operations. According to the International Renewable Energy Agency (IRENA), renewable power capacity expanded by 15.5% in 2025. This increase in renewable energy projects is strengthening grid connection activity and driving demand for planned cable pulling operations and safer cable handling practices across utility networks.
Restraint
Market growth is limited by jobsite setup errors, incorrect equipment selection, and growing safety compliance requirements. Cable installation projects often require precise tension control and proper tool matching to avoid cable damage and operational delays. Inadequate installation practices can result in higher project costs and greater safety risks for workers. The Occupational Safety and Health Administration (OSHA) reported 26,524 construction citations in fiscal year 2025, highlighting continued industry focus on workplace safety and proper equipment usage. Contractors must invest in training and compliance measures, while the cost of advanced pulling systems and maintenance requirements may create adoption challenges for smaller companies.
Opportunity
Manufacturers are creating opportunities through training initiatives, safety-focused product development, and improved installation guidance. Condux International's 2025 Cable Installation Tools and Equipment Catalog features extensive photographs, illustrations, application guidance, and safety information that help contractors select suitable pullers and accessories for specific installation conditions. Such resources support channel education and encourage best practices across cable installation projects. Manufacturers are developing duct pullers with digital tension monitoring and ergonomic designs that improve productivity and reduce operational risks. These product enhancements are expected to increase adoption across utility and commercial construction sectors.
What country CAGRs are profiled in Duct Pullers Market?
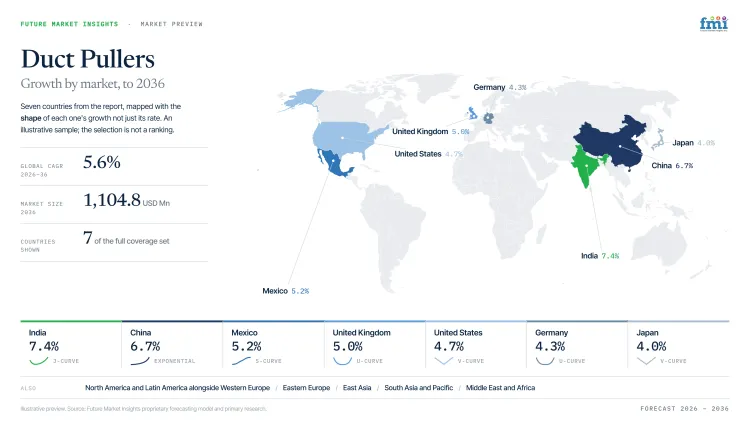
| Country | CAGR |
|---|---|
| India | 7.4% |
| China | 6.7% |
| Mexico | 5.2% |
| United Kingdom | 5.0% |
| United States | 4.7% |
| Germany | 4.3% |
| Japan | 4.0% |
Source: Future Market Insights analysis, 2026.
How do country-level CAGRs compare in Duct Pullers Market?
The country comparison spans 3.4 percentage points and reveals three clearly defined growth groups across the Duct Pullers Market. India and China form the upper growth tier with 0.7 percentage points separating the two markets. Mexico, the United Kingdom and the United States create a closely aligned middle group with only 0.5 percentage points separating the three markets. Germany and Japan form the lower tier with a 0.3-point difference. Markets with expanding power transmission, telecommunications and utility infrastructure generally demonstrate stronger demand for duct pulling equipment.
-
India leads the comparison as ongoing investments in power distribution networks, telecom expansion and urban infrastructure projects continue to increase demand for efficient cable installation equipment.
-
China remains 0.7 percentage points below India and reflects a market where large-scale utility construction, industrial development and fiber-optic network expansion continue to support adoption of duct pullers.
-
Mexico begins the middle group with a 1.5-point difference from China, highlighting growing investment in electrical infrastructure, industrial facilities and cross-border manufacturing projects.
-
The United Kingdom remains 0.2 percentage points below Mexico as modernization of utility networks and continued deployment of broadband infrastructure support steady demand for cable installation equipment.
-
The United States follows only 0.3 percentage points below the United Kingdom, reflecting ongoing replacement of aging utility infrastructure together with continued investment in renewable energy and telecommunications projects.
-
Germany remains 0.4 percentage points below the United States as industrial construction, energy network modernization and engineering-led infrastructure upgrades continue to support market expansion.
-
Japan records a CAGR 0.3 percentage points below Germany, reflecting a mature infrastructure market where demand is sustained by maintenance projects, utility upgrades and high-quality cable installation practices.
Comparable CAGRs can still produce different market entry conditions. Differences in utility investment, construction activity, telecommunications expansion and infrastructure modernization priorities influence equipment adoption and long-term market development. The full report provides country-level CAGR analysis across North America, Latin America, Europe, East Asia, South Asia, Oceania and the Middle East and Africa.
Country-wise Analysis
- Industry in India is anticipated to rise at 7.4% CAGR between 2026 and 2036, helped by transmission activity and contractor demand for repeatable pulling equipment. Higher grid work pushes contractors toward equipment able to keep pull force predictable during repeated utility pulls. Press Information Bureau reported in January 2026 stating 6,511 ckm of transmission lines at 220 kV and above were added during 2025, highlighting utility installation workloads using controlled pulling equipment.
- China’s duct pullers market is projected to expand at a 6.7% CAGR from 2026 to 2036, supported by telecom-network scale and power-installation workloads. The National Bureau of Statistics of China reported in February 2026 that mobile-phone base stations reached 12.87 million by the end of 2025. This installed base increases cable-routing and duct-installation requirements across network projects.
- Sector in Mexico is expected to expand at 5.2% CAGR during the study period, guided by transmission-line plans and utility contractor activity. Transmission and substation planning shifts field teams toward controlled pullers before cable placement begins. International Trade Administration reported in February 2026 stating for Mexico’s grid plan including 275 new transmission lines and 524 electrical substations, increasing contractor need for planned cable movement.
- Full-fiber activity and power-network upgrades are projected to support a 5.0% CAGR for the duct pullers market in the United Kingdom through 2036. Ofcom reported in May 2026 that full-fibre services were available to 24.9 million residential premises. This expansion increases duct work that requires steady pulling force and safe cable handling.
- Utility replacement projects and new generation capacity are projected to support a 4.7% CAGR for the United States duct pullers market during the assessment period. The United States Energy Information Administration reported in February 2026 that developers planned 86 GW of utility-scale capacity additions for 2026. These projects require cable routing across substations and related electrical works.
- Sales in Germany are anticipated to grow at 4.3% CAGR by 2036, guided by planned power-line work and contractor attention to load-rated installation tools. Approved line work gives contractors clearer project visibility before selecting pullers with documented load control. Bundesnetzagentur reported in January 2026 claiming about 2,000 km of power lines were approved in 2025, reinforcing cable installation planning and force-control equipment review.
- Japan’s duct pullers market is projected to expand at a 4.0% CAGR during the study period, supported by compact work areas and careful cable-routing requirements. Japan Statistics Bureau reported in September 2025 that new dwelling construction starts declined 3.4% to 0.79 million units during 2024. Contractors therefore require controlled pulling methods that reduce rework during conduit-based cable placement.
Who are notable companies in Duct Pullers Market?
Greenlee and Southwire are expected to shape market direction. Current Tools and Condux International add cable installation equipment depth. Katimex supports specialist cable-pulling coverage, while Southwire’s Maxis® range extends the company’s cable-puller portfolio.
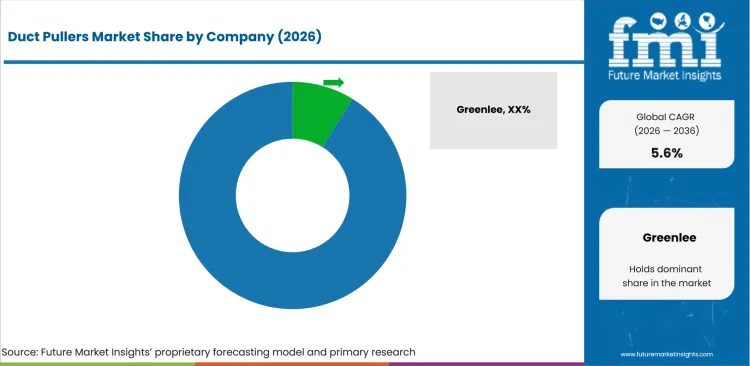
Competition in duct pullers is anticipated to center on rope compatibility and field support. Account teams are likely to compare companies based on product range and accessory guidance before final purchase. Greenlee and Southwire are expected to receive review attention due to powered puller depth. Current Tools is anticipated to add capacity-range strength. Condux International and GMP Tools are projected to compete led by telecom and cable installation knowledge. Katimex is estimated to support account demand driven by specialist pulling equipment. Milwaukee Tool and Hubbell are likely to strengthen channel access across contractor accounts.
- Greenlee and Southwire gain account attention through powered pulling systems and rope support. Electrical contractor relationships promote programs requiring repeat tool access and dependable accessories.
- Current Tools and Condux International compete on cable installation product depth. GMP Tools improves vendor review as telecom contractors assess installation equipment before field release.
- Katimex support demand through cable pulling specialization.
- Milwaukee Tool and Hubbell gain review strength through electrical trade access and complementary jobsite products. Vendor attention improves as contractors need tested pulling arrangements.
Competitive Benchmarking: Duct Pullers Market
| Company | Portfolio Depth | Capacity Match | Channel Support | Service Reach |
|---|---|---|---|---|
| Greenlee | High | High | High | Wide |
| Southwire | High | High | High | Wide |
| Current Tools | Medium | High | Medium | Regional |
| Condux International | High | High | Medium | Specialist |
| Katimex | Medium | Medium | Medium | Europe |
| GMP Tools | Medium | Medium | Medium | Telecom-focused |
| Milwaukee Tool | High | Medium | High | Wide |
| Hubbell | High | Medium | High | Wide |
Source: Future Market Insights competitive analysis, 2026.
Key Developments in Duct Pullers Market
- In January 2025, Greenlee announced the GX10 Tugger with 10,000 pounds of pulling force. Greenlee stated dual-speed operation improved large cable pulling productivity, influencing high-force powered puller evaluation among electrical contractors.
- In September 2025, Greenlee showcased pulling and bending innovations at NECA 2025. Greenlee stated its high-performance pulling rope delivered 40,000 pounds average breaking strength, improving rope-puller pairing for large cable installation work.
- In September 2025, Southwire listed NECA 2025 show promotions covering Maxis XD10, M3K-M, M6K-M, XD1 and QWIKrope. Southwire’s promotion supported contractor access to multiple cable pulling tools through trade-channel programs.
Key Players in Duct Pullers Market
Powered pulling and electrical tool brands
- Greenlee
- Southwire
- Milwaukee Tool
Cable installation equipment specialists
- Current Tools
- Condux International
- GMP Tools
Distribution-ready jobsite and electrical infrastructure brands
- Katimex
- Hubbell
Duct Pullers Market - Report Scope
| Coverage field | Report scope |
|---|---|
| Market breakdown | Duct Pullers Market breakdown by puller type alongside pulling capacity, application, end use, sales channel and region |
| Market Definition | Duct pullers include manual, powered, hydraulic, capstan and portable winch systems used to pull electrical, telecom, utility and industrial cables through ducts and conduits. |
| Regions Covered | North America and Latin America alongside Western Europe, Eastern Europe, East Asia, South Asia and Pacific, Middle East and Africa |
| Countries Covered | United States and India alongside China, Mexico, United Kingdom, Germany, Japan, Canada, Brazil, France, Italy, Spain, South Korea, ASEAN, Australia, New Zealand, GCC countries, South Africa and Türkiye |
| Key Companies Profiled | Greenlee and Southwire alongside Current Tools, Condux International, Katimex, GMP Tools, Milwaukee Tool and Hubbell |
| Forecast Period | 2026 to 2036 |
| Approach | Hybrid bottom-up and top-down methodology using segment share, country CAGR, contractor demand, channel coverage, cable installation workload, company portfolio depth and service exposure |
Source: Future Market Insights analysis, 2026.
Duct Pullers Market - Research Methodology
| Method | Approach |
|---|---|
| Primary Research | FMI analysts gathered input from manufacturers, service providers, technology developers, distributors, end users, procurement teams, and subject-matter experts. Interviews examined purchasing decisions, product or service evaluation, adoption barriers, approval requirements, pricing considerations, and expectations for technical or commercial support. Respondents were also asked what evidence is required before a trial, pilot, or initial order develops into regular purchasing. |
| Desk Research | Desk research covered government statistics, regulatory publications, trade data, industry associations, technical literature, standards, company filings, product information, and official corporate announcements. Sources were reviewed for relevance, publication date, geographic coverage, and consistency with the defined market scope. Claims relating to performance, applications, approvals, capacity, investment, and commercial activity were retained only when supported by credible public evidence. |
| Market Sizing and Forecasting | The market model combined the baseline value with historical performance, segment structure, pricing and volume indicators, adoption levels, company participation, and country-level demand conditions. Forecast assumptions considered economic activity, investment trends, regulatory developments, technology adoption, purchasing cycles, supply availability, and barriers to wider market use. Segment and regional estimates were reconciled before the final market total was calculated. |
| Data Validation | Estimates were checked against multiple independent indicators, including public data, company activity, trade patterns, industry developments, and findings from primary interviews. Validation also tested whether products, services, applications, and company revenues fell within the defined market boundaries. Adjacent categories, unsupported claims, overlapping revenues, and activities without direct market relevance were excluded to reduce double counting and maintain consistency across segments and countries. |
Duct Pullers Market by Segments
Duct Pullers Market segmented by Puller Type:
- Manual duct pullers
- Powered cable pullers
- Hydraulic pullers
- Capstan pullers
- Portable winch pullers
Duct Pullers Market segmented by Pulling Capacity:
- Below 1 Ton
- 1-3 Ton
- 3-6 Ton
- Above 6 Ton
Duct Pullers Market segmented by Application:
- Power cable pulling
- Telecom and fiber duct pulling
- Utility duct installation
- Industrial cable routing
Duct Pullers Market segmented by End Use:
- Electrical contractors
- Telecom contractors
- Utilities
- Rail and infrastructure
Duct Pullers Market segmented by Sales Channel:
- Tool distributors
- Rental providers
- Direct OEM
- Online and catalog
Duct Pullers Market by Region:
- North America
- United States
- Canada
- Latin America
- Brazil
- Mexico
- Argentina
- Western Europe
- Germany
- United Kingdom
- France
- Italy
- Spain
- Eastern Europe
- Russia
- Poland
- Czech Republic
- East Asia
- China
- Japan
- South Korea
- South Asia and Pacific
- India
- ASEAN
- Australia and New Zealand
- Middle East and Africa
- GCC countries
- South Africa
- Türkiye
Research Sources and Bibliography
- Bundesnetzagentur. (2026, January 2). Energy transition clears crucial hurdle: Significant progress in electricity grid expansion in 2025.
- Condux International. (2025, September). Cable installation tools and equipment catalog.
- Greenlee. (2025, January 21). New Greenlee GX10 Tugger.
- Greenlee. (2025, September 10). Greenlee showcases bending, pulling, and new innovations at the 2025 National Electrical Contractors Association Convention and Trade Show, September 12-15.
- International Energy Agency. (2025). Electricity 2025: Analysis and forecast to 2027.
- Ember. (2025, April 8). Global Electricity Review 2025.
- International Renewable Energy Agency. (2026, March 31). Renewable capacity highlights 2026.
- International Telecommunication Union. (2024, November 10). Facts and Figures 2024: Internet use.
- Japan Statistics Bureau. (2025, September). Statistical Handbook of Japan 2025.
- National Bureau of Statistics of China. (2026, February 28). Statistical communiqué of the People’s Republic of China on the 2025 national economic and social development.
- Occupational Safety and Health Administration. (2026, April 15). Frequently cited OSHA standards results: NAICS Code 23 Construction, fiscal year 2025.
- Ofcom. (2026, May 13). Connected Nations update: Spring 2026.
- Press Information Bureau. (2026, January 16). Year End Review of Ministry of Power - 2025.
- Southwire. (2025, September 12). 2025 NECA show promotions.
- United States Census Bureau. (2026, June 16). New residential construction, May 2026.
- United States Department of Commerce, International Trade Administration. (2026, February 12). Mexico - Power sector: Electricity infrastructure and smart grid.
- United States Energy Information Administration. (2026, February 20). New USA electric generating capacity expected to reach a record high in 2026.
This bibliography is provided for reader reference and is not exhaustive. The full report contains the complete reference list and detailed citations.
This Report Answers
- What segments shape demand across puller type, pulling capacity, application, end use and sales channel?
- How do electrical and telecom contractors evaluate duct pullers before replacing manual hauling routines?
- How do country CAGRs differ across profiled markets?
- What companies compete through powered puller depth and channel service support?
- How are forecasts validated using a hybrid bottom-up and top-down approach?
- What factors do account teams address before larger account expansion?
- How do force ratings and rope pairing affect equipment selection?
- What limits return on investment for teams adding duct pulling systems?
- How do capacity records and accessory guidance influence account approval?
- What vendor capabilities improve long-term account confidence?
Frequently Asked Questions
What supports demand in duct pullers market?
Demand is likely to be supported by electrical and telecom teams needing controlled pulling force during long conduit runs. Accounts are expected to favor companies combining puller evidence and service response.
Who are key players in duct pullers market?
Key companies are anticipated to include Greenlee and Southwire among others supporting competition. Competition is likely to be based on accessory pairing and regional channel support.
What restraint affects duct pullers market?
A major restraint is the field risk created by incorrect sizing and weak setup discipline across contractor teams. Accounts slow adoption if equipment lacks rating clarity or support needed for safe cable movement.
Why do executives track duct pullers market?
Executives are expected to track duct pullers as cable installation choices affect crew productivity and equipment replacement planning. Factors such as puller capacity and distributor support shape buyer reviews.
What business problem does duct pullers market address?
Duct pullers market addresses the operational gap created by heavy cable movement through long conduit paths needing planned force and dependable handling. Contractors need equipment supporting repeatable pulling and field-ready service evidence.
What do account teams evaluate before selecting vendors?
Account teams are likely to evaluate pulling force, rope compatibility and repeat-use reliability before vendor approval. Accessory availability and technical documentation are expected to guide final vendor review.
What limits return on investment for purchasing teams?
Return on investment weakens if equipment setup or crew acceptance is not proven before deployment. Rework and delayed installation reduce expected margin gains.
How do vendors build long-term account confidence?
Vendors build account confidence by providing consistent product quality and evidence specific to duct pullers. Installation records and responsive troubleshooting support are expected to influence repeat-order trust.
Preview the report firsthand - request a free sample
Get SampleGet the brochure for pricing and purchase details.
Get PDFTable of Content
- Key Takeaways
- Market Size and CAGR
- Top Growth Driver
- Fastest Growing Segment
- Leading Region
- Key Companies
- Emerging Opportunities
- Executive Summary
- Global Market Outlook
- Demand-side Trends
- Supply-side Trends
- Technology Roadmap Analysis
- Analysis and Recommendations
- Analyst Perspective (What is happening? Why now? What should investors know?)
- Key Questions Answered
- How large is the market?
- What is the CAGR?
- What are key trends?
- Which region dominates?
- Who are the leaders?
- Market Overview
- Market Coverage / Taxonomy
- Market Definition / Scope / Limitations
- Research Methodology
- Chapter Orientation
- Analytical Lens and Working Hypotheses
- Market Structure, Signals, and Trend Drivers
- Benchmarking and Cross-market Comparability
- Market Sizing, Forecasting, and Opportunity Mapping
- Research Design and Evidence Framework
- Desk Research Programme (Secondary Evidence)
- Expert Input and Fieldwork (Primary Evidence)
- Tooling, Models, and Reference Databases
- Data Engineering and Model Build
- Quality Assurance and Audit Trail
- Market Background
- Market Dynamics (Drivers, Restraints, Opportunity, Trends)
- Scenario Forecast (Optimistic, Likely, Conservative)
- Impact Analysis
- AI Impact
- Sustainability Impact
- Regulatory Impact
- Technology Impact
- Consumer / Buyer Analysis
- Purchase Drivers
- Adoption Barriers
- Buyer Journey
- Opportunity Map Analysis
- Product Life Cycle Analysis
- Supply Chain Analysis
- Investment Feasibility Matrix
- Value Chain Analysis
- PESTLE and Porter's Analysis
- Regulatory Landscape
- Regional Parent Market Outlook
- Production and Consumption Statistics
- Import and Export Statistics
- Global Market Analysis and Forecast, 2021 to 2036
- Historical Market Size Value (USD Million) & Volume (Unit) Analysis, 2021 to 2025
- Current and Future Market Size Value (USD Million) & Volume (Unit) Projections, 2026 to 2036
- Y-o-Y Growth Trend Analysis
- Absolute $ Opportunity Analysis
- Global Market Pricing Analysis, 2021 to 2036
- Global Market Analysis and Forecast, By Puller Type, 2021 to 2036
- Introduction / Key Findings
- Historical Market Size Value (USD Million) & Volume (Unit) Analysis By Puller Type, 2021 to 2025
- Current and Future Market Size Value (USD Million) & Volume (Unit) Analysis and Forecast By Puller Type, 2026 to 2036
- Powered Cable Pullers
- Manual Duct Pullers
- Hydraulic Pullers
- Capstan Pullers
- Portable Winch Pullers
- Powered Cable Pullers
- Y-o-Y Growth Trend Analysis By Puller Type, 2021 to 2025
- Absolute $ Opportunity Analysis By Puller Type, 2026 to 2036
- Global Market Analysis and Forecast, By Pulling Capacity, 2021 to 2036
- Introduction / Key Findings
- Historical Market Size Value (USD Million) & Volume (Unit) Analysis By Pulling Capacity, 2021 to 2025
- Current and Future Market Size Value (USD Million) & Volume (Unit) Analysis and Forecast By Pulling Capacity, 2026 to 2036
- 1-3 Ton
- <1 Ton
- 3-6 Ton
- >6 Ton
- 1-3 Ton
- Y-o-Y Growth Trend Analysis By Pulling Capacity, 2021 to 2025
- Absolute $ Opportunity Analysis By Pulling Capacity, 2026 to 2036
- Global Market Analysis and Forecast, By Application, 2021 to 2036
- Introduction / Key Findings
- Historical Market Size Value (USD Million) & Volume (Unit) Analysis By Application, 2021 to 2025
- Current and Future Market Size Value (USD Million) & Volume (Unit) Analysis and Forecast By Application, 2026 to 2036
- Power Cable Pulling
- Telecom / Fiber Duct Pulling
- Utility Duct Installation
- Industrial Cable Routing
- Power Cable Pulling
- Y-o-Y Growth Trend Analysis By Application, 2021 to 2025
- Absolute $ Opportunity Analysis By Application, 2026 to 2036
- Global Market Analysis and Forecast, By End Use, 2021 to 2036
- Introduction / Key Findings
- Historical Market Size Value (USD Million) & Volume (Unit) Analysis By End Use, 2021 to 2025
- Current and Future Market Size Value (USD Million) & Volume (Unit) Analysis and Forecast By End Use, 2026 to 2036
- Electrical Contractors
- Telecom Contractors
- Utilities
- Rail / Infrastructure
- Electrical Contractors
- Y-o-Y Growth Trend Analysis By End Use, 2021 to 2025
- Absolute $ Opportunity Analysis By End Use, 2026 to 2036
- Global Market Analysis and Forecast, By Sales Channel, 2021 to 2036
- Introduction / Key Findings
- Historical Market Size Value (USD Million) & Volume (Unit) Analysis By Sales Channel, 2021 to 2025
- Current and Future Market Size Value (USD Million) & Volume (Unit) Analysis and Forecast By Sales Channel, 2026 to 2036
- Tool Distributors
- Rental Providers
- Direct OEM
- Online / Catalog
- Tool Distributors
- Y-o-Y Growth Trend Analysis By Sales Channel, 2021 to 2025
- Absolute $ Opportunity Analysis By Sales Channel, 2026 to 2036
- Global Market Analysis and Forecast, By Region, 2021 to 2036
- Introduction
- Historical Market Size Value (USD Million) & Volume (Unit) Analysis By Region, 2021 to 2025
- Current Market Size Value (USD Million) & Volume (Unit) Analysis and Forecast By Region, 2026 to 2036
- North America
- Latin America
- Western Europe
- Eastern Europe
- East Asia
- South Asia and Pacific
- Middle East & Africa
- Market Attractiveness Analysis By Region
- North America Market Analysis and Forecast, By Country, 2021 to 2036
- Historical Market Size Value (USD Million) & Volume (Unit) Trend Analysis By Market Taxonomy, 2021 to 2025
- Market Size Value (USD Million) & Volume (Unit) Forecast By Market Taxonomy, 2026 to 2036
- By Country
- USA
- Canada
- By Puller Type
- By Pulling Capacity
- By Application
- By End Use
- By Sales Channel
- By Country
- Market Attractiveness Analysis
- By Country
- By Puller Type
- By Pulling Capacity
- By Application
- By End Use
- By Sales Channel
- Key Takeaways
- Latin America Market Analysis and Forecast, By Country
- Historical Market Size Value (USD Million) & Volume (Unit) Trend Analysis By Market Taxonomy, 2021 to 2025
- Market Size Value (USD Million) & Volume (Unit) Forecast By Market Taxonomy, 2026 to 2036
- By Country
- Brazil
- Mexico
- Chile
- Rest of Latin America
- By Puller Type
- By Pulling Capacity
- By Application
- By End Use
- By Sales Channel
- By Country
- Market Attractiveness Analysis
- By Country
- By Puller Type
- By Pulling Capacity
- By Application
- By End Use
- By Sales Channel
- Key Takeaways
- Western Europe Market Analysis and Forecast, By Country
- Historical Market Size Value (USD Million) & Volume (Unit) Trend Analysis By Market Taxonomy, 2021 to 2025
- Market Size Value (USD Million) & Volume (Unit) Forecast By Market Taxonomy, 2026 to 2036
- By Country
- Germany
- UK
- Italy
- Spain
- France
- Nordic
- BENELUX
- Rest of Western Europe
- By Puller Type
- By Pulling Capacity
- By Application
- By End Use
- By Sales Channel
- By Country
- Market Attractiveness Analysis
- By Country
- By Puller Type
- By Pulling Capacity
- By Application
- By End Use
- By Sales Channel
- Key Takeaways
- Eastern Europe Market Analysis and Forecast, By Country
- Historical Market Size Value (USD Million) & Volume (Unit) Trend Analysis By Market Taxonomy, 2021 to 2025
- Market Size Value (USD Million) & Volume (Unit) Forecast By Market Taxonomy, 2026 to 2036
- By Country
- Russia
- Poland
- Hungary
- Balkan & Baltic
- Rest of Eastern Europe
- By Puller Type
- By Pulling Capacity
- By Application
- By End Use
- By Sales Channel
- By Country
- Market Attractiveness Analysis
- By Country
- By Puller Type
- By Pulling Capacity
- By Application
- By End Use
- By Sales Channel
- Key Takeaways
- East Asia Market Analysis and Forecast, By Country
- Historical Market Size Value (USD Million) & Volume (Unit) Trend Analysis By Market Taxonomy, 2021 to 2025
- Market Size Value (USD Million) & Volume (Unit) Forecast By Market Taxonomy, 2026 to 2036
- By Country
- China
- Japan
- South Korea
- By Puller Type
- By Pulling Capacity
- By Application
- By End Use
- By Sales Channel
- By Country
- Market Attractiveness Analysis
- By Country
- By Puller Type
- By Pulling Capacity
- By Application
- By End Use
- By Sales Channel
- Key Takeaways
- South Asia and Pacific Market Analysis and Forecast, By Country
- Historical Market Size Value (USD Million) & Volume (Unit) Trend Analysis By Market Taxonomy, 2021 to 2025
- Market Size Value (USD Million) & Volume (Unit) Forecast By Market Taxonomy, 2026 to 2036
- By Country
- India
- ASEAN
- Australia & New Zealand
- Rest of South Asia and Pacific
- By Puller Type
- By Pulling Capacity
- By Application
- By End Use
- By Sales Channel
- By Country
- Market Attractiveness Analysis
- By Country
- By Puller Type
- By Pulling Capacity
- By Application
- By End Use
- By Sales Channel
- Key Takeaways
- Middle East & Africa Market Analysis and Forecast, By Country
- Historical Market Size Value (USD Million) & Volume (Unit) Trend Analysis By Market Taxonomy, 2021 to 2025
- Market Size Value (USD Million) & Volume (Unit) Forecast By Market Taxonomy, 2026 to 2036
- By Country
- Kingdom of Saudi Arabia
- Other GCC Countries
- Türkiye
- South Africa
- Other African Union
- Rest of Middle East & Africa
- By Puller Type
- By Pulling Capacity
- By Application
- By End Use
- By Sales Channel
- By Country
- Market Attractiveness Analysis
- By Country
- By Puller Type
- By Pulling Capacity
- By Application
- By End Use
- By Sales Channel
- Key Takeaways
- Key Countries Market Analysis
- USA
- Pricing Analysis
- Market Share Analysis, 2025
- By Puller Type
- By Pulling Capacity
- By Application
- By End Use
- By Sales Channel
- Canada
- Pricing Analysis
- Market Share Analysis, 2025
- By Puller Type
- By Pulling Capacity
- By Application
- By End Use
- By Sales Channel
- Mexico
- Pricing Analysis
- Market Share Analysis, 2025
- By Puller Type
- By Pulling Capacity
- By Application
- By End Use
- By Sales Channel
- Brazil
- Pricing Analysis
- Market Share Analysis, 2025
- By Puller Type
- By Pulling Capacity
- By Application
- By End Use
- By Sales Channel
- Chile
- Pricing Analysis
- Market Share Analysis, 2025
- By Puller Type
- By Pulling Capacity
- By Application
- By End Use
- By Sales Channel
- Germany
- Pricing Analysis
- Market Share Analysis, 2025
- By Puller Type
- By Pulling Capacity
- By Application
- By End Use
- By Sales Channel
- UK
- Pricing Analysis
- Market Share Analysis, 2025
- By Puller Type
- By Pulling Capacity
- By Application
- By End Use
- By Sales Channel
- Italy
- Pricing Analysis
- Market Share Analysis, 2025
- By Puller Type
- By Pulling Capacity
- By Application
- By End Use
- By Sales Channel
- Spain
- Pricing Analysis
- Market Share Analysis, 2025
- By Puller Type
- By Pulling Capacity
- By Application
- By End Use
- By Sales Channel
- France
- Pricing Analysis
- Market Share Analysis, 2025
- By Puller Type
- By Pulling Capacity
- By Application
- By End Use
- By Sales Channel
- India
- Pricing Analysis
- Market Share Analysis, 2025
- By Puller Type
- By Pulling Capacity
- By Application
- By End Use
- By Sales Channel
- ASEAN
- Pricing Analysis
- Market Share Analysis, 2025
- By Puller Type
- By Pulling Capacity
- By Application
- By End Use
- By Sales Channel
- Australia & New Zealand
- Pricing Analysis
- Market Share Analysis, 2025
- By Puller Type
- By Pulling Capacity
- By Application
- By End Use
- By Sales Channel
- China
- Pricing Analysis
- Market Share Analysis, 2025
- By Puller Type
- By Pulling Capacity
- By Application
- By End Use
- By Sales Channel
- Japan
- Pricing Analysis
- Market Share Analysis, 2025
- By Puller Type
- By Pulling Capacity
- By Application
- By End Use
- By Sales Channel
- South Korea
- Pricing Analysis
- Market Share Analysis, 2025
- By Puller Type
- By Pulling Capacity
- By Application
- By End Use
- By Sales Channel
- Russia
- Pricing Analysis
- Market Share Analysis, 2025
- By Puller Type
- By Pulling Capacity
- By Application
- By End Use
- By Sales Channel
- Poland
- Pricing Analysis
- Market Share Analysis, 2025
- By Puller Type
- By Pulling Capacity
- By Application
- By End Use
- By Sales Channel
- Hungary
- Pricing Analysis
- Market Share Analysis, 2025
- By Puller Type
- By Pulling Capacity
- By Application
- By End Use
- By Sales Channel
- Kingdom of Saudi Arabia
- Pricing Analysis
- Market Share Analysis, 2025
- By Puller Type
- By Pulling Capacity
- By Application
- By End Use
- By Sales Channel
- Türkiye
- Pricing Analysis
- Market Share Analysis, 2025
- By Puller Type
- By Pulling Capacity
- By Application
- By End Use
- By Sales Channel
- South Africa
- Pricing Analysis
- Market Share Analysis, 2025
- By Puller Type
- By Pulling Capacity
- By Application
- By End Use
- By Sales Channel
- USA
- Market Structure Analysis
- Competition Dashboard
- Competition Benchmarking
- Market Share Analysis of Top Players
- By Regional
- By Puller Type
- By Pulling Capacity
- By Application
- By End Use
- By Sales Channel
- Emerging Startups
- Innovation Benchmarking
- Competition Analysis
- Competition Deep Dive
- Greenlee
- Overview
- Product Portfolio
- Profitability by Market Segments
- Sales Footprint
- Strategy Overview
- Marketing Strategy
- Product Strategy
- Channel Strategy
- Southwire
- Current Tools
- Condux International
- Katimex
- GMP Tools
- Maxis Tools
- RIDGID
- Milwaukee Tool
- Hubbell
- Greenlee
- Case Studies
- Success Stories
- Recent Developments
- Competition Deep Dive
- Assumptions & Acronyms Used


