Dynamic Spinal Tethering Systems Market Overview (2022 to 2032)

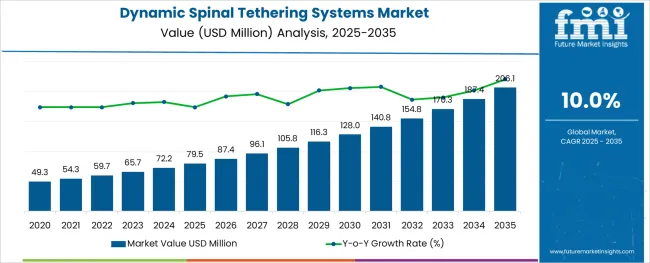
The dynamic spinal tethering system market is likely to record a CAGR of 10% during the forecast period, up from USD 59.7 Million in 2022 to reach a valuation of USD 154.85 Millionn by 2032.

Attributes Details
Dynamic Spinal Tethering System Market Size in 2022 USD 59.7 Million
Dynamic Spinal Tethering System Market Projected Size in 2032 USD 154.85 Million
Dynamic Spinal Tethering System Market Value-Based CAGR (2022 to 2032) 10%

Sales of dynamic spinal tethering systems are anticipated to rise due to increasing demand for minimally invasive procedures and an increase in the number of spinal abnormalities. In addition to this, demand for dynamic spinal tethering systems is rising as adult patients with severe or progressive diseases cannot be treated surgically are candidates for dynamic spinal tethering systems.

The increasing popularity of invasive operations and technology developments like robotic surgery, artificial intelligence (AI), machine learning, and augmented reality (AR) is also projected to rise the sales of dynamic spinal tethering system and contribute to the growth of the dynamic spinal tethering system market share.

Some of the key dynamic spinal tethering system market trends promoting the demand for dynamic spinal tethering systems include an increasing geriatric population around the world, coupled with the rising prevalence of diseases like cancer and arthritis over time.

This has resulted in increased sales of dynamic spinal tethering systems, medical tourism in emerging economies, where people prefer to seek treatment at low costs, which further drives demand for dynamic spinal tethering system.

What are the Growth Propellers to the Dynamic Spinal Tethering System Market Share?

The global dynamic spinal tethering system market is being driven by the advantages of dynamic spinal tethering devices in the treatment of spinal abnormalities, particularly scoliosis.

The rising prevalence of scoliosis is likely to fuel the sales of dynamic spinal tethering systems and market's expansion internationally. Increasing product availability of dynamic spinal tethering systems in developing areas is likely to propel the dynamic spinal tethering systems market forward even further.

The superiority of dynamic spinal tethering systems in the treatment of scoliosis and spine deformity over other options is projected to fuel the demand for dynamic spinal tethering systems and the growth of overall market share.

Furthermore, the sales of dynamic spinal tethering devices are predicted to grow due to rising awareness of scoliosis and other spine-related disorders, as well as treatment possibilities.

The global market for dynamic spinal tethering systems is growing due to continued innovation.

Most dynamic spinal tethering system companies work with a sense of urgency and consumer focus in the post-pandemic age to fulfill the rising demand for dynamic spinal tethering systems.

More than 8 million children and adolescents live with scoliosis, according to the American Association of Neurological Surgeons (AANS), which represents a major opportunity to boost the sales of dynamic spinal tethering system in the dynamic spinal tethering systems market

The demand for dynamic spinal tethering system is predicted to develop due to an increase in the number of individuals seeking treatment for scoliosis and other spine problems around the world.
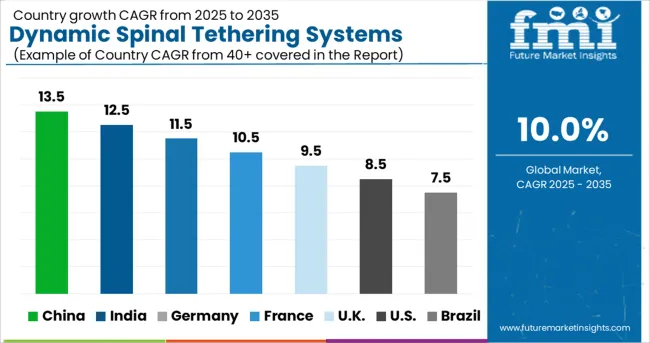
Which is the Leading Region in the Dynamic Spinal Tethering System Market?

Due to the increased frequency of scoliosis and other spine anomalies, North America is likely to dominate the global dynamic spinal tethering systems market. Furthermore, the demand for dynamic spinal tethering systems is anticipated to grow due to a greater prevalence of treatment-seeking; Europe is predicted to be the second most lucrative area in the global dynamic spinal tethering system market.

Sales of dynamic spinal tethering systems are increasing owing to the rising acceptance of dynamic spinal tethering systems for spine-related abnormalities; Latin America's dynamic spinal tethering system market share is predicted to rise steadily.

Furthermore, Due to rapidly rising product availability and usage, Asia-Pacific is considered an emerging region in the global dynamic spinal tethering systems market. Due to the low rate of treatment-seeking, the Middle East and Africa dynamic spinal tethering system market is predicted to be the least profitable.
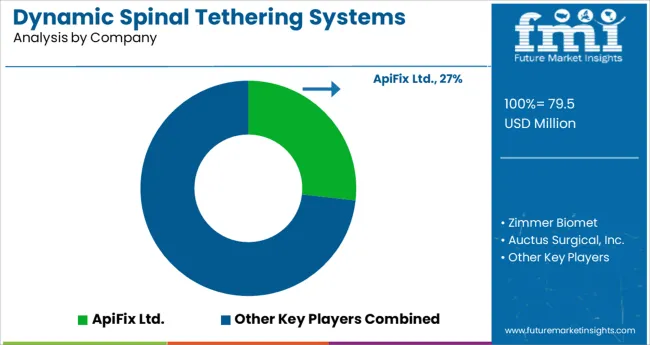
How is the Competitive Landscape in the Dynamic Spinal Tethering System Market?

The key players in the global dynamic spinal tethering systems marketare INTUITIVEX, Medtronic, Alphatec Spine, Inc., Arthrex, Camber Spine, DePuy Synthes, Exactech, Inc., Globus Medical Inc., and others.

Key players in the global dynamic spinal tethering systems market are continually updating their product portfolios. To dominate the market, they have used a variety of organic and inorganic techniques such as partnerships, enhanced product launches, collaborations, and acquisitions.

  • LCI medical was acquired by Safe Orthopaedics, a company focusing on the design and commercialization of ready-to-use solutions for spinal procedures, in 2020. The acquisition will allow the company to increase its product variety while also ensuring that its clients receive the safest products possible.
  • Xenco Medical will provide the first injection-molded titanium foam spinal implants that are pre-attached to disposable tools in June 2020.

Scope of Report

Report Attribute Details
Growth rate CAGR of 10% from 2022 to 2032
Base year for estimation 2021
Historical data 2015 to 2020
Forecast period 2022 to 2032
Quantitative units Revenue in USD million and CAGR from 2022 to 2032
Report coverage Revenue forecast, volume forecast, company ranking, competitive landscape, growth factors, and trends, Pricing Analysis,
Segments covered Application, end user, region
Regional scope North America; Western Europe; Eastern Europe; Middle East; Africa; ASEAN; South Asia; Rest of Asia; Australia and New Zealand
Country scope USA, Canada, Mexico, Germany, UK, France, Italy, Spain, Russia, Belgium, Poland; Czech Republic, China, India, Japan, Australia, Brazil, Argentina, Colombia, Saudi Arabia, UAE, Iran, South Africa
Key companies profiled INTUITIVEX; Medronic; Alphatec Spine; Inc.; Arthrex; Camber Spine; DePuy Synthes; Exactech; Inc.; Globus Medical Inc.
Customization scope Free report customization (equivalent to up to 8 analysts working days) with purchase. Addition or alteration to country, regional & segment scope.
Pricing and purchase options Avail customized purchase options to meet your exact research needs.

Table of Content

  • 1. Executive Summary
  • 2. Market Overview
  • 3. Market Background
  • 4. Global Dynamic Spinal Tethering Systems Market Analysis 2017 to 2021 and Forecast, 2022 to 2032
  • 5. Global Dynamic Spinal Tethering Systems Market Analysis 2017 to 2021 and Forecast 2022 to 2032, By Product
    • 5.1. Vertebral Body Tethering Systems
    • 5.2. Anterior Scoliosis Correction Systems
    • 5.3. Magnetically Adjustable Implant Systems
    • 5.4. Growing Rod Systems
  • 6. Global Dynamic Spinal Tethering Systems Market Analysis 2017 to 2021 and Forecast 2022 to 2032, By Age Group
    • 6.1. Adult
    • 6.2. Pediatric
    • 6.3. Geriatric
  • 7. Global Dynamic Spinal Tethering Systems Market Analysis 2017 to 2021 and Forecast 2022 to 2032, By Application
    • 7.1. Scoliosis
    • 7.2. Other Spine Deformities
  • 8. Global Dynamic Spinal Tethering Systems Market Analysis 2017 to 2021 and Forecast 2022 to 2032, By End User
    • 8.1. Hospitals
    • 8.2. Ambulatory Surgical Centers
    • 8.3. Specialty Clinics
  • 9. Global Dynamic Spinal Tethering Systems Market Analysis 2017 to 2021 and Forecast 2022 to 2032, By Region
    • 9.1. North America
    • 9.2. Latin America
    • 9.3. Europe
    • 9.4. East Asia
    • 9.5. South Asia & Pacific
    • 9.6. MEA
  • 10. North America Dynamic Spinal Tethering Systems Market Analysis 2017 to 2021 and Forecast 2022 to 2032, By Country
  • 11. Latin America Dynamic Spinal Tethering Systems Market Analysis 2017 to 2021 and Forecast 2022 to 2032, By Country
  • 12. Europe Dynamic Spinal Tethering Systems Market Analysis 2017 to 2021 and Forecast 2022 to 2032, By Country
  • 13. East Asia Dynamic Spinal Tethering Systems Market Analysis 2017 to 2021 and Forecast 2022 to 2032, By Country
  • 14. South Asia & Pacific Dynamic Spinal Tethering Systems Market Analysis 2017 to 2021 and Forecast 2022 to 2032, By Country
  • 15. MEA Dynamic Spinal Tethering Systems Market Analysis 2017 to 2021 and Forecast 2022 to 2032, By Country
  • 16. Key Countries Dynamic Spinal Tethering Systems Market Analysis
  • 17. Market Structure Analysis
  • 18. Competition Analysis
    • 18.1. ApiFix Ltd.
    • 18.2. Zimmer Biomet
    • 18.3. Auctus Surgical, Inc.
    • 18.4. NuVasive, Inc.
    • 18.5. Medtronic Inc.
    • 18.6. Globus Medical Inc.
    • 18.7. IntuitiveX
    • 18.8. Alphatec Holdings, Inc.
    • 18.9. Stryker
  • 19. Assumptions & Acronyms Used
  • 20. Research Methodology

List of Tables

Table 1: Global Dynamic Spinal Tethering Systems Market Value (US$ Mn) Forecast by Region, 2017-2032

Table 2: Global Dynamic Spinal Tethering Systems Market Value (US$ Mn) Forecast by Product, 2017-2032

Table 3: Global Dynamic Spinal Tethering Systems Market Value (US$ Mn) Forecast by Age Group, 2017-2032

Table 4: Global Dynamic Spinal Tethering Systems Market Value (US$ Mn) Forecast by Application, 2017-2032

Table 5: Global Dynamic Spinal Tethering Systems Market Value (US$ Mn) Forecast by End User, 2017-2032

Table 6: North America Dynamic Spinal Tethering Systems Market Value (US$ Mn) Forecast by Country, 2017-2032

Table 7: North America Dynamic Spinal Tethering Systems Market Value (US$ Mn) Forecast by Product, 2017-2032

Table 8: North America Dynamic Spinal Tethering Systems Market Value (US$ Mn) Forecast by Age Group, 2017-2032

Table 9: North America Dynamic Spinal Tethering Systems Market Value (US$ Mn) Forecast by Application, 2017-2032

Table 10: North America Dynamic Spinal Tethering Systems Market Value (US$ Mn) Forecast by End User, 2017-2032

Table 11: Latin America Dynamic Spinal Tethering Systems Market Value (US$ Mn) Forecast by Country, 2017-2032

Table 12: Latin America Dynamic Spinal Tethering Systems Market Value (US$ Mn) Forecast by Product, 2017-2032

Table 13: Latin America Dynamic Spinal Tethering Systems Market Value (US$ Mn) Forecast by Age Group, 2017-2032

Table 14: Latin America Dynamic Spinal Tethering Systems Market Value (US$ Mn) Forecast by Application, 2017-2032

Table 15: Latin America Dynamic Spinal Tethering Systems Market Value (US$ Mn) Forecast by End User, 2017-2032

Table 16: Europe Dynamic Spinal Tethering Systems Market Value (US$ Mn) Forecast by Country, 2017-2032

Table 17: Europe Dynamic Spinal Tethering Systems Market Value (US$ Mn) Forecast by Product, 2017-2032

Table 18: Europe Dynamic Spinal Tethering Systems Market Value (US$ Mn) Forecast by Age Group, 2017-2032

Table 19: Europe Dynamic Spinal Tethering Systems Market Value (US$ Mn) Forecast by Application, 2017-2032

Table 20: Europe Dynamic Spinal Tethering Systems Market Value (US$ Mn) Forecast by End User, 2017-2032

Table 21: East Asia Dynamic Spinal Tethering Systems Market Value (US$ Mn) Forecast by Country, 2017-2032

Table 22: East Asia Dynamic Spinal Tethering Systems Market Value (US$ Mn) Forecast by Product, 2017-2032

Table 23: East Asia Dynamic Spinal Tethering Systems Market Value (US$ Mn) Forecast by Age Group, 2017-2032

Table 24: East Asia Dynamic Spinal Tethering Systems Market Value (US$ Mn) Forecast by Application, 2017-2032

Table 25: East Asia Dynamic Spinal Tethering Systems Market Value (US$ Mn) Forecast by End User, 2017-2032

Table 26: South Asia & Pacific Dynamic Spinal Tethering Systems Market Value (US$ Mn) Forecast by Country, 2017-2032

Table 27: South Asia & Pacific Dynamic Spinal Tethering Systems Market Value (US$ Mn) Forecast by Product, 2017-2032

Table 28: South Asia & Pacific Dynamic Spinal Tethering Systems Market Value (US$ Mn) Forecast by Age Group, 2017-2032

Table 29: South Asia & Pacific Dynamic Spinal Tethering Systems Market Value (US$ Mn) Forecast by Application, 2017-2032

Table 30: South Asia & Pacific Dynamic Spinal Tethering Systems Market Value (US$ Mn) Forecast by End User, 2017-2032

Table 31: MEA Dynamic Spinal Tethering Systems Market Value (US$ Mn) Forecast by Country, 2017-2032

Table 32: MEA Dynamic Spinal Tethering Systems Market Value (US$ Mn) Forecast by Product, 2017-2032

Table 33: MEA Dynamic Spinal Tethering Systems Market Value (US$ Mn) Forecast by Age Group, 2017-2032

Table 34: MEA Dynamic Spinal Tethering Systems Market Value (US$ Mn) Forecast by Application, 2017-2032

Table 35: MEA Dynamic Spinal Tethering Systems Market Value (US$ Mn) Forecast by End User, 2017-2032

List of Figures

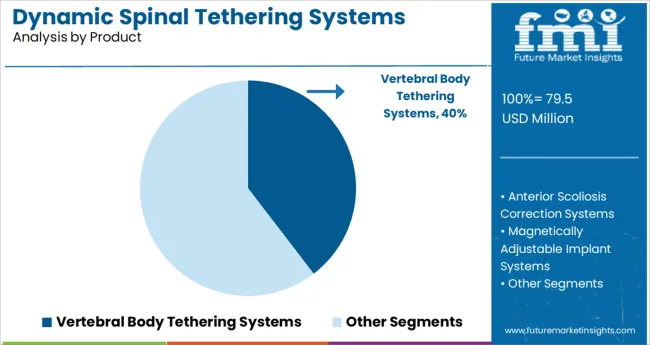
Figure 1: Global Dynamic Spinal Tethering Systems Market Value (US$ Mn) by Product, 2022-2032

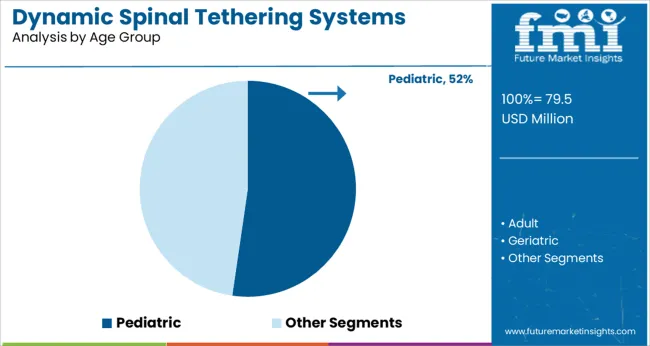
Figure 2: Global Dynamic Spinal Tethering Systems Market Value (US$ Mn) by Age Group, 2022-2032

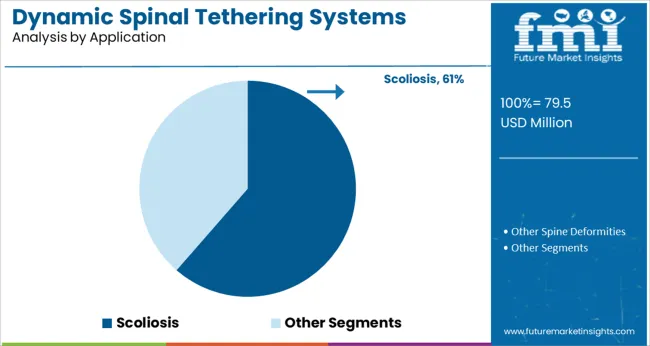
Figure 3: Global Dynamic Spinal Tethering Systems Market Value (US$ Mn) by Application, 2022-2032

Figure 4: Global Dynamic Spinal Tethering Systems Market Value (US$ Mn) by End User, 2022-2032

Figure 5: Global Dynamic Spinal Tethering Systems Market Value (US$ Mn) by Region, 2022-2032

Figure 6: Global Dynamic Spinal Tethering Systems Market Value (US$ Mn) Analysis by Region, 2017-2032

Figure 7: Global Dynamic Spinal Tethering Systems Market Value Share (%) and BPS Analysis by Region, 2022-2032

Figure 8: Global Dynamic Spinal Tethering Systems Market Y-o-Y Growth (%) Projections by Region, 2022-2032

Figure 9: Global Dynamic Spinal Tethering Systems Market Value (US$ Mn) Analysis by Product, 2017-2032

Figure 10: Global Dynamic Spinal Tethering Systems Market Value Share (%) and BPS Analysis by Product, 2022-2032

Figure 11: Global Dynamic Spinal Tethering Systems Market Y-o-Y Growth (%) Projections by Product, 2022-2032

Figure 12: Global Dynamic Spinal Tethering Systems Market Value (US$ Mn) Analysis by Age Group, 2017-2032

Figure 13: Global Dynamic Spinal Tethering Systems Market Value Share (%) and BPS Analysis by Age Group, 2022-2032

Figure 14: Global Dynamic Spinal Tethering Systems Market Y-o-Y Growth (%) Projections by Age Group, 2022-2032

Figure 15: Global Dynamic Spinal Tethering Systems Market Value (US$ Mn) Analysis by Application, 2017-2032

Figure 16: Global Dynamic Spinal Tethering Systems Market Value Share (%) and BPS Analysis by Application, 2022-2032

Figure 17: Global Dynamic Spinal Tethering Systems Market Y-o-Y Growth (%) Projections by Application, 2022-2032

Figure 18: Global Dynamic Spinal Tethering Systems Market Value (US$ Mn) Analysis by End User, 2017-2032

Figure 19: Global Dynamic Spinal Tethering Systems Market Value Share (%) and BPS Analysis by End User, 2022-2032

Figure 20: Global Dynamic Spinal Tethering Systems Market Y-o-Y Growth (%) Projections by End User, 2022-2032

Figure 21: Global Dynamic Spinal Tethering Systems Market Attractiveness by Product, 2022-2032

Figure 22: Global Dynamic Spinal Tethering Systems Market Attractiveness by Age Group, 2022-2032

Figure 23: Global Dynamic Spinal Tethering Systems Market Attractiveness by Application, 2022-2032

Figure 24: Global Dynamic Spinal Tethering Systems Market Attractiveness by End User, 2022-2032

Figure 25: Global Dynamic Spinal Tethering Systems Market Attractiveness by Region, 2022-2032

Figure 26: North America Dynamic Spinal Tethering Systems Market Value (US$ Mn) by Product, 2022-2032

Figure 27: North America Dynamic Spinal Tethering Systems Market Value (US$ Mn) by Age Group, 2022-2032

Figure 28: North America Dynamic Spinal Tethering Systems Market Value (US$ Mn) by Application, 2022-2032

Figure 29: North America Dynamic Spinal Tethering Systems Market Value (US$ Mn) by End User, 2022-2032

Figure 30: North America Dynamic Spinal Tethering Systems Market Value (US$ Mn) by Country, 2022-2032

Figure 31: North America Dynamic Spinal Tethering Systems Market Value (US$ Mn) Analysis by Country, 2017-2032

Figure 32: North America Dynamic Spinal Tethering Systems Market Value Share (%) and BPS Analysis by Country, 2022-2032

Figure 33: North America Dynamic Spinal Tethering Systems Market Y-o-Y Growth (%) Projections by Country, 2022-2032

Figure 34: North America Dynamic Spinal Tethering Systems Market Value (US$ Mn) Analysis by Product, 2017-2032

Figure 35: North America Dynamic Spinal Tethering Systems Market Value Share (%) and BPS Analysis by Product, 2022-2032

Figure 36: North America Dynamic Spinal Tethering Systems Market Y-o-Y Growth (%) Projections by Product, 2022-2032

Figure 37: North America Dynamic Spinal Tethering Systems Market Value (US$ Mn) Analysis by Age Group, 2017-2032

Figure 38: North America Dynamic Spinal Tethering Systems Market Value Share (%) and BPS Analysis by Age Group, 2022-2032

Figure 39: North America Dynamic Spinal Tethering Systems Market Y-o-Y Growth (%) Projections by Age Group, 2022-2032

Figure 40: North America Dynamic Spinal Tethering Systems Market Value (US$ Mn) Analysis by Application, 2017-2032

Figure 41: North America Dynamic Spinal Tethering Systems Market Value Share (%) and BPS Analysis by Application, 2022-2032

Figure 42: North America Dynamic Spinal Tethering Systems Market Y-o-Y Growth (%) Projections by Application, 2022-2032

Figure 43: North America Dynamic Spinal Tethering Systems Market Value (US$ Mn) Analysis by End User, 2017-2032

Figure 44: North America Dynamic Spinal Tethering Systems Market Value Share (%) and BPS Analysis by End User, 2022-2032

Figure 45: North America Dynamic Spinal Tethering Systems Market Y-o-Y Growth (%) Projections by End User, 2022-2032

Figure 46: North America Dynamic Spinal Tethering Systems Market Attractiveness by Product, 2022-2032

Figure 47: North America Dynamic Spinal Tethering Systems Market Attractiveness by Age Group, 2022-2032

Figure 48: North America Dynamic Spinal Tethering Systems Market Attractiveness by Application, 2022-2032

Figure 49: North America Dynamic Spinal Tethering Systems Market Attractiveness by End User, 2022-2032

Figure 50: North America Dynamic Spinal Tethering Systems Market Attractiveness by Country, 2022-2032

Figure 51: Latin America Dynamic Spinal Tethering Systems Market Value (US$ Mn) by Product, 2022-2032

Figure 52: Latin America Dynamic Spinal Tethering Systems Market Value (US$ Mn) by Age Group, 2022-2032

Figure 53: Latin America Dynamic Spinal Tethering Systems Market Value (US$ Mn) by Application, 2022-2032

Figure 54: Latin America Dynamic Spinal Tethering Systems Market Value (US$ Mn) by End User, 2022-2032

Figure 55: Latin America Dynamic Spinal Tethering Systems Market Value (US$ Mn) by Country, 2022-2032

Figure 56: Latin America Dynamic Spinal Tethering Systems Market Value (US$ Mn) Analysis by Country, 2017-2032

Figure 57: Latin America Dynamic Spinal Tethering Systems Market Value Share (%) and BPS Analysis by Country, 2022-2032

Figure 58: Latin America Dynamic Spinal Tethering Systems Market Y-o-Y Growth (%) Projections by Country, 2022-2032

Figure 59: Latin America Dynamic Spinal Tethering Systems Market Value (US$ Mn) Analysis by Product, 2017-2032

Figure 60: Latin America Dynamic Spinal Tethering Systems Market Value Share (%) and BPS Analysis by Product, 2022-2032

Figure 61: Latin America Dynamic Spinal Tethering Systems Market Y-o-Y Growth (%) Projections by Product, 2022-2032

Figure 62: Latin America Dynamic Spinal Tethering Systems Market Value (US$ Mn) Analysis by Age Group, 2017-2032

Figure 63: Latin America Dynamic Spinal Tethering Systems Market Value Share (%) and BPS Analysis by Age Group, 2022-2032

Figure 64: Latin America Dynamic Spinal Tethering Systems Market Y-o-Y Growth (%) Projections by Age Group, 2022-2032

Figure 65: Latin America Dynamic Spinal Tethering Systems Market Value (US$ Mn) Analysis by Application, 2017-2032

Figure 66: Latin America Dynamic Spinal Tethering Systems Market Value Share (%) and BPS Analysis by Application, 2022-2032

Figure 67: Latin America Dynamic Spinal Tethering Systems Market Y-o-Y Growth (%) Projections by Application, 2022-2032

Figure 68: Latin America Dynamic Spinal Tethering Systems Market Value (US$ Mn) Analysis by End User, 2017-2032

Figure 69: Latin America Dynamic Spinal Tethering Systems Market Value Share (%) and BPS Analysis by End User, 2022-2032

Figure 70: Latin America Dynamic Spinal Tethering Systems Market Y-o-Y Growth (%) Projections by End User, 2022-2032

Figure 71: Latin America Dynamic Spinal Tethering Systems Market Attractiveness by Product, 2022-2032

Figure 72: Latin America Dynamic Spinal Tethering Systems Market Attractiveness by Age Group, 2022-2032

Figure 73: Latin America Dynamic Spinal Tethering Systems Market Attractiveness by Application, 2022-2032

Figure 74: Latin America Dynamic Spinal Tethering Systems Market Attractiveness by End User, 2022-2032

Figure 75: Latin America Dynamic Spinal Tethering Systems Market Attractiveness by Country, 2022-2032

Figure 76: Europe Dynamic Spinal Tethering Systems Market Value (US$ Mn) by Product, 2022-2032

Figure 77: Europe Dynamic Spinal Tethering Systems Market Value (US$ Mn) by Age Group, 2022-2032

Figure 78: Europe Dynamic Spinal Tethering Systems Market Value (US$ Mn) by Application, 2022-2032

Figure 79: Europe Dynamic Spinal Tethering Systems Market Value (US$ Mn) by End User, 2022-2032

Figure 80: Europe Dynamic Spinal Tethering Systems Market Value (US$ Mn) by Country, 2022-2032

Figure 81: Europe Dynamic Spinal Tethering Systems Market Value (US$ Mn) Analysis by Country, 2017-2032

Figure 82: Europe Dynamic Spinal Tethering Systems Market Value Share (%) and BPS Analysis by Country, 2022-2032

Figure 83: Europe Dynamic Spinal Tethering Systems Market Y-o-Y Growth (%) Projections by Country, 2022-2032

Figure 84: Europe Dynamic Spinal Tethering Systems Market Value (US$ Mn) Analysis by Product, 2017-2032

Figure 85: Europe Dynamic Spinal Tethering Systems Market Value Share (%) and BPS Analysis by Product, 2022-2032

Figure 86: Europe Dynamic Spinal Tethering Systems Market Y-o-Y Growth (%) Projections by Product, 2022-2032

Figure 87: Europe Dynamic Spinal Tethering Systems Market Value (US$ Mn) Analysis by Age Group, 2017-2032

Figure 88: Europe Dynamic Spinal Tethering Systems Market Value Share (%) and BPS Analysis by Age Group, 2022-2032

Figure 89: Europe Dynamic Spinal Tethering Systems Market Y-o-Y Growth (%) Projections by Age Group, 2022-2032

Figure 90: Europe Dynamic Spinal Tethering Systems Market Value (US$ Mn) Analysis by Application, 2017-2032

Figure 91: Europe Dynamic Spinal Tethering Systems Market Value Share (%) and BPS Analysis by Application, 2022-2032

Figure 92: Europe Dynamic Spinal Tethering Systems Market Y-o-Y Growth (%) Projections by Application, 2022-2032

Figure 93: Europe Dynamic Spinal Tethering Systems Market Value (US$ Mn) Analysis by End User, 2017-2032

Figure 94: Europe Dynamic Spinal Tethering Systems Market Value Share (%) and BPS Analysis by End User, 2022-2032

Figure 95: Europe Dynamic Spinal Tethering Systems Market Y-o-Y Growth (%) Projections by End User, 2022-2032

Figure 96: Europe Dynamic Spinal Tethering Systems Market Attractiveness by Product, 2022-2032

Figure 97: Europe Dynamic Spinal Tethering Systems Market Attractiveness by Age Group, 2022-2032

Figure 98: Europe Dynamic Spinal Tethering Systems Market Attractiveness by Application, 2022-2032

Figure 99: Europe Dynamic Spinal Tethering Systems Market Attractiveness by End User, 2022-2032

Figure 100: Europe Dynamic Spinal Tethering Systems Market Attractiveness by Country, 2022-2032

Figure 101: East Asia Dynamic Spinal Tethering Systems Market Value (US$ Mn) by Product, 2022-2032

Figure 102: East Asia Dynamic Spinal Tethering Systems Market Value (US$ Mn) by Age Group, 2022-2032

Figure 103: East Asia Dynamic Spinal Tethering Systems Market Value (US$ Mn) by Application, 2022-2032

Figure 104: East Asia Dynamic Spinal Tethering Systems Market Value (US$ Mn) by End User, 2022-2032

Figure 105: East Asia Dynamic Spinal Tethering Systems Market Value (US$ Mn) by Country, 2022-2032

Figure 106: East Asia Dynamic Spinal Tethering Systems Market Value (US$ Mn) Analysis by Country, 2017-2032

Figure 107: East Asia Dynamic Spinal Tethering Systems Market Value Share (%) and BPS Analysis by Country, 2022-2032

Figure 108: East Asia Dynamic Spinal Tethering Systems Market Y-o-Y Growth (%) Projections by Country, 2022-2032

Figure 109: East Asia Dynamic Spinal Tethering Systems Market Value (US$ Mn) Analysis by Product, 2017-2032

Figure 110: East Asia Dynamic Spinal Tethering Systems Market Value Share (%) and BPS Analysis by Product, 2022-2032

Figure 111: East Asia Dynamic Spinal Tethering Systems Market Y-o-Y Growth (%) Projections by Product, 2022-2032

Figure 112: East Asia Dynamic Spinal Tethering Systems Market Value (US$ Mn) Analysis by Age Group, 2017-2032

Figure 113: East Asia Dynamic Spinal Tethering Systems Market Value Share (%) and BPS Analysis by Age Group, 2022-2032

Figure 114: East Asia Dynamic Spinal Tethering Systems Market Y-o-Y Growth (%) Projections by Age Group, 2022-2032

Figure 115: East Asia Dynamic Spinal Tethering Systems Market Value (US$ Mn) Analysis by Application, 2017-2032

Figure 116: East Asia Dynamic Spinal Tethering Systems Market Value Share (%) and BPS Analysis by Application, 2022-2032

Figure 117: East Asia Dynamic Spinal Tethering Systems Market Y-o-Y Growth (%) Projections by Application, 2022-2032

Figure 118: East Asia Dynamic Spinal Tethering Systems Market Value (US$ Mn) Analysis by End User, 2017-2032

Figure 119: East Asia Dynamic Spinal Tethering Systems Market Value Share (%) and BPS Analysis by End User, 2022-2032

Figure 120: East Asia Dynamic Spinal Tethering Systems Market Y-o-Y Growth (%) Projections by End User, 2022-2032

Figure 121: East Asia Dynamic Spinal Tethering Systems Market Attractiveness by Product, 2022-2032

Figure 122: East Asia Dynamic Spinal Tethering Systems Market Attractiveness by Age Group, 2022-2032

Figure 123: East Asia Dynamic Spinal Tethering Systems Market Attractiveness by Application, 2022-2032

Figure 124: East Asia Dynamic Spinal Tethering Systems Market Attractiveness by End User, 2022-2032

Figure 125: East Asia Dynamic Spinal Tethering Systems Market Attractiveness by Country, 2022-2032

Figure 126: South Asia & Pacific Dynamic Spinal Tethering Systems Market Value (US$ Mn) by Product, 2022-2032

Figure 127: South Asia & Pacific Dynamic Spinal Tethering Systems Market Value (US$ Mn) by Age Group, 2022-2032

Figure 128: South Asia & Pacific Dynamic Spinal Tethering Systems Market Value (US$ Mn) by Application, 2022-2032

Figure 129: South Asia & Pacific Dynamic Spinal Tethering Systems Market Value (US$ Mn) by End User, 2022-2032

Figure 130: South Asia & Pacific Dynamic Spinal Tethering Systems Market Value (US$ Mn) by Country, 2022-2032

Figure 131: South Asia & Pacific Dynamic Spinal Tethering Systems Market Value (US$ Mn) Analysis by Country, 2017-2032

Figure 132: South Asia & Pacific Dynamic Spinal Tethering Systems Market Value Share (%) and BPS Analysis by Country, 2022-2032

Figure 133: South Asia & Pacific Dynamic Spinal Tethering Systems Market Y-o-Y Growth (%) Projections by Country, 2022-2032

Figure 134: South Asia & Pacific Dynamic Spinal Tethering Systems Market Value (US$ Mn) Analysis by Product, 2017-2032

Figure 135: South Asia & Pacific Dynamic Spinal Tethering Systems Market Value Share (%) and BPS Analysis by Product, 2022-2032

Figure 136: South Asia & Pacific Dynamic Spinal Tethering Systems Market Y-o-Y Growth (%) Projections by Product, 2022-2032

Figure 137: South Asia & Pacific Dynamic Spinal Tethering Systems Market Value (US$ Mn) Analysis by Age Group, 2017-2032

Figure 138: South Asia & Pacific Dynamic Spinal Tethering Systems Market Value Share (%) and BPS Analysis by Age Group, 2022-2032

Figure 139: South Asia & Pacific Dynamic Spinal Tethering Systems Market Y-o-Y Growth (%) Projections by Age Group, 2022-2032

Figure 140: South Asia & Pacific Dynamic Spinal Tethering Systems Market Value (US$ Mn) Analysis by Application, 2017-2032

Figure 141: South Asia & Pacific Dynamic Spinal Tethering Systems Market Value Share (%) and BPS Analysis by Application, 2022-2032

Figure 142: South Asia & Pacific Dynamic Spinal Tethering Systems Market Y-o-Y Growth (%) Projections by Application, 2022-2032

Figure 143: South Asia & Pacific Dynamic Spinal Tethering Systems Market Value (US$ Mn) Analysis by End User, 2017-2032

Figure 144: South Asia & Pacific Dynamic Spinal Tethering Systems Market Value Share (%) and BPS Analysis by End User, 2022-2032

Figure 145: South Asia & Pacific Dynamic Spinal Tethering Systems Market Y-o-Y Growth (%) Projections by End User, 2022-2032

Figure 146: South Asia & Pacific Dynamic Spinal Tethering Systems Market Attractiveness by Product, 2022-2032

Figure 147: South Asia & Pacific Dynamic Spinal Tethering Systems Market Attractiveness by Age Group, 2022-2032

Figure 148: South Asia & Pacific Dynamic Spinal Tethering Systems Market Attractiveness by Application, 2022-2032

Figure 149: South Asia & Pacific Dynamic Spinal Tethering Systems Market Attractiveness by End User, 2022-2032

Figure 150: South Asia & Pacific Dynamic Spinal Tethering Systems Market Attractiveness by Country, 2022-2032

Figure 151: MEA Dynamic Spinal Tethering Systems Market Value (US$ Mn) by Product, 2022-2032

Figure 152: MEA Dynamic Spinal Tethering Systems Market Value (US$ Mn) by Age Group, 2022-2032

Figure 153: MEA Dynamic Spinal Tethering Systems Market Value (US$ Mn) by Application, 2022-2032

Figure 154: MEA Dynamic Spinal Tethering Systems Market Value (US$ Mn) by End User, 2022-2032

Figure 155: MEA Dynamic Spinal Tethering Systems Market Value (US$ Mn) by Country, 2022-2032

Figure 156: MEA Dynamic Spinal Tethering Systems Market Value (US$ Mn) Analysis by Country, 2017-2032

Figure 157: MEA Dynamic Spinal Tethering Systems Market Value Share (%) and BPS Analysis by Country, 2022-2032

Figure 158: MEA Dynamic Spinal Tethering Systems Market Y-o-Y Growth (%) Projections by Country, 2022-2032

Figure 159: MEA Dynamic Spinal Tethering Systems Market Value (US$ Mn) Analysis by Product, 2017-2032

Figure 160: MEA Dynamic Spinal Tethering Systems Market Value Share (%) and BPS Analysis by Product, 2022-2032

Figure 161: MEA Dynamic Spinal Tethering Systems Market Y-o-Y Growth (%) Projections by Product, 2022-2032

Figure 162: MEA Dynamic Spinal Tethering Systems Market Value (US$ Mn) Analysis by Age Group, 2017-2032

Figure 163: MEA Dynamic Spinal Tethering Systems Market Value Share (%) and BPS Analysis by Age Group, 2022-2032

Figure 164: MEA Dynamic Spinal Tethering Systems Market Y-o-Y Growth (%) Projections by Age Group, 2022-2032

Figure 165: MEA Dynamic Spinal Tethering Systems Market Value (US$ Mn) Analysis by Application, 2017-2032

Figure 166: MEA Dynamic Spinal Tethering Systems Market Value Share (%) and BPS Analysis by Application, 2022-2032

Figure 167: MEA Dynamic Spinal Tethering Systems Market Y-o-Y Growth (%) Projections by Application, 2022-2032

Figure 168: MEA Dynamic Spinal Tethering Systems Market Value (US$ Mn) Analysis by End User, 2017-2032

Figure 169: MEA Dynamic Spinal Tethering Systems Market Value Share (%) and BPS Analysis by End User, 2022-2032

Figure 170: MEA Dynamic Spinal Tethering Systems Market Y-o-Y Growth (%) Projections by End User, 2022-2032

Figure 171: MEA Dynamic Spinal Tethering Systems Market Attractiveness by Product, 2022-2032

Figure 172: MEA Dynamic Spinal Tethering Systems Market Attractiveness by Age Group, 2022-2032

Figure 173: MEA Dynamic Spinal Tethering Systems Market Attractiveness by Application, 2022-2032

Figure 174: MEA Dynamic Spinal Tethering Systems Market Attractiveness by End User, 2022-2032

Figure 175: MEA Dynamic Spinal Tethering Systems Market Attractiveness by Country, 2022-2032

Frequently Asked Questions

What is the Growth Outlook for the Dynamic Spinal Tethering System Market?

The dynamic spinal tethering system market is likely to register a CAGR of 10% during the forecast period.

Who are the Key Players in the Dynamic Spinal Tethering System Market?

Key players holding substantial Dynamic Spinal Tethering System Market share include INTUITIVEX, Medronic, Alphatec Spine, Inc., Arthrex, Camber Spine, DePuy Synthes, Exactech, Inc., and Globus Medical Inc.

What is the Future of the Dynamic Spinal Tethering System Market?

As per the analysis, the Dynamic Spinal Tethering System Market share is likely to be USD 154.85 Billion by 2032.

Which is the Key Driver in the Dynamic Spinal Tethering System Market?

Demand for dynamic spinal tethering system is likely to rise due to the advantages of dynamic spinal tethering devices in the treatment of spinal abnormalities, particularly scoliosis.

Explore Similar Insights

Future Market Insights

Dynamic Spinal Tethering Systems Market