

- Market Size (2026)
- USD 630.4 Mn
- Forecast (2036)
- USD 1336.0 Mn
- CAGR (2026 to 2036)
- 7.8%
How big is East-to-West Oncology Asset Licensing Market in 2026?
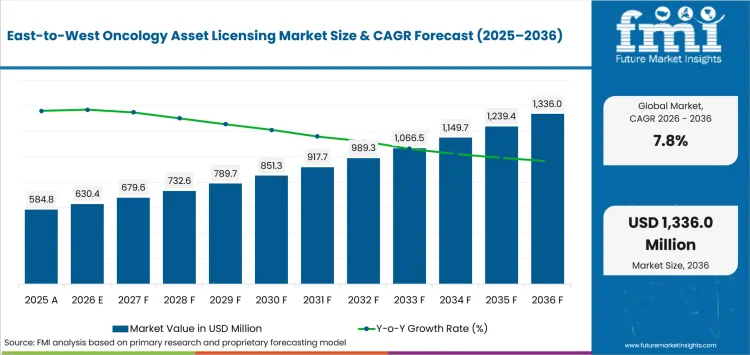
USD 630.4 million in 2026 and USD 1,336.0 million by 2036 at a 7.8% CAGR.
Sales of east-to-west oncology asset licensing are projected to expand at 7.8% CAGR from 2026 to 2036. Market value is estimated at USD 630.4 million in 2026 and USD 1,336.0 million by 2036. Pfizer completed its global ex-China licensing agreement with 3SBio for SSGJ-707 in July 2025. The agreement gave Pfizer rights to develop, manufacture and commercialize an investigational PD-1/VEGF bispecific antibody outside China. Deals of this type turn eastern oncology science into western trial planning and filing ownership.
The market is expected to gain value when a partner receives clean clinical records and clear territory rights. Licensing teams examine manufacturing transfer before paying later milestones. Small molecule assets help diligence move faster when formulation and toxicology records are easy to review. Preclinical programs still carry higher risk but give western companies earlier access to novel tumor biology before valuation rises.
Key Takeaways of East-to-West Oncology Asset Licensing Market
- Demand is driven by western partners reducing discovery risk through external innovation, with Asian originators gaining deal value when clinical data and manufacturing files are ready for global review.
- Out-licensing leads deal type at 40.1% share in 2026, reflecting clear territory transfer and defined operating responsibility across partnered development programs.
- Small molecule oncology drugs lead asset type at 37.8% share in 2026, supported by familiar chemistry files that accelerate diligence and term-sheet decisions.
- Preclinical assets account for 31.5% share in 2026, reflecting early-access interest in novel mechanisms before clinical proof raises entry price.
- Solid tumors hold 36.0% share in 2026, driven by broad deal activity across lung, breast, gastric, and colorectal cancer programs.
- Japan, South Korea, and Germany record CAGRs of 8.4%, 7.7%, and 7.4% through 2036, with Pfizer, AstraZeneca, and BioNTech competing for Asian-origin assets widening western oncology pipelines.
Analyst Perspective
"Commercial success will depend on the ability to advance licensed oncology assets through well-defined clinical and regulatory milestones. Partners are evaluating clinical evidence, manufacturing readiness, and commercialization potential as separate investment criteria. Companies that strengthen data quality, streamline technology transfer, and establish clear partnership structures will be better positioned to expand global development opportunities."
- Anurag Sharma, Principal Analyst at Future Market Insights
Source: FMI's proprietary forecasting model and primary research
How is the East-to-West Oncology Asset Licensing Market segmented?
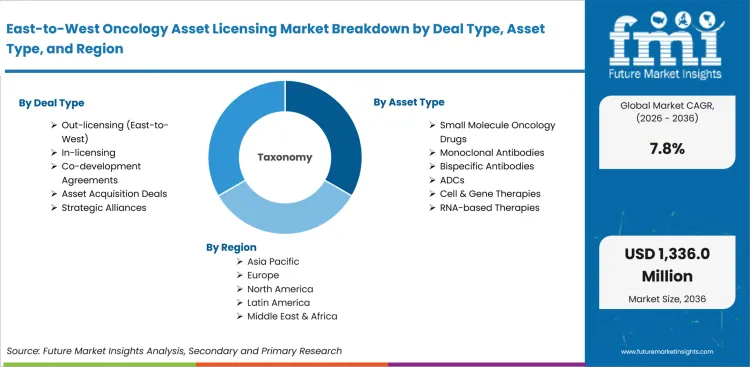
The east-to-west oncology asset licensing industry is segmented by deal type, asset type, development stage, therapeutic area, and region.
The segmentation framework separates how rights move from the type of oncology asset being transferred. Deal Type tracks the contract route because out-licensing and co-development place different duties on each company. Asset Type shows whether diligence centers on small molecules or more complex biologic formats. Development Stage separates early science from later clinical data because risk changes after first-in-human evidence. Therapeutic Area shows where tumor biology and trial pathways are strongest. Regional analysis compares countries by company base and review pathway.
How does out-licensing (East-to-West) shape the deal type category?
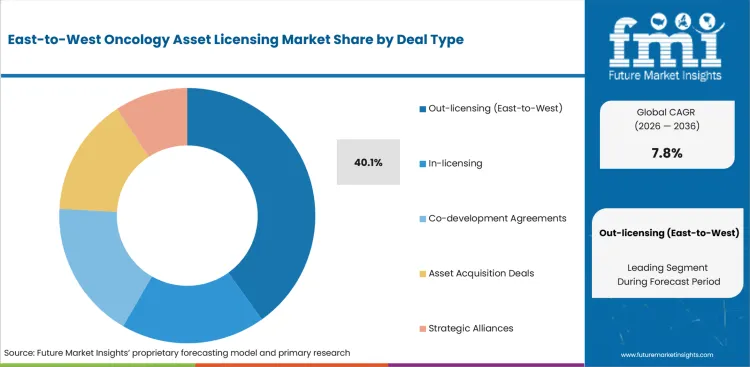
The route leads when an Asian originator keeps part of the asset value and a western company receives clear rights for development or commercialization. Licensing teams use this structure when the asset has enough evidence to justify a wider trial plan. A larger partner then carries global execution.
- With an estimated 40.1% share in 2026, Out-licensing (East-to-West) is anticipated to lead as rights transfer is easier to value than broad alliance language. The structure lets the partner assign costs to trial design and regulatory work without taking ownership of the whole company.
- Commercial value improves when territory scope and milestone triggers are defined before diligence begins. This reduces later conflict over who funds global trials and who manages manufacturing changes.
How do small molecule oncology drugs shape the asset type category?
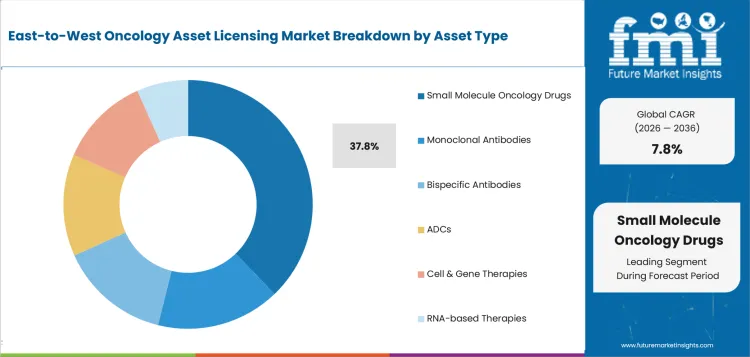
Small Molecule Oncology Drugs hold 37.8% of the Asset Type category in 2026. Their lead is tied to familiar development files and clearer chemistry review. Licensees compare target biology and dose with formulation and safety margins. Manufacturing transfer remains easier to review when chemistry files are complete. This helps partners move from diligence to term-sheet decisions with less operational delay.
- By Asset Type, Small Molecule Oncology Drugs are expected to lead with 37.8% share in 2026 as development records are easier to compare. Chemistry and formulation files give the receiving company a clearer basis for cost planning.
- The segment gains value when the patient-selection basis is easy to explain across tumor type and treatment line. Unclear biomarker selection slows valuation because a drug with a good target is at risk of failing in the wrong patient group.
How does preclinical shape the development stage category?
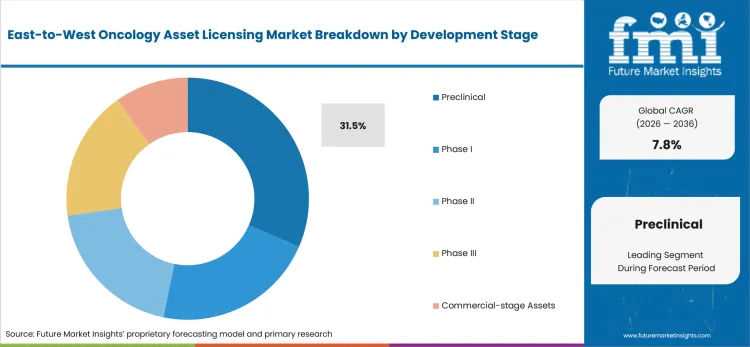
Early-stage licensing gives western companies a chance to enter before Phase I data raises price. The trade-off is higher scientific risk. Diligence therefore focuses on reproducibility and toxicology planning. The path into first-in-human testing remains a separate review point.
- Preclinical programs account for 31.5% of Development Stage revenue in 2026 since partners seek early access to novel mechanisms. The lower entry price helps companies build optionality before clinical proof improves.
- Risk remains material at this stage because animal data and target reasoning do not guarantee human response. Terms work best when later payments depend on dose and safety. First efficacy signals then become the next value trigger.
How do solid tumors shape the therapeutic area category?
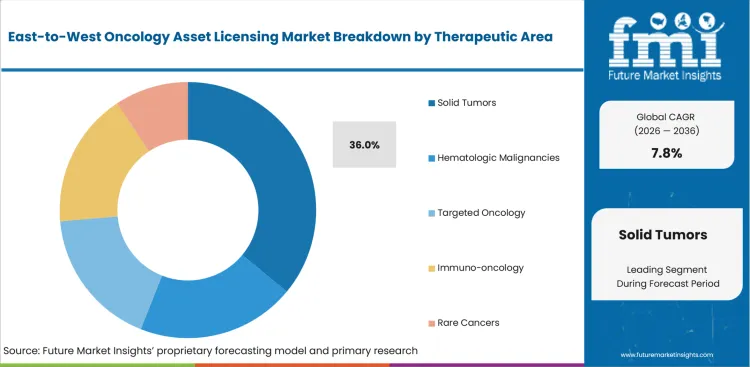
Solid Tumors hold 36.0% of the Therapeutic Area category in 2026. The share reflects broad deal activity across high-incidence cancers such as lung and breast. Gastric and colorectal cancer create further licensing paths for targeted assets. These tumor groups offer many trial routes and several possible combination settings. Partner interest is strongest when the asset has a clear biomarker story and a practical role beside existing immunotherapy or targeted agents.
- A 36.0% share is anticipated for Solid Tumors in 2026 due to broad patient pools and multiple treatment-line options. This gives licensees more room to test combinations and sequence the asset against current care.
- Solid tumor deals require careful patient selection because broad indications often hide weak response groups. Commercial teams value assets that show where the drug fits before expensive later trials begin.
What are the drivers, restraints, and opportunities in the East-to-West Oncology Asset Licensing Market?
External oncology innovation is raising licensing demand, while evidence gaps and regulatory handoffs still limit deal speed.
- Driver: Western drug companies are projected to license more Asian-origin oncology assets when the asset already has a clear target and early clinical signal.
- Restraint: Deal speed is constrained when global filing duties and safety records remain unclear. Manufacturing transfer responsibility becomes another delay point when it is not assigned early.
- Opportunity: Late-stage solid tumor assets are expected to gain stronger value when the originator has support capacity for global trials after the license is signed.
The main driver is external innovation that shortens the search for differentiated oncology assets. Bristol Myers Squibb and Hengrui Pharma announced global strategic collaboration and license agreements in May 2026. The arrangement covered 13 early-stage programs across oncology and related therapy areas. This supports the market mechanism because western companies gain access to several assets without waiting for internal discovery to produce every candidate. The deal shows why partners clarify territory rights and early development ownership before a portfolio license becomes usable.
The main restraint is the amount of regulatory and evidence work required after the deal is signed. FDA describes Project Orbis as a framework for concurrent submission and review of oncology products among international partners. This fits the licensing market because cross-border assets need aligned global submission plans before western partners commit to larger development or filing work. Each partner aligns filing records and safety files before wider review. Country-specific review documents remain a separate workstream. Licensing value falls when those records are incomplete because the receiving company carries added time and cost before a global trial or approval filing proceeds.
The main opportunity is a larger role for Asian-origin assets that already have late-stage data and a defined western partner. Takeda closed its strategic partnership with Innovent Biologics in December 2025. The agreement gave Takeda rights to IBI363 and IBI343 outside Greater China and included an option for IBI3001. Similar structures help originators convert local clinical work into broader value while the licensee manages larger trial and launch responsibilities.
Which country CAGRs are profiled in the East-to-West Oncology Asset Licensing Market?
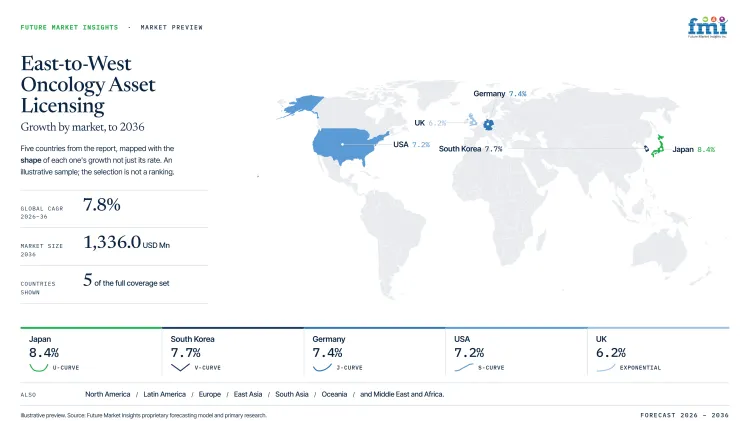
| Country | CAGR |
|---|---|
| USA | 7.2% |
| UK | 6.2% |
| Germany | 7.4% |
| Japan | 8.4% |
| South Korea | 7.7% |
How do country-level CAGRs compare in the East-to-West Oncology Asset Licensing Market?
The country comparison shows a narrow growth band across the five disclosed markets. Japan records the highest rate at 8.4% CAGR and South Korea follows at 7.7% CAGR. Germany and the USA form the middle of the range. The UK remains lower because pathway fit and payer review slows late-stage asset uptake. The spread shows different licensing conditions without creating a sharp split between high-growth and low-growth markets.
- Japan leads the comparison and establishes East Asia as the strongest profiled growth cluster.
- South Korea follows closely because biotech companies use global partnerships to widen development reach.
- Germany and the USA form a second growth band where regulatory planning and launch economics shape deal selection.
- The UK profile remains steady because NHS evidence review affects how quickly late-stage assets move into routine use.
- The pattern resembles a gradual slope instead of a sharp separation between licensing markets.
Markets with broadly similar CAGRs still present different entry conditions due to local trial capacity and partner history. The full report provides country-level analysis across North America, Latin America, Europe, East Asia, South Asia, Oceania and the Middle East and Africa.
Country-wise Analysis
- United States companies evaluate Asian-origin oncology assets through FDA evidence expectations and later reimbursement planning. The USA is forecast to advance at 7.2% CAGR from 2026 to 2036. USA-based licensees remain central because they combine oncology development capacity, filing experience, and launch resources. Licensing teams require patient-selection evidence and clean manufacturing transfer before a candidate earns a global development budget. Investment plans work best when they separate clinical promise from launch responsibility because a weak evidence handoff reduces the value of an otherwise attractive asset.
- UK licensing decisions are shaped by NHS pathway fit and clear value evidence for cancer medicines. Demand in the UK is projected to rise at 6.2% CAGR through 2036. Deal teams test whether the asset shortens a treatment gap or improves patient selection. Contracts require enough evidence for appraisal discussions because weak pathway fit delays commercialization after rights have transferred.
- Germany combines oncology R&D depth with a review system that asks for clear patient benefit. German demand is estimated to expand at 7.4% CAGR from 2026 to 2036. German partners still have to align EU documentation and safety files before broader development moves forward. Manufacturing records remain a separate review point. Investment teams are expected to ask for early evidence on patient groups because benefit review reduces value when survival or response data is weak.
- Japan has local oncology companies that understand Asian clinical data and global partner expectations. Adoption in Japan is forecast to record 8.4% CAGR by 2036. Japanese licensees use domestic clinical experience to judge whether a Chinese or Korean asset has a practical global path. Asset selection works best when it favors clear biomarker reasoning because a broad tumor claim without patient selection weakens partner confidence.
- South Korea has a biotechnology base that often uses outbound licensing to reach larger trial networks. South Korean demand is anticipated to advance at 7.7% CAGR through 2036. Local companies have to show data that western partners use without rebuilding the trial plan. Licensing terms work best when they protect smaller developers as later-stage funding and overseas regulatory work shift to a larger partner.
Who are the notable companies in the East-to-West Oncology Asset Licensing Market?
Merck & Co., Inc., LaNova Medicines Ltd., BioNTech SE, Biotheus Inc., Pfizer Inc., 3SBio Inc., Takeda Pharmaceutical Company Limited, Innovent Biologics, Bristol Myers Squibb, AstraZeneca plc, and Jiangsu Hengrui Pharmaceuticals Co., Ltd. are the notable companies shaping this market.
The competitive outlook combines western drug companies seeking external oncology assets with Asian originators seeking global development reach. Licensees compete through trial funding and filing ownership. Commercial scale remains part of the offer. Originators compete by presenting credible clinical data and manufacturing records that a partner trusts. Commercial success depends on a clear handoff because one weak dossier delays the next trial even when the biology is attractive.
- Pfizer and AstraZeneca plc compete for Asian-origin oncology assets that add depth to established oncology pipelines.
- BioNTech and Takeda use acquisition or partnership routes when they want broader control over development outside Greater China.
- LaNova Medicines and 3SBio show how Asian developers convert local oncology science into global licensing value. Innovent Biologics and Hengrui Pharma add further evidence through large cross-border agreements.
Competitive Benchmarking: East-to-West Oncology Asset Licensing Market
| Company | Western Licensee Role | Asian-Origin Asset Role | Development Control | Geographic Reach |
|---|---|---|---|---|
| Merck & Co., Inc. | High | Medium | High | Global |
| LaNova Medicines Ltd. | Low | High | Medium | China and global partners |
| BioNTech SE | High | Medium | High | Global |
| Biotheus Inc. | Low | High | Medium | China and global partners |
| Pfizer Inc. | High | Medium | High | Global ex-China rights |
| 3SBio Inc. | Low | High | Medium | China and global partners |
| Takeda Pharmaceutical Company Limited | High | Medium | High | Global outside Greater China |
| Innovent Biologics | Low | High | Medium | China and global partners |
| Bristol Myers Squibb | High | Medium | High | Global |
| Jiangsu Hengrui Pharmaceuticals Co., Ltd. | Low | High | Medium | China and global partners |
| AstraZeneca plc | High | Medium | High | Global |
Scoring basis: High indicates a documented core role in cross-border oncology licensing or development control. Medium indicates direct support through an asset portfolio or partnership position. Low indicates limited evidence for that specific role within the named workflow.
Key Developments in the East-to-West Oncology Asset Licensing Market
- In July 2026, AstraZeneca plc entered an exclusive global license agreement with Dizal Pharmaceutical for Zegfrovy. The deal gave AstraZeneca plc worldwide development and commercialization rights for the oral EGFR inhibitor. The asset is approved in the United States and China for a defined lung cancer population. The agreement shows how an eastern oncology product moves into a broader global launch route.
- In July 2025, Pfizer completed its global ex-China licensing agreement with 3SBio for SSGJ-707. The investigational asset is a PD-1 and VEGF bispecific antibody. Pfizer received rights for development and manufacturing outside China. Commercialization rights were included in the same territory package. The deal gives Pfizer another route to expand oncology pipeline depth without relying only on internal discovery.
- In February 2025, BioNTech completed its acquisition of Biotheus. The transaction gave BioNTech full global rights to BNT327 and rights to other Biotheus pipeline candidates. The acquisition added an antibody generation platform and a China research site. This widened BioNTech control over an Asian-origin oncology program.
- In May 2026, Bristol Myers Squibb and Hengrui Pharma announced strategic agreements across oncology, hematology, and immunology. The arrangement covered multiple early-stage programs and shows how western companies use collaboration structures to access Asian-origin oncology assets while sharing development risk.
Key Players in the East-to-West Oncology Asset Licensing Market
Global Licensees and Acquirers
- Merck & Co., Inc.
- BioNTech SE
- Pfizer Inc.
- Takeda Pharmaceutical Company Limited
- Bristol Myers Squibb
- AstraZeneca plc
Asian Oncology Originators
- LaNova Medicines Ltd.
- Biotheus Inc.
- 3SBio Inc.
- Innovent Biologics
- Jiangsu Hengrui Pharmaceuticals Co., Ltd.
Additional Companies Tracked in Deal Screening
- Dizal Pharmaceutical Co., Ltd.
East-to-West Oncology Asset Licensing Market - Report Scope
| Coverage field | Report scope |
|---|---|
| Market breakdown | Deal type, asset type, development stage, therapeutic area, and region. |
| Quantitative Units | Revenue in USD Million, CAGR in %. |
| Market Definition | Oncology assets originated in eastern markets and licensed, acquired, or co-developed for western clinical and commercial pathways. |
| Regions Covered | North America, Latin America, Europe, East Asia, South Asia, Oceania, and Middle East and Africa. |
| Countries Covered | USA, UK, Germany, Japan, and South Korea. |
| Key Companies Profiled | Merck & Co., Inc., LaNova Medicines Ltd., BioNTech SE, Biotheus Inc., Pfizer Inc., 3SBio Inc., Takeda Pharmaceutical Company Limited, Innovent Biologics, Bristol Myers Squibb, AstraZeneca plc, and Jiangsu Hengrui Pharmaceuticals Co., Ltd. |
| Forecast Period | 2026 to 2036. |
| Approach | Hybrid bottom-up and top-down market sizing supported by primary interviews and official desk research. |
East-to-West Oncology Asset Licensing Market - Research Methodology
| Method | Approach |
|---|---|
| Primary Research | FMI analysts gathered input from manufacturers, service providers, technology developers, distributors, end users, procurement teams, and subject-matter experts. Interviews examined purchasing decisions, product or service evaluation, adoption barriers, approval requirements, pricing considerations, and expectations for technical or commercial support. Respondents were also asked what evidence is required before a trial, pilot, or initial order develops into regular purchasing. |
| Desk Research | Desk research covered government statistics, regulatory publications, trade data, industry associations, technical literature, standards, company filings, product information, and official corporate announcements. Sources were reviewed for relevance, publication date, geographic coverage, and consistency with the defined market scope. Claims relating to performance, applications, approvals, capacity, investment, and commercial activity were retained only when supported by credible public evidence. |
| Market Sizing and Forecasting | The market model combined the baseline value with historical performance, segment structure, pricing and volume indicators, adoption levels, company participation, and country-level demand conditions. Forecast assumptions considered economic activity, investment trends, regulatory developments, technology adoption, purchasing cycles, supply availability, and barriers to wider market use. Segment and regional estimates were reconciled before the final market total was calculated. |
| Data Validation | Estimates were checked against multiple independent indicators, including public data, company activity, trade patterns, industry developments, and findings from primary interviews. Validation also tested whether products, services, applications, and company revenues fell within the defined market boundaries. Adjacent categories, unsupported claims, overlapping revenues, and activities without direct market relevance were excluded to reduce double counting and maintain consistency across segments and countries. |
East-to-West Oncology Asset Licensing Market by Segments
East-to-West Oncology Asset Licensing Market segmented by Deal Type:
- Out-licensing (East-to-West)
- In-licensing
- Co-development Agreements
- Asset Acquisition Deals
- Strategic Alliances
East-to-West Oncology Asset Licensing Market segmented by Asset Type:
- Small Molecule Oncology Drugs
- Monoclonal Antibodies
- Antibody-drug Conjugates
- Bispecific Antibodies
- Cell and Gene Therapies
- Cancer Vaccines
East-to-West Oncology Asset Licensing Market segmented by Development Stage:
- Preclinical
- Phase I
- Phase II
- Phase III
- Marketed Assets
East-to-West Oncology Asset Licensing Market segmented by Therapeutic Area:
- Solid Tumors
- Hematologic Malignancies
- Lung Cancer
- Breast Cancer
- Gastric and Colorectal Cancer
- Rare Oncology Indications
East-to-West Oncology Asset Licensing Market by Region:
- North America
- United States
- Canada
- Latin America
- Brazil
- Mexico
- Argentina
- Chile
- Western Europe
- Germany
- France
- United Kingdom
- Italy
- Spain
- Benelux
- Nordics
- Eastern Europe
- Poland
- Czech Republic
- Romania
- Hungary
- East Asia
- China
- Japan
- South Korea
- South Asia and Pacific
- India
- ASEAN
- Australia and New Zealand
- Middle East and Africa
- GCC Countries
- South Africa
- Türkiye
- Israel
Research Sources and Bibliography
- AstraZeneca plc. (2026, July 14). AstraZeneca licenses novel EGFR inhibitor. AstraZeneca.
- BioNTech SE. (2025, February 3). BioNTech completes acquisition of Biotheus.
- Bristol Myers Squibb. (2026, May 12). Bristol Myers Squibb and Hengrui Pharma announce strategic agreements to advance innovative medicines across oncology, hematology, and immunology.
- Merck & Co., Inc. (2024, December 20). Merck closes exclusive global license agreement for LM-299, an investigational anti-PD-1/VEGF bispecific antibody from LaNova Medicines Ltd.
- Pfizer Inc. (2025, July 24). Pfizer completes licensing agreement with 3SBio.
- Takeda Pharmaceutical Company Limited. (2025, December 4). Takeda announces closing of strategic partnership with Innovent Biologics for next-generation investigational oncology medicines.
- USA Food and Drug Administration. (2026, May 14). Project Orbis.
This bibliography is provided for reader reference and is not exhaustive. The full report contains the complete reference list and detailed citations
This Report Answers
- How large is the east-to-west oncology asset licensing market in 2026 and 2036?
- Which deal structures support oncology asset transfer from eastern originators to western companies?
- Why does Out-licensing (East-to-West) hold the leading Deal Type share in 2026?
- How do Small Molecule Oncology Drugs influence licensing diligence and valuation?
- Why does Preclinical account for leading share within Development Stage in 2026?
- How do country growth rates differ across the USA, UK, Germany, Japan, and South Korea?
- Which companies shape western licensing and Asian-origin asset development?
- What slows cross-border licensing when evidence records or territory rights remain unclear?
- How do milestone terms align development risk with asset maturity?
Frequently Asked Questions
How big is the East-to-West Oncology Asset Licensing Market in 2026?
The east-to-west oncology asset licensing market is valued at USD 630.4 million in 2026 and is forecast to reach USD 1,336.0 million by 2036.
What is the CAGR of the East-to-West Oncology Asset Licensing Market from 2026 to 2036?
The east-to-west oncology asset licensing market is projected to grow at a CAGR of 7.8% between 2026 and 2036, supported by western drug companies licensing more Asian-origin oncology assets when the asset already has a clear target and early clinical signal.
Which therapeutic area leads the East-to-West Oncology Asset Licensing Market?
Solid tumors account for 36.0% of the east-to-west oncology asset licensing market by therapeutic area in 2026, driven by broad deal activity across high-incidence cancers including lung, breast, gastric, and colorectal cancer programs offering multiple treatment-line options.
Which deal type leads the East-to-West Oncology Asset Licensing Market?
Out-licensing accounts for 40.1% of the east-to-west oncology asset licensing market by deal type in 2026, driven by clear territory transfer and defined operating responsibility across partnered development programs.
Who are the leading companies in the East-to-West Oncology Asset Licensing Market?
Leading companies in the east-to-west oncology asset licensing market include Merck & Co., BioNTech, Pfizer, Takeda, Bristol Myers Squibb, AstraZeneca, LaNova Medicines, Biotheus, 3SBio, Innovent Biologics, and Jiangsu Hengrui Pharmaceuticals, competing across global licensee and Asian-origin asset development roles.
Preview the report firsthand - request a free sample
Get SampleGet the brochure for pricing and purchase details.
Get PDFTable of Content
- Key Takeaways
- Market Size and CAGR
- Top Growth Driver
- Fastest Growing Segment
- Leading Region
- Key Companies
- Emerging Opportunities
- Executive Summary
- Global Market Outlook
- Demand-side Trends
- Supply-side Trends
- Technology Roadmap Analysis
- Analysis and Recommendations
- Analyst Perspective (What is happening? Why now? What should investors know?)
- Key Questions Answered
- How large is the market?
- What is the CAGR?
- What are key trends?
- Which region dominates?
- Who are the leaders?
- Market Overview
- Market Coverage / Taxonomy
- Market Definition / Scope / Limitations
- Research Methodology
- Chapter Orientation
- Analytical Lens and Working Hypotheses
- Market Structure, Signals, and Trend Drivers
- Benchmarking and Cross-market Comparability
- Market Sizing, Forecasting, and Opportunity Mapping
- Research Design and Evidence Framework
- Desk Research Programme (Secondary Evidence)
- Expert Input and Fieldwork (Primary Evidence)
- Tooling, Models, and Reference Databases
- Data Engineering and Model Build
- Quality Assurance and Audit Trail
- Market Background
- Market Dynamics (Drivers, Restraints, Opportunity, Trends)
- Scenario Forecast (Optimistic, Likely, Conservative)
- Impact Analysis
- AI Impact
- Sustainability Impact
- Regulatory Impact
- Technology Impact
- Consumer / Buyer Analysis
- Purchase Drivers
- Adoption Barriers
- Buyer Journey
- Opportunity Map Analysis
- Product Life Cycle Analysis
- Supply Chain Analysis
- Investment Feasibility Matrix
- Value Chain Analysis
- PESTLE and Porter's Analysis
- Regulatory Landscape
- Regional Parent Market Outlook
- Production and Consumption Statistics
- Import and Export Statistics
- Global Market Analysis and Forecast, 2021 to 2036
- Historical Market Size Value (USD Million) Analysis, 2021 to 2025
- Current and Future Market Size Value (USD Million) Projections, 2026 to 2036
- Y-o-Y Growth Trend Analysis
- Absolute $ Opportunity Analysis
- Global Market Pricing Analysis, 2021 to 2036
- Global Market Analysis and Forecast, By Deal Type, 2021 to 2036
- Introduction / Key Findings
- Historical Market Size Value (USD Million) Analysis By Deal Type, 2021 to 2025
- Current and Future Market Size Value (USD Million) Analysis and Forecast By Deal Type, 2026 to 2036
- Out-licensing (East-to-West)
- In-licensing
- Co-development Agreements
- Asset Acquisition Deals
- Strategic Alliances
- Out-licensing (East-to-West)
- Y-o-Y Growth Trend Analysis By Deal Type, 2021 to 2025
- Absolute $ Opportunity Analysis By Deal Type, 2026 to 2036
- Global Market Analysis and Forecast, By Asset Type, 2021 to 2036
- Introduction / Key Findings
- Historical Market Size Value (USD Million) Analysis By Asset Type, 2021 to 2025
- Current and Future Market Size Value (USD Million) Analysis and Forecast By Asset Type, 2026 to 2036
- Small Molecule Oncology Drugs
- Monoclonal Antibodies
- Bispecific Antibodies
- ADCs
- Cell & Gene Therapies
- RNA-based Therapies
- Small Molecule Oncology Drugs
- Y-o-Y Growth Trend Analysis By Asset Type, 2021 to 2025
- Absolute $ Opportunity Analysis By Asset Type, 2026 to 2036
- Global Market Analysis and Forecast, By Development Stage, 2021 to 2036
- Introduction / Key Findings
- Historical Market Size Value (USD Million) Analysis By Development Stage, 2021 to 2025
- Current and Future Market Size Value (USD Million) Analysis and Forecast By Development Stage, 2026 to 2036
- Preclinical
- Phase I
- Phase II
- Phase III
- Commercial-stage Assets
- Preclinical
- Y-o-Y Growth Trend Analysis By Development Stage, 2021 to 2025
- Absolute $ Opportunity Analysis By Development Stage, 2026 to 2036
- Global Market Analysis and Forecast, By Therapeutic Area, 2021 to 2036
- Introduction / Key Findings
- Historical Market Size Value (USD Million) Analysis By Therapeutic Area, 2021 to 2025
- Current and Future Market Size Value (USD Million) Analysis and Forecast By Therapeutic Area, 2026 to 2036
- Solid Tumors
- Hematologic Malignancies
- Targeted Oncology
- Immuno-oncology
- Rare Cancers
- Solid Tumors
- Y-o-Y Growth Trend Analysis By Therapeutic Area, 2021 to 2025
- Absolute $ Opportunity Analysis By Therapeutic Area, 2026 to 2036
- Global Market Analysis and Forecast, By Region, 2021 to 2036
- Introduction
- Historical Market Size Value (USD Million) Analysis By Region, 2021 to 2025
- Current Market Size Value (USD Million) Analysis and Forecast By Region, 2026 to 2036
- North America
- Latin America
- Western Europe
- Eastern Europe
- East Asia
- South Asia and Pacific
- Middle East & Africa
- Market Attractiveness Analysis By Region
- North America Market Analysis and Forecast, By Country, 2021 to 2036
- Historical Market Size Value (USD Million) Trend Analysis By Market Taxonomy, 2021 to 2025
- Market Size Value (USD Million) Forecast By Market Taxonomy, 2026 to 2036
- By Country
- USA
- Canada
- By Deal Type
- By Asset Type
- By Development Stage
- By Therapeutic Area
- By Country
- Market Attractiveness Analysis
- By Country
- By Deal Type
- By Asset Type
- By Development Stage
- By Therapeutic Area
- Key Takeaways
- Latin America Market Analysis and Forecast, By Country
- Historical Market Size Value (USD Million) Trend Analysis By Market Taxonomy, 2021 to 2025
- Market Size Value (USD Million) Forecast By Market Taxonomy, 2026 to 2036
- By Country
- Brazil
- Mexico
- Chile
- Rest of Latin America
- By Deal Type
- By Asset Type
- By Development Stage
- By Therapeutic Area
- By Country
- Market Attractiveness Analysis
- By Country
- By Deal Type
- By Asset Type
- By Development Stage
- By Therapeutic Area
- Key Takeaways
- Western Europe Market Analysis and Forecast, By Country
- Historical Market Size Value (USD Million) Trend Analysis By Market Taxonomy, 2021 to 2025
- Market Size Value (USD Million) Forecast By Market Taxonomy, 2026 to 2036
- By Country
- Germany
- UK
- Italy
- Spain
- France
- Nordic
- BENELUX
- Rest of Western Europe
- By Deal Type
- By Asset Type
- By Development Stage
- By Therapeutic Area
- By Country
- Market Attractiveness Analysis
- By Country
- By Deal Type
- By Asset Type
- By Development Stage
- By Therapeutic Area
- Key Takeaways
- Eastern Europe Market Analysis and Forecast, By Country
- Historical Market Size Value (USD Million) Trend Analysis By Market Taxonomy, 2021 to 2025
- Market Size Value (USD Million) Forecast By Market Taxonomy, 2026 to 2036
- By Country
- Russia
- Poland
- Hungary
- Balkan & Baltic
- Rest of Eastern Europe
- By Deal Type
- By Asset Type
- By Development Stage
- By Therapeutic Area
- By Country
- Market Attractiveness Analysis
- By Country
- By Deal Type
- By Asset Type
- By Development Stage
- By Therapeutic Area
- Key Takeaways
- East Asia Market Analysis and Forecast, By Country
- Historical Market Size Value (USD Million) Trend Analysis By Market Taxonomy, 2021 to 2025
- Market Size Value (USD Million) Forecast By Market Taxonomy, 2026 to 2036
- By Country
- China
- Japan
- South Korea
- By Deal Type
- By Asset Type
- By Development Stage
- By Therapeutic Area
- By Country
- Market Attractiveness Analysis
- By Country
- By Deal Type
- By Asset Type
- By Development Stage
- By Therapeutic Area
- Key Takeaways
- South Asia and Pacific Market Analysis and Forecast, By Country
- Historical Market Size Value (USD Million) Trend Analysis By Market Taxonomy, 2021 to 2025
- Market Size Value (USD Million) Forecast By Market Taxonomy, 2026 to 2036
- By Country
- India
- ASEAN
- Australia & New Zealand
- Rest of South Asia and Pacific
- By Deal Type
- By Asset Type
- By Development Stage
- By Therapeutic Area
- By Country
- Market Attractiveness Analysis
- By Country
- By Deal Type
- By Asset Type
- By Development Stage
- By Therapeutic Area
- Key Takeaways
- Middle East & Africa Market Analysis and Forecast, By Country
- Historical Market Size Value (USD Million) Trend Analysis By Market Taxonomy, 2021 to 2025
- Market Size Value (USD Million) Forecast By Market Taxonomy, 2026 to 2036
- By Country
- Kingdom of Saudi Arabia
- Other GCC Countries
- Türkiye
- South Africa
- Other African Union
- Rest of Middle East & Africa
- By Deal Type
- By Asset Type
- By Development Stage
- By Therapeutic Area
- By Country
- Market Attractiveness Analysis
- By Country
- By Deal Type
- By Asset Type
- By Development Stage
- By Therapeutic Area
- Key Takeaways
- Key Countries Market Analysis
- USA
- Pricing Analysis
- Market Share Analysis, 2025
- By Deal Type
- By Asset Type
- By Development Stage
- By Therapeutic Area
- Canada
- Pricing Analysis
- Market Share Analysis, 2025
- By Deal Type
- By Asset Type
- By Development Stage
- By Therapeutic Area
- Mexico
- Pricing Analysis
- Market Share Analysis, 2025
- By Deal Type
- By Asset Type
- By Development Stage
- By Therapeutic Area
- Brazil
- Pricing Analysis
- Market Share Analysis, 2025
- By Deal Type
- By Asset Type
- By Development Stage
- By Therapeutic Area
- Chile
- Pricing Analysis
- Market Share Analysis, 2025
- By Deal Type
- By Asset Type
- By Development Stage
- By Therapeutic Area
- Germany
- Pricing Analysis
- Market Share Analysis, 2025
- By Deal Type
- By Asset Type
- By Development Stage
- By Therapeutic Area
- UK
- Pricing Analysis
- Market Share Analysis, 2025
- By Deal Type
- By Asset Type
- By Development Stage
- By Therapeutic Area
- Italy
- Pricing Analysis
- Market Share Analysis, 2025
- By Deal Type
- By Asset Type
- By Development Stage
- By Therapeutic Area
- Spain
- Pricing Analysis
- Market Share Analysis, 2025
- By Deal Type
- By Asset Type
- By Development Stage
- By Therapeutic Area
- France
- Pricing Analysis
- Market Share Analysis, 2025
- By Deal Type
- By Asset Type
- By Development Stage
- By Therapeutic Area
- India
- Pricing Analysis
- Market Share Analysis, 2025
- By Deal Type
- By Asset Type
- By Development Stage
- By Therapeutic Area
- ASEAN
- Pricing Analysis
- Market Share Analysis, 2025
- By Deal Type
- By Asset Type
- By Development Stage
- By Therapeutic Area
- Australia & New Zealand
- Pricing Analysis
- Market Share Analysis, 2025
- By Deal Type
- By Asset Type
- By Development Stage
- By Therapeutic Area
- China
- Pricing Analysis
- Market Share Analysis, 2025
- By Deal Type
- By Asset Type
- By Development Stage
- By Therapeutic Area
- Japan
- Pricing Analysis
- Market Share Analysis, 2025
- By Deal Type
- By Asset Type
- By Development Stage
- By Therapeutic Area
- South Korea
- Pricing Analysis
- Market Share Analysis, 2025
- By Deal Type
- By Asset Type
- By Development Stage
- By Therapeutic Area
- Russia
- Pricing Analysis
- Market Share Analysis, 2025
- By Deal Type
- By Asset Type
- By Development Stage
- By Therapeutic Area
- Poland
- Pricing Analysis
- Market Share Analysis, 2025
- By Deal Type
- By Asset Type
- By Development Stage
- By Therapeutic Area
- Hungary
- Pricing Analysis
- Market Share Analysis, 2025
- By Deal Type
- By Asset Type
- By Development Stage
- By Therapeutic Area
- Kingdom of Saudi Arabia
- Pricing Analysis
- Market Share Analysis, 2025
- By Deal Type
- By Asset Type
- By Development Stage
- By Therapeutic Area
- Türkiye
- Pricing Analysis
- Market Share Analysis, 2025
- By Deal Type
- By Asset Type
- By Development Stage
- By Therapeutic Area
- South Africa
- Pricing Analysis
- Market Share Analysis, 2025
- By Deal Type
- By Asset Type
- By Development Stage
- By Therapeutic Area
- USA
- Market Structure Analysis
- Competition Dashboard
- Competition Benchmarking
- Market Share Analysis of Top Players
- By Regional
- By Deal Type
- By Asset Type
- By Development Stage
- By Therapeutic Area
- Emerging Startups
- Innovation Benchmarking
- Competition Analysis
- Competition Deep Dive
- Philips
- Overview
- Product Portfolio
- Profitability by Market Segments
- Sales Footprint
- Strategy Overview
- Marketing Strategy
- Product Strategy
- Channel Strategy
- GE HealthCare
- Medtronic
- Abbott
- Boston Scientific
- Omron Healthcare
- Masimo
- BioTelemetry
- iRhythm Technologies
- Dexcom
- Philips
- Case Studies
- Success Stories
- Recent Developments
- Competition Deep Dive
- Assumptions & Acronyms Used


