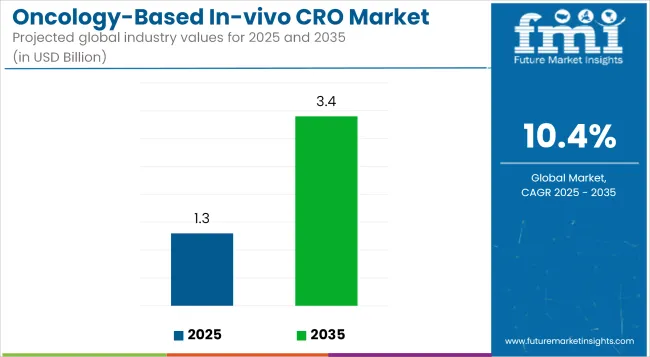
The global Oncology-Based In-vivo CRO Market is estimated to be valued at USD 1.3 billion in 2025 and is projected to reach USD 3.4 billion by 2035, registering a compound annual growth rate of 10.4% over the forecast period.
| Metric | Value |
|---|---|
| 2025 Market Size | USD 1.3 billion |
| 2035 Market Size | USD 3.4 billion |
| CAGR (2025 to 2035) | 10.4% |
The Oncology-Based In-vivo CRO market is undergoing robust growth, driven by the rising complexity of cancer research and the shift toward outsourcing preclinical drug development. Increasing cancer incidence and the demand for novel therapies are prompting pharmaceutical and biotech companies to rely on CROs with specialized in-vivo capabilities.
The use of advanced technologies like AI and patient-derived xenograft models is enhancing study precision and translational value. Additionally, the industry’s focus on personalized medicine is increasing demand for tailored in-vivo testing. While North America remains the dominant region due to strong R&D investments, Asia-Pacific is emerging rapidly due to cost-efficiency and expanding research infrastructure. The market’s growth trajectory is shaped by innovation, regulatory support and the urgent need for targeted oncology solutions.
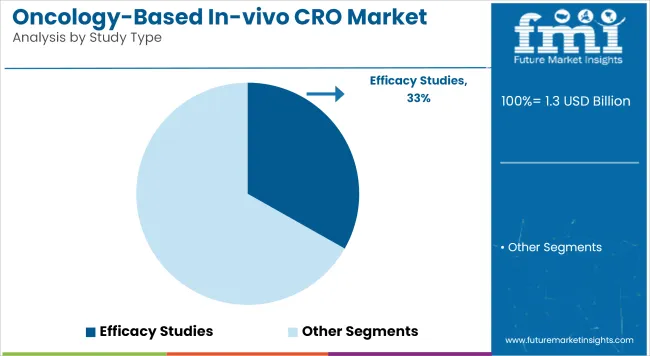
Efficacy Studies holds a revenue share of 33.2% in 2025, making this the leading segment within the Oncology-Based In-vivo CRO market. This dominance has been attributed to the critical role efficacy studies play in validating therapeutic candidates before clinical trials. Rising oncology drug pipelines and increased regulatory scrutiny have necessitated robust in-vivo models that demonstrate measurable anti-tumor responses.
This phase is viewed as essential in reducing late-stage failures, making efficacy assessment a strategic priority. Moreover, the incorporation of advanced xenograft and syngeneic tumor models has been encouraged by sponsors to simulate clinical tumor behavior more accurately.
Investment inflows from biotech firms and early-stage biopharma ventures have been channeled toward efficacy assessments, owing to their predictive value. As a result, reliance on CROs for high-fidelity efficacy testing has been intensified. Continuous innovation in animal modeling and imaging technologies has further elevated demand for efficacy study services.
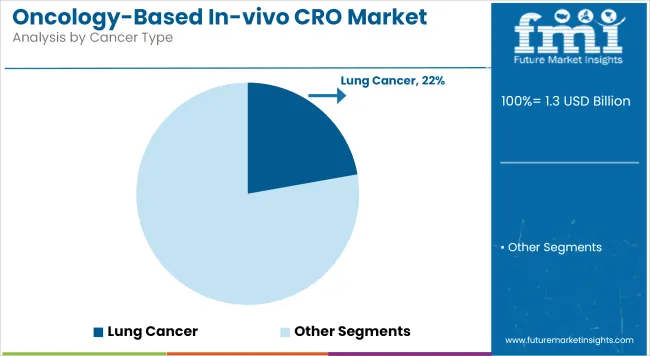
Lung cancer has captured a 22.2% share in the Oncology-Based In-vivo CRO market in 2025, positioning it as the most significant cancer indication by revenue. Its leadership status has been largely shaped by the disease’s high global prevalence and mortality rates, which have created an urgent need for innovative therapies.
As a result, significant preclinical R&D expenditure has been allocated by pharmaceutical and biotech sponsors to lung cancer models. The adoption of genetically engineered and patient-derived xenograft models has been prioritized to emulate the heterogeneity of non-small cell and small cell lung cancers.
Funding from government health bodies and private oncology foundations has also been directed toward lung cancer drug development, fueling CRO engagement. Further, the rising burden of tobacco-related and environmental carcinogens in developing economies has underscored the need for scalable preclinical testing. In-vivo CROs have been actively leveraged for high-throughput screening of targeted therapies and immune-oncology agents, reinforcing the segment’s dominance.
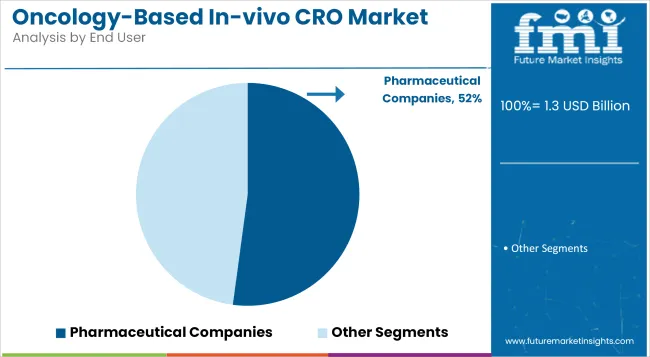
Pharmaceutical companies have been identified as the leading end users, holding 52.13% share in the Oncology-Based In-vivo CRO market in 2025. This trend has been supported by the strategic shift of pharma firms toward outsourcing preclinical research to streamline R&D operations.
The growing complexity of oncology drug development, particularly in targeted therapies and immuno-oncology, has prompted large pharma to collaborate with specialized CROs for efficacy, toxicology, and PK/PD testing. Outsourcing has been seen as a cost-efficient model to reduce infrastructure burdens and improve turnaround time.
Additionally, global pharma companies have demonstrated increased reliance on CROs offering regulatory-compliant, GLP-certified in-vivo services to meet diverse regulatory expectations. The trend has been reinforced by a surge in early-stage investigational studies, which demand translational accuracy and rapid iteration. CROs with integrated services and oncology-focused capabilities have become preferred partners, positioning pharmaceutical companies as the primary demand drivers in this evolving landscape.
High Study Costs, Complex Regulatory Compliance, and Limited Translational Models
However, the Oncology-based In-vivo Contract Research Organization (CRO Market) size is hindered by high preclinical oncology study costs associated with specialized models, tumor xenografts, genetically engineered mouse models (GEMMs), and longitudinal imaging technologies.
These studies require a significant amount of resources and time and this impacts the lead time for results and the budget for R&D for the sponsors. Regulatory compliance is another area in which CROs face significant challenges, as they are subject to stringent GLP (Good Laboratory Practices) guidelines, IACUC, and international animal welfare protocols, all of which can be especially relevant for oncology studies that involve tumor burden and ethical endpoints.
In addition, caner drug development is an area that faces a critical bottleneck: The lack of high-predictive in-vivo models that rigorously mirror human tumor heterogeneity has led to the pitifully low translation rate from the bench to the clinical trials.
Precision Oncology, Humanized Models, and AI-Driven Data Analytics
Despite the restraints in the market, the oncology based in-vivo CRO market moving ahead through strong growth opportunities such as rising demand for personalized oncology, humanized mouse models and AI-enabled in-vivo study platforms. CROs providing biomarker-driven tumor profiling, PDX, and immuno-oncology platforms are currently witnessing a tremendous traction in checkpoint inhibitor and CAR-T therapeutic development.
Artificial intelligence and machine learning for automated tumor volume assessment, image analysis, and predictive modeling are improving data accuracy and turnaround time. In addition, alliances between biotechnology companies, academia and CROs are also paving the way for data-sharing networks and AI-enabled preclinical study design that will help drive the scalability and competitiveness of in-vivo oncology service offerings.
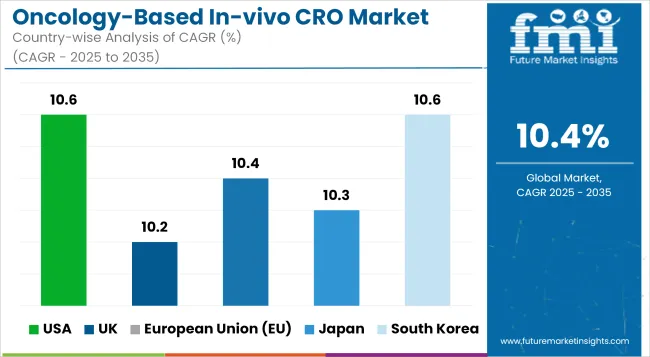
The USA based oncology-oriented in-vivo CRO industry growth is also supported by the increasing investments for research and development in the field of cancer therapeutics and robust pipeline of oncology drugs, which has increased the demand for preclinical efficacy and safety studies. The presence of major CROs and biotechnology hubs in the country, along with support from the National Cancer Institute (NCI) and FDA for the expedite of oncology research is aiding the market growth.
| Country | CAGR (2025 to 2035) |
|---|---|
| USA | 10.6% |
The United Kingdom market is growing due to the increasing partnerships between clinical research organizations (CROs) and academic research institutions, the rising trend of outsourcing clinical trial and a nationwide push towards precision oncology. The increasing demand for in-vivo models that closely mimic human tumor biology is stampeding the requirement for specialized CRO services.
| Country | CAGR (2025 to 2035) |
|---|---|
| UK | 10.2% |
The oncology-based In-vivo CRO market across European Union is emerging in a stable manner propelled by EU-funded programs to support cancer research programs, enhancing bioscience clusters, and increasing involvement in immuno-oncology studies. The move towards personalized medicine and targeted therapies is creating demand for advanced in-vivo models and translational research services.
| Country | CAGR (2025 to 2035) |
|---|---|
| European Union (EU) | 10.4% |
The Japan Oncology-based In-vivo CRO market is growing at a healthy rate due to government incentives for cancer drug development, rising clinical trials activity, and an increasing focus on the treatment of geriatric oncology. In Japan, the humanized mouse models and genetically engineered models (GEMs) are gaining widespread popularity among CROs.
| Country | CAGR (2025 to 2035) |
|---|---|
| Japan | 10.3% |
The market in South Korea is spearheaded by rapid growth witnessed in biotech start-ups, conducive regulatory support for preclinical outsourcing and increasing emphasis on biosimilar oncology development. The use of xenograft models and syngeneic tumors is improving the preclinical assessment of oncology pipelines.
| Country | CAGR (2025 to 2035) |
|---|---|
| South Korea | 10.6% |
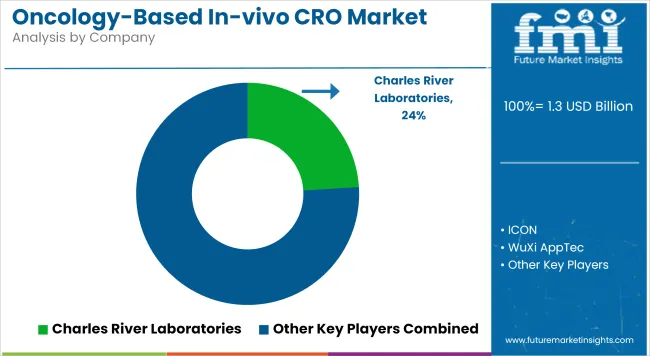
The Oncology-Based In-vivo CRO market is characterized by moderate to high competition, with players actively expanding their service portfolios to meet the rising demand for specialized oncology research. A significant focus has been placed on the development of advanced preclinical models, including patient-derived xenografts and humanized mouse models, to enhance translational outcomes.
Strategic collaborations with biotech firms, academic institutions, and clinical-stage pharma companies are being pursued to broaden client reach and research capabilities. Investment in AI-driven analytics, imaging platforms and bioinformatics tools is being accelerated to improve study accuracy and data interpretation. Additionally, market participants are increasingly offering integrated solutions that span target validation, efficacy testing, and regulatory support to position themselves as full-service providers.
Key Development:
The overall market size for the oncology-based in-vivo CRO market was USD 1.3 billion in 2025.
The oncology-based in-vivo CRO market is expected to reach USD 3.4 billion in 2035.
Growth is driven by the rising global cancer burden, increasing demand for preclinical oncology drug testing, advancements in personalized medicine, and growing outsourcing of R&D by pharmaceutical and biotech companies to accelerate oncology drug development.
The top 5 countries driving the development of the oncology-based in-vivo CRO market are the USA, China, Germany, Japan, and the UK.
Solid Tumor and Xenograft Models are expected to command a significant share over the assessment period.


Full Research Suite comprises of:
Market outlook & trends analysis
Interviews & case studies
Strategic recommendations
Vendor profiles & capabilities analysis
5-year forecasts
8 regions and 60+ country-level data splits
Market segment data splits
12 months of continuous data updates
DELIVERED AS:
PDF EXCEL ONLINE
Cross-species Organ Transplantation Market Forecast and Outlook 2025 to 2035
Cross Interconnection Protection Box Market Size and Share Forecast Outlook 2025 to 2035
Crotonic Acid Market Size and Share Forecast Outlook 2025 to 2035
Cross Corner Industrial Bags Market Size and Share Forecast Outlook 2025 to 2035
Cross-Linked Polyethylene Market Size and Share Forecast Outlook 2025 to 2035
Crowdsourced Security Market Size and Share Forecast Outlook 2025 to 2035
Crowdsourced Testing Market Size and Share Forecast Outlook 2025 to 2035
Crown Caps Market Size and Share Forecast Outlook 2025 to 2035
Cross-Border Road Transport Market Size and Share Forecast Outlook 2025 to 2035
Crown Glass Market Size and Share Forecast Outlook 2025 to 2035
Crossfit Apparel Market Size and Share Forecast Outlook 2025 to 2035
Cross Point Switch Market Size and Share Forecast Outlook 2025 to 2035
Cross Pein Hammer Market Size and Share Forecast Outlook 2025 to 2035
Cross Training Shoes Market Size and Share Forecast Outlook 2025 to 2035
Crop Bactericides Market Size and Share Forecast Outlook 2025 to 2035
Crossover Market Size and Share Forecast Outlook 2025 to 2035
Croscarmellose Sodium Market Size and Share Forecast Outlook 2025 to 2035
Crop Micronutrient Market Insights - Precision Farming & Yield Optimization 2025 to 2035
Crotonaldehyde Market Growth - Trends & Forecast 2025 to 2035
Crown Closures Market Growth & Packaging Innovations 2025 to 2035

Thank you!
You will receive an email from our Business Development Manager. Please be sure to check your SPAM/JUNK folder too.
Chat With
MaRIA