Elecampane Root Market Size and Share Forecast Outlook 2025 to 2035

The global elecampane root market is worth USD 940 million in 2025 and is expected to reach USD 1,590.5 million by 2035, reflecting a CAGR of 5.4%.
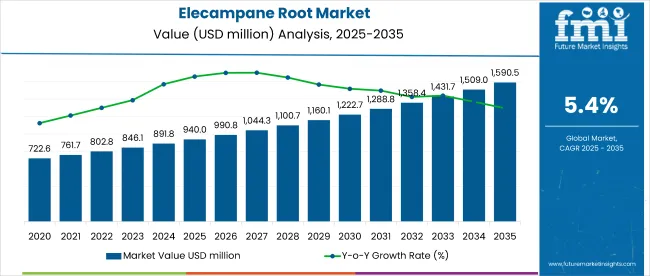
Quick Stats Of Elecampane Root Market

  • Market Value (2025): USD 940 million
  • Forecast Value (2035): USD 1,590.5 million
  • Forecast CAGR: 5.4%
  • Nature Leader in 2025: Conventional (45% Market Share)
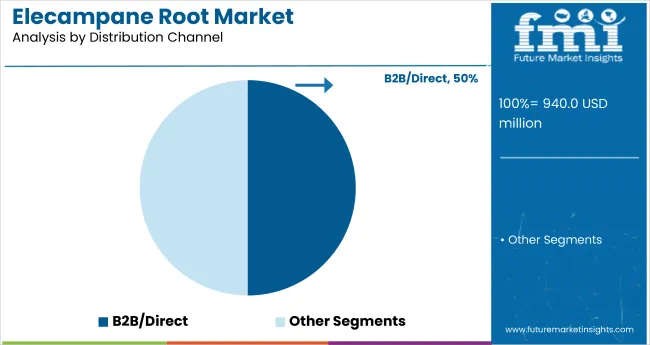
  • Top Distribution Channel: B2B/Direct (50% Market Share)
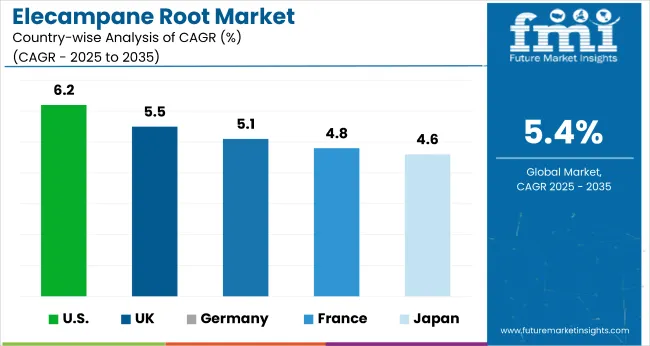
  • Key Growth Region: North America (USA is the fastest growing market with 6.2% CAGR)

Elecampane Root Market Market

Rising consumer awareness of natural and herbal remedies is driving the popularity of elecampane root, a historically used ingredient in traditional medicine, as it gains traction in modern health supplements due to its proven medicinal properties. The ongoing shift towards organic and natural products is further driving demand for elecampane root, which is commonly sold in dried root, powder, and supplement forms.

In 2025, the North America region is estimated to hold the largest share of the elecampane root market, driven by increasing consumer interest in natural health solutions. The market in the USA is growing at a robust CAGR of 6.2%.

Meanwhile, the UK and Germany closely follow this growth with prominent CAGRs of 5.5% and 5.1% respectively. By nature, the conventional segment is anticipated to lead with 60% of the market share, while the B2B/direct sales channel is expected to dominate the distribution channel with 50% of the market share in 2025.

The market holds a relatively small share within its parent markets. While precise percentages are not readily available for every segment, it can be estimated that the market holds about 0.5% to 1% of the herbal supplements market due to the niche nature of elecampane root compared to more widely used herbs. In the botanical extracts market, it likely represents around 1% given the growing use of various plant-based ingredients.

Within the broader natural remedies market, its share is around 1% to 2%. Its presence in functional foods and nutraceuticals is also limited but growing with an expanding consumer preference for herbal ingredients.

Looking ahead, the market for elecampane root is expected to continue benefiting from government initiatives that promote the consumption of herbal and organic products. Additionally, the growing interest in sustainability and clean-label products will likely drive innovation within the market.

Industry players are focusing on developing new delivery forms, such as capsules and tinctures, to cater to consumer convenience. Moreover, evolving government regulations around the sale of herbal products will play a crucial role in shaping market dynamics, with stricter guidelines potentially influencing product availability.

Elecampane Root Market Analysis by Top Investment Segment

The market is segmented into nature, form, end use, distribution channel, and region. The nature, the market is bifurcated into organic and conventional. In the form, the market is segmented into cut-form, powdered, and liquid.

Based on end-use, the market is classified into beverages, non-alcoholic, alcoholic, foodservice/horeca (hotels, restaurants, cafes), pharmaceuticals, nutraceuticals, animal supplements, personal care & cosmetics, and household/retail.

By distribution channel, the market is divided into B2B/direct, B2C/indirect, supermarket/hypermarket, specialty stores, drug stores, and online retailers. Regionally, the market is classified into North America, Latin America, Europe, East Asia, South Asia, Oceania, the Middle East & Africa.
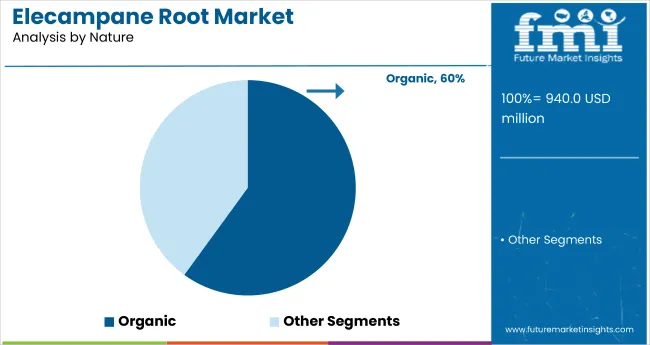
By Nature, the Organic Segment Accounts for 60% of the market Share

Elecampane Root Market Analysis By Nature

The organic segment dominates the market, accounting for an estimated 60% share in 2025, driven by its affordability, widespread availability, and established supply chains. While organic products are gaining traction, conventional offerings continue to appeal to a broader consumer base due to their lower costs and consistent product quality.
  • Preferred for cost-effectiveness and volume scalability.
  • Supported by robust global distribution and procurement networks.
  • Continues to serve major food and beverage manufacturers seeking stable input costs.

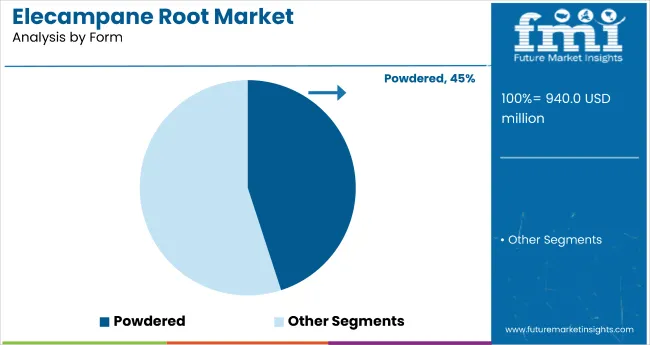
By Form, Powdered Form Accounts for 45% of the Market Share

Elecampane Root Market Analysis By Form

The powdered form will remain the leading segment, driven by strong preference for its easy handling, storage, and versatility in applications such as supplements and food products. Its broad appeal across nutraceuticals, pharmaceuticals, and food & beverage industries makes it particularly lucrative.
  • Powdered products are preferred for their convenience in use.
  • The nutraceutical industry is the biggest consumer of powdered forms.
  • Growing demand for dietary supplements will drive powdered form growth.

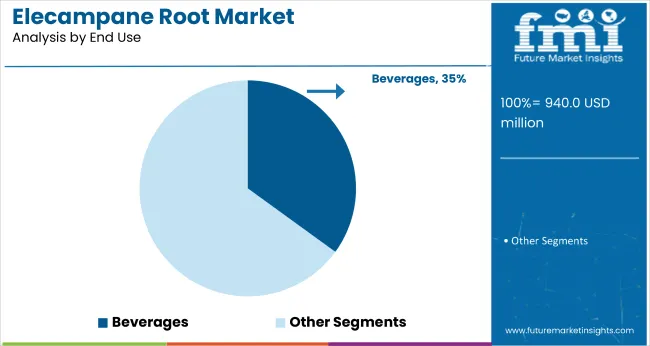
By End Use, the Beverages Segment Accounts for 35% of the Market Share

Elecampane Root Market Analysis By End Use

In the end-use segment, beverages dominate, driven by strong demand across both non-alcoholic and alcoholic categories, including health-oriented drinks, functional beverages, and juices. This segment accounts for 35% of the market share. The foodservice/HoReCa sector also contributes significantly, supported by a growing trend of health-conscious consumers opting for natural and organic ingredients in restaurant and café settings.
  • Non-alcoholic beverages are seeing a growing consumer preference for functional drinks.
  • Health-conscious trends among millennials are boosting demand in this segment.
  • The Foodservice sector continues to be a significant growth driver.

By Distribution Channel, B2B/Direct Sales Account for 50% of the Market Share

Elecampane Root Market Analysis By Distribution Channel

The distribution channel segment is dominated by B2B/direct sales, where manufacturers supply directly to businesses such as retailers, restaurants, and other producers. This segment accounts for 50% of the market share. However, online retailers are rapidly gaining traction, driven by convenience and the expanding reach of e-commerce platforms.

  • B2B/Direct channels are particularly strong in bulk sales to retailers.
  • Online Retailers are seeing exponential growth, especially in the wake of COVID-19.
  • Consumers are increasingly opting for the convenience of online purchases.

Top Elecampane Root Market Dynamics

Recent Trends in the Elecampane Root Market

  • Increasing consumer preference for organic and natural products.
  • Growth in e-commerce and online retail channels for convenience.
  • Rising demand for plant-based and health-oriented food and beverage options.
  • Greater focus on sustainability and clean-label products across industries.

Challenges in the Elecampane Root Market
  • Regulatory hurdles in approving new organic and herbal ingredients.
  • High production costs associated with organic farming and sourcing.
  • Limited awareness in emerging markets about the benefits of certain natural products.
  • Supply chain complexities in sourcing organic and sustainable raw materials.

Analyzing Top Countries Producing, Using and Supplying Elecampane Root

Elecampane Root Market Cagr Analysis By Country

The USA leads with the highest growth, projected at a CAGR of 6.2% from 2025 to 2035, driven by rising demand for natural remedies and herbal supplements. The UK follows with a CAGR of 5.5%, supported by the shift toward plant-based and organic health products. Germany shows steady growth at 5.1% CAGR, fueled by increasing demand for natural remedies and organic certifications.

France has a slightly slower pace at 4.8% CAGR, driven by consumer interest in herbal products and functional foods. Japan grows at the lowest rate of 4.6% CAGR, reflecting strong demand due to traditional herbal medicine and an aging population.

The report covers an in-depth analysis of 40+ countries; five top-performing OECD countries are highlighted below.

USA Elecampane Root Analysis

Revenue from elecampane root in the USA is expected to grow at a CAGR of 6.2% from 2025 to 2035. Demand for natural remedies and herbal supplements continues to rise, driven by increasing consumer awareness of health and wellness. The growing preference for natural respiratory and digestive health products is significantly boosting the market for elecampane root.

  • Strong demand for herbal remedies in the wellness and healthcare sectors.
  • Increase in organic certifications to meet consumer demand.
  • E-commerce platforms are expanding their reach for natural health products.

Elecampane Root Demand Analysis in the UK

The elecampane root market in the UK is anticipated to rise at a CAGR of 5.5% from 2025 to 2035. Growth is supported by a shift toward herbal and natural medicine, particularly in urban areas where consumers are more inclined to adopt alternative wellness solutions. Supportive government regulations promoting the use of organic ingredients are further stimulating market expansion.

  • Growing inclination toward plant-based and organic health products.
  • Increasing support for sustainable agriculture and herbal farming.
  • Expanding interest in health supplements through online and retail distribution.

Germany Elecampane Root Sales Analysis

Sales of elecampane root in Germany are projected to grow at a CAGR of 5.1% from 2025 to 2035. Demand is primarily driven by the country’s focus on holistic health solutions, particularly in natural and organic medicine. Market expansion is further supported by rising consumer preference for organic health supplements and the increasing presence of online retailers.

  • Strong market for natural and herbal remedies in the wellness sector.
  • Growing demand for organic certifications among German consumers.
  • Increased consumer interest in supplements and wellness products online.

Elecampane Root Demand Analysis in France

The French elecampane root market is anticipated to experience a CAGR of 4.8% from 2025 to 2035. The country is witnessing increased preference for natural and herbal health products, particularly in urban regions. Additionally, France’s food and beverage industry plays a significant role by integrating natural herbal ingredients into functional foods.

  • Increased consumer interest in herbal and organic medicinal products.
  • French government policies promote organic farming and sustainable ingredients.
  • Growing availability of herbal supplements in retail and e-commerce outlets.

Japan Elecampane Root Analysis

The elecampane root industry in Japan is estimated to grow at a CAGR of 4.6% from 2025 to 2035. The country's deep-rooted tradition in herbal medicine fuels demand for natural remedies such as elecampane root. With an aging population, there is rising interest in health supplements targeting respiratory and digestive health.
  • Increasing demand for health supplements, especially for aging populations.
  • Strong inclination toward traditional herbal medicine.
  • Growing consumer demand for organic, clean-label products in retail outlets.

Leading Elecampane Root Suppliers and Manufacturers

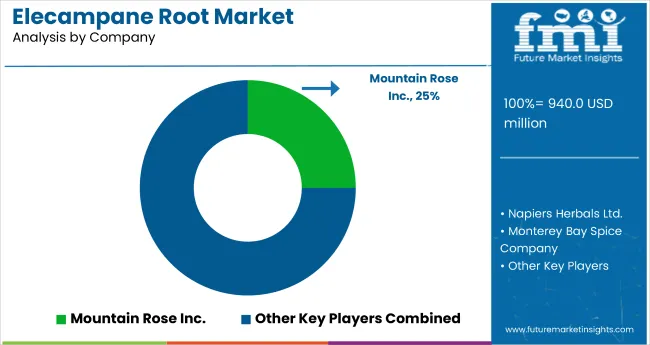
Elecampane Root Market Analysis By Company

The market is moderately fragmented, with key players such as Mountain Rose Inc., Napiers Herbals Ltd., Monterey Bay Spice Company, Starwest Botanicals Inc., Organic Herb Trading Co., and Furnace Creek Farm leading the competition. These companies have established themselves as prominent suppliers of organic and high-quality herbal products.

They compete based on product innovation, sourcing sustainability, and the ability to provide a broad range of organic, natural, and medicinal herbs. Price competition is also a critical factor, with companies focusing on cost-effective sourcing and efficient supply chain management to offer competitive pricing.

Top companies are strategically positioning themselves by forming partnerships with retail and e-commerce platforms to expand their market reach. Additionally, they are investing in R&D to create new product forms and improve formulations, especially focusing on meeting the growing demand for clean-label and organic products. Expansion into emerging markets, particularly in Europe and North America, and increasing online sales through established platforms, further strengthen their competitive positions.

Elecampane Root Market Report Scope

Report Attributes Details
Current Total Market Size (2025) USD 940 million
Projected Market Size (2035) USD 1,590.5 million
CAGR (2025 to 2035) 5.4%
Base Year for Estimation 2024
Historical Period 2020 to 2024
Projections Period 2025 to 2035
Market Analysis Parameters Revenue in USD millions/Volume in kilotons
By Nature Organic, Conventional
By Form Cut-Form, Powdered, Liquid
By End Use Beverages (Non-Alcoholic, Alcoholic), Foodservice/HoReCa, Pharmaceuticals, Nutraceuticals, Animal Supplement, Personal Care & Cosmetics, Household/Retail
By Distribution Channel B2B/Direct, B2C/Indirect, Supermarket/Hypermarket, Specialty Stores, Drug Stores, Online Retailers
Regions Covered North America, Latin America, Europe, East Asia, South Asia, Oceania, Middle East & Africa
Countries Covered United States, Canada, United Kingdom, Germany, France, China, Japan, South Korea, Brazil, Australia
Key Players Mountain Rose Inc., Napiers Herbals Ltd., Monterey Bay Spice Company, Starwest Botanicals Inc., Organic Herb Trading Co., Furnace Creek Farm
Additional Attributes Dollar sales by value, market share analysis by region, and country-wise analysis

Elecampane Root Market by Category

By Nature:

  • Organic
  • Conventional

By Form:

  • Cut-Form
  • Powdered
  • Liquid

By End Use:

  • Beverages
  • Non-Alcoholic
  • Alcoholic
  • Foodservice/ HoReCa (Hotels, Restaurants, Cafes)
  • Pharmaceuticals
  • Nutraceuticals
  • Animal Supplement
  • Personal Care & Cosmetics
  • Household/Retail

By Distribution Channel:

  • B2B/ Direct
  • B2C/ Indirect
  • Supermarket/ Hypermarket
  • Specialty Stores
  • Drug Stores
  • Online Retailers

By Region:

  • North America
  • Latin America
  • Europe
  • East Asia
  • South Asia
  • Oceania
  • Middle East & Africa

Table of Content

  1. Executive Summary
    • Global Market Outlook
    • Demand-side Trends
    • Supply-side Trends
    • Technology Roadmap Analysis
    • Analysis and Recommendations
  2. Market Overview
    • Market Coverage / Taxonomy
    • Market Definition / Scope / Limitations
  3. Market Background
    • Market Dynamics
      • Drivers
      • Restraints
      • Opportunity
      • Trends
    • Scenario Forecast
      • Demand in Optimistic Scenario
      • Demand in Likely Scenario
      • Demand in Conservative Scenario
    • Opportunity Map Analysis
    • Product Life Cycle Analysis
    • Supply Chain Analysis
      • Supply Side Participants and their Roles
        • Producers
        • Mid-Level Participants (Traders/ Agents/ Brokers)
        • Wholesalers and Distributors
      • Value Added and Value Created at Node in the Supply Chain
      • List of Raw Material Suppliers
      • List of Existing and Potential Buyer’s
    • Investment Feasibility Matrix
    • Value Chain Analysis
      • Profit Margin Analysis
      • Wholesalers and Distributors
      • Retailers
    • PESTLE and Porter’s Analysis
    • Regulatory Landscape
      • By Key Regions
      • By Key Countries
    • Regional Parent Market Outlook
    • Production and Consumption Statistics
    • Import and Export Statistics
  4. Global Market Analysis 2020 to 2024 and Forecast, 2025 to 2035
    • Historical Market Size Value (USD Million) & Volume (Kilotons) Analysis, 2020 to 2024
    • Current and Future Market Size Value (USD Million) & Volume (Kilotons) Projections, 2025 to 2035
      • Y-o-Y Growth Trend Analysis
      • Absolute $ Opportunity Analysis
  5. Global Market Pricing Analysis 2020 to 2024 and Forecast 2025 to 2035
  6. Global Market Analysis 2020 to 2024 and Forecast 2025 to 2035, By Nature
    • Introduction / Key Findings
    • Historical Market Size Value (USD Million) & Volume (Kilotons) Analysis By Nature, 2020 to 2024
    • Current and Future Market Size Value (USD Million) & Volume (Kilotons) Analysis and Forecast By Nature, 2025 to 2035
      • Organic
      • Conventional
    • Y-o-Y Growth Trend Analysis By Nature, 2020 to 2024
    • Absolute $ Opportunity Analysis By Nature, 2025 to 2035
  7. Global Market Analysis 2020 to 2024 and Forecast 2025 to 2035, By Form
    • Introduction / Key Findings
    • Historical Market Size Value (USD Million) & Volume (Kilotons) Analysis By Form, 2020 to 2024
    • Current and Future Market Size Value (USD Million) & Volume (Kilotons) Analysis and Forecast By Form, 2025 to 2035
      • Cut-Form
      • Powdered
      • Liquid
    • Y-o-Y Growth Trend Analysis By Form, 2020 to 2024
    • Absolute $ Opportunity Analysis By Form, 2025 to 2035
  8. Global Market Analysis 2020 to 2024 and Forecast 2025 to 2035, By End Use
    • Introduction / Key Findings
    • Historical Market Size Value (USD Million) & Volume (Kilotons) Analysis By End Use, 2020 to 2024
    • Current and Future Market Size Value (USD Million) & Volume (Kilotons) Analysis and Forecast By End Use, 2025 to 2035
      • Beverages
      • Non-Alcoholic
      • Alcoholic
      • Foodservice/ HoReCa (Hotels, Restaurants, Cafes)
      • Pharmaceuticals
      • Nutraceuticals
      • Animal Supplement
      • Personal Care & Cosmetics
      • Household/Retail
    • Y-o-Y Growth Trend Analysis By End Use, 2020 to 2024
    • Absolute $ Opportunity Analysis By End Use, 2025 to 2035
  9. Global Market Analysis 2020 to 2024 and Forecast 2025 to 2035, By Distribution Channel
    • Introduction / Key Findings
    • Historical Market Size Value (USD Million) & Volume (Kilotons) Analysis By Distribution Channel, 2020 to 2024
    • Current and Future Market Size Value (USD Million) & Volume (Kilotons) Analysis and Forecast By Distribution Channel, 2025 to 2035
      • B2B/ Direct
      • B2C/ Indirect
      • Supermarket/ Hypermarket
      • Specialty Stores
      • Drug Stores
      • Online Retailers
    • Y-o-Y Growth Trend Analysis By Distribution Channel, 2020 to 2024
    • Absolute $ Opportunity Analysis By Distribution Channel, 2025 to 2035
  10. Global Market Analysis 2020 to 2024 and Forecast 2025 to 2035, By Region
    • Introduction
    • Historical Market Size Value (USD Million) & Volume (Kilotons) Analysis By Region, 2020 to 2024
    • Current Market Size Value (USD Million) & Volume (Kilotons) Analysis and Forecast By Region, 2025 to 2035
      • North America
      • Latin America
      • Western Europe
      • Eastern Europe
      • East Asia
      • South Asia & Pacific
      • Middle East and Africa
    • Market Attractiveness Analysis By Region
  11. North America Market Analysis 2020 to 2024 and Forecast 2025 to 2035, By Country
    • Historical Market Size Value (USD Million) & Volume (Kilotons) Trend Analysis By Market Taxonomy, 2020 to 2024
    • Market Size Value (USD Million) & Volume (Kilotons) Forecast By Market Taxonomy, 2025 to 2035
      • By Country
        • USA
        • Canada
        • Mexico
      • By Nature
      • By Form
      • By End Use
      • By Distribution Channel
    • Market Attractiveness Analysis
      • By Country
      • By Nature
      • By Form
      • By End Use
      • By Distribution Channel
    • Key Takeaways
  12. Latin America Market Analysis 2020 to 2024 and Forecast 2025 to 2035, By Country
    • Historical Market Size Value (USD Million) & Volume (Kilotons) Trend Analysis By Market Taxonomy, 2020 to 2024
    • Market Size Value (USD Million) & Volume (Kilotons) Forecast By Market Taxonomy, 2025 to 2035
      • By Country
        • Brazil
        • Argentina
        • Rest of LATAM
      • By Nature
      • By Form
      • By End Use
      • By Distribution Channel
    • Market Attractiveness Analysis
      • By Country
      • By Nature
      • By Form
      • By End Use
      • By Distribution Channel
    • Key Takeaways
  13. Western Europe Market Analysis 2020 to 2024 and Forecast 2025 to 2035, By Country
    • Historical Market Size Value (USD Million) & Volume (Kilotons) Trend Analysis By Market Taxonomy, 2020 to 2024
    • Market Size Value (USD Million) & Volume (Kilotons) Forecast By Market Taxonomy, 2025 to 2035
      • By Country
        • Germany
        • Italy
        • France
        • UK
        • Spain
        • BENELUX
        • Nordic
        • Rest of W.Europe
      • By Nature
      • By Form
      • By End Use
      • By Distribution Channel
    • Market Attractiveness Analysis
      • By Country
      • By Nature
      • By Form
      • By End Use
      • By Distribution Channel
    • Key Takeaways
  14. Eastern Europe Market Analysis 2020 to 2024 and Forecast 2025 to 2035, By Country
    • Historical Market Size Value (USD Million) & Volume (Kilotons) Trend Analysis By Market Taxonomy, 2020 to 2024
    • Market Size Value (USD Million) & Volume (Kilotons) Forecast By Market Taxonomy, 2025 to 2035
      • By Country
        • Russia
        • Hungary
        • Poland
        • Balkan & Baltics
        • Rest of E. Europe
      • By Nature
      • By Form
      • By End Use
      • By Distribution Channel
    • Market Attractiveness Analysis
      • By Country
      • By Nature
      • By Form
      • By End Use
      • By Distribution Channel
    • Key Takeaways
  15. East Asia Market Analysis 2020 to 2024 and Forecast 2025 to 2035, By Country
    • Historical Market Size Value (USD Million) & Volume (Kilotons) Trend Analysis By Market Taxonomy, 2020 to 2024
    • Market Size Value (USD Million) & Volume (Kilotons) Forecast By Market Taxonomy, 2025 to 2035
      • By Country
        • China
        • Japan
        • South Korea
      • By Nature
      • By Form
      • By End Use
      • By Distribution Channel
    • Market Attractiveness Analysis
      • By Country
      • By Nature
      • By Form
      • By End Use
      • By Distribution Channel
    • Key Takeaways
  16. South Asia & Pacific Market Analysis 2020 to 2024 and Forecast 2025 to 2035, By Country
    • Historical Market Size Value (USD Million) & Volume (Kilotons) Trend Analysis By Market Taxonomy, 2020 to 2024
    • Market Size Value (USD Million) & Volume (Kilotons) Forecast By Market Taxonomy, 2025 to 2035
      • By Country
        • India
        • Australia & New Zealand
        • ASEAN
        • Rest of SAP
      • By Nature
      • By Form
      • By End Use
      • By Distribution Channel
    • Market Attractiveness Analysis
      • By Country
      • By Nature
      • By Form
      • By End Use
      • By Distribution Channel
    • Key Takeaways
  17. Middle East and Africa Market Analysis 2020 to 2024 and Forecast 2025 to 2035, By Country
    • Historical Market Size Value (USD Million) & Volume (Kilotons) Trend Analysis By Market Taxonomy, 2020 to 2024
    • Market Size Value (USD Million) & Volume (Kilotons) Forecast By Market Taxonomy, 2025 to 2035
      • By Country
        • GCC Countries
        • Northern Africa
        • South Africa
        • Turkiye
        • Rest of MEA
      • By Nature
      • By Form
      • By End Use
      • By Distribution Channel
    • Market Attractiveness Analysis
      • By Country
      • By Nature
      • By Form
      • By End Use
      • By Distribution Channel
    • Key Takeaways
  18. Key Countries Market Analysis
    • USA
      • Pricing Analysis
      • Market Share Analysis, 2024
        • By Nature
        • By Form
        • By End Use
        • By Distribution Channel
    • Canada
      • Pricing Analysis
      • Market Share Analysis, 2024
        • By Nature
        • By Form
        • By End Use
        • By Distribution Channel
    • Brazil
      • Pricing Analysis
      • Market Share Analysis, 2024
        • By Nature
        • By Form
        • By End Use
        • By Distribution Channel
    • Mexico
      • Pricing Analysis
      • Market Share Analysis, 2024
        • By Nature
        • By Form
        • By End Use
        • By Distribution Channel
    • Argentina
      • Pricing Analysis
      • Market Share Analysis, 2024
        • By Nature
        • By Form
        • By End Use
        • By Distribution Channel
  19. Market Structure Analysis
    • Competition Dashboard
    • Competition Benchmarking
    • Market Share Analysis of Top Players
      • By Regional
      • By Nature
      • By Form
      • By End Use
      • By Distribution Channel
  20. Competition Analysis
    • Competition Deep Dive
      • Mountain Rose Inc.
        • Overview
        • Product Portfolio
        • Profitability by Market Segments (Product/Age /Sales Channel/Region)
        • Sales Footprint
        • Strategy Overview
          • Marketing Strategy
          • Product Strategy
          • Channel Strategy
      • Napiers Herbals Ltd.
        • Overview
        • Product Portfolio
        • Profitability by Market Segments (Product/Age /Sales Channel/Region)
        • Sales Footprint
        • Strategy Overview
          • Marketing Strategy
          • Product Strategy
          • Channel Strategy
      • Monterey Bay Spice Company
        • Overview
        • Product Portfolio
        • Profitability by Market Segments (Product/Age /Sales Channel/Region)
        • Sales Footprint
        • Strategy Overview
          • Marketing Strategy
          • Product Strategy
          • Channel Strategy
      • Starwest Botanicals Inc.
        • Overview
        • Product Portfolio
        • Profitability by Market Segments (Product/Age /Sales Channel/Region)
        • Sales Footprint
        • Strategy Overview
          • Marketing Strategy
          • Product Strategy
          • Channel Strategy
      • Organic Herb Trading Co.
        • Overview
        • Product Portfolio
        • Profitability by Market Segments (Product/Age /Sales Channel/Region)
        • Sales Footprint
        • Strategy Overview
          • Marketing Strategy
          • Product Strategy
          • Channel Strategy
      • Furnace Creek Farm
        • Overview
        • Product Portfolio
        • Profitability by Market Segments (Product/Age /Sales Channel/Region)
        • Sales Footprint
        • Strategy Overview
          • Marketing Strategy
          • Product Strategy
          • Channel Strategy
  21. Assumptions & Acronyms Used
  22. Research Methodology

List of Tables

  • Table 1: Global Market Value (USD Million) Forecast by Region, 2020 to 2035
  • Table 2: Global Market Volume (Kilotons) Forecast by Region, 2020 to 2035
  • Table 3: Global Market Value (USD Million) Forecast by Nature, 2020 to 2035
  • Table 4: Global Market Volume (Kilotons) Forecast by Nature, 2020 to 2035
  • Table 5: Global Market Value (USD Million) Forecast by Form, 2020 to 2035
  • Table 6: Global Market Volume (Kilotons) Forecast by Form, 2020 to 2035
  • Table 7: Global Market Value (USD Million) Forecast by End Use, 2020 to 2035
  • Table 8: Global Market Volume (Kilotons) Forecast by End Use, 2020 to 2035
  • Table 9: Global Market Value (USD Million) Forecast by Distribution Channel, 2020 to 2035
  • Table 10: Global Market Volume (Kilotons) Forecast by Distribution Channel, 2020 to 2035
  • Table 11: North America Market Value (USD Million) Forecast by Country, 2020 to 2035
  • Table 12: North America Market Volume (Kilotons) Forecast by Country, 2020 to 2035
  • Table 13: North America Market Value (USD Million) Forecast by Nature, 2020 to 2035
  • Table 14: North America Market Volume (Kilotons) Forecast by Nature, 2020 to 2035
  • Table 15: North America Market Value (USD Million) Forecast by Form, 2020 to 2035
  • Table 16: North America Market Volume (Kilotons) Forecast by Form, 2020 to 2035
  • Table 17: North America Market Value (USD Million) Forecast by End Use, 2020 to 2035
  • Table 18: North America Market Volume (Kilotons) Forecast by End Use, 2020 to 2035
  • Table 19: North America Market Value (USD Million) Forecast by Distribution Channel, 2020 to 2035
  • Table 20: North America Market Volume (Kilotons) Forecast by Distribution Channel, 2020 to 2035
  • Table 21: Latin America Market Value (USD Million) Forecast by Country, 2020 to 2035
  • Table 22: Latin America Market Volume (Kilotons) Forecast by Country, 2020 to 2035
  • Table 23: Latin America Market Value (USD Million) Forecast by Nature, 2020 to 2035
  • Table 24: Latin America Market Volume (Kilotons) Forecast by Nature, 2020 to 2035
  • Table 25: Latin America Market Value (USD Million) Forecast by Form, 2020 to 2035
  • Table 26: Latin America Market Volume (Kilotons) Forecast by Form, 2020 to 2035
  • Table 27: Latin America Market Value (USD Million) Forecast by End Use, 2020 to 2035
  • Table 28: Latin America Market Volume (Kilotons) Forecast by End Use, 2020 to 2035
  • Table 29: Latin America Market Value (USD Million) Forecast by Distribution Channel, 2020 to 2035
  • Table 30: Latin America Market Volume (Kilotons) Forecast by Distribution Channel, 2020 to 2035
  • Table 31: Western Europe Market Value (USD Million) Forecast by Country, 2020 to 2035
  • Table 32: Western Europe Market Volume (Kilotons) Forecast by Country, 2020 to 2035
  • Table 33: Western Europe Market Value (USD Million) Forecast by Nature, 2020 to 2035
  • Table 34: Western Europe Market Volume (Kilotons) Forecast by Nature, 2020 to 2035
  • Table 35: Western Europe Market Value (USD Million) Forecast by Form, 2020 to 2035
  • Table 36: Western Europe Market Volume (Kilotons) Forecast by Form, 2020 to 2035
  • Table 37: Western Europe Market Value (USD Million) Forecast by End Use, 2020 to 2035
  • Table 38: Western Europe Market Volume (Kilotons) Forecast by End Use, 2020 to 2035
  • Table 39: Western Europe Market Value (USD Million) Forecast by Distribution Channel, 2020 to 2035
  • Table 40: Western Europe Market Volume (Kilotons) Forecast by Distribution Channel, 2020 to 2035
  • Table 41: Eastern Europe Market Value (USD Million) Forecast by Country, 2020 to 2035
  • Table 42: Eastern Europe Market Volume (Kilotons) Forecast by Country, 2020 to 2035
  • Table 43: Eastern Europe Market Value (USD Million) Forecast by Nature, 2020 to 2035
  • Table 44: Eastern Europe Market Volume (Kilotons) Forecast by Nature, 2020 to 2035
  • Table 45: Eastern Europe Market Value (USD Million) Forecast by Form, 2020 to 2035
  • Table 46: Eastern Europe Market Volume (Kilotons) Forecast by Form, 2020 to 2035
  • Table 47: Eastern Europe Market Value (USD Million) Forecast by End Use, 2020 to 2035
  • Table 48: Eastern Europe Market Volume (Kilotons) Forecast by End Use, 2020 to 2035
  • Table 49: Eastern Europe Market Value (USD Million) Forecast by Distribution Channel, 2020 to 2035
  • Table 50: Eastern Europe Market Volume (Kilotons) Forecast by Distribution Channel, 2020 to 2035
  • Table 51: East Asia Market Value (USD Million) Forecast by Country, 2020 to 2035
  • Table 52: East Asia Market Volume (Kilotons) Forecast by Country, 2020 to 2035
  • Table 53: East Asia Market Value (USD Million) Forecast by Nature, 2020 to 2035
  • Table 54: East Asia Market Volume (Kilotons) Forecast by Nature, 2020 to 2035
  • Table 55: East Asia Market Value (USD Million) Forecast by Form, 2020 to 2035
  • Table 56: East Asia Market Volume (Kilotons) Forecast by Form, 2020 to 2035
  • Table 57: East Asia Market Value (USD Million) Forecast by End Use, 2020 to 2035
  • Table 58: East Asia Market Volume (Kilotons) Forecast by End Use, 2020 to 2035
  • Table 59: East Asia Market Value (USD Million) Forecast by Distribution Channel, 2020 to 2035
  • Table 60: East Asia Market Volume (Kilotons) Forecast by Distribution Channel, 2020 to 2035
  • Table 61: South Asia & Pacific Market Value (USD Million) Forecast by Country, 2020 to 2035
  • Table 62: South Asia & Pacific Market Volume (Kilotons) Forecast by Country, 2020 to 2035
  • Table 63: South Asia & Pacific Market Value (USD Million) Forecast by Nature, 2020 to 2035
  • Table 64: South Asia & Pacific Market Volume (Kilotons) Forecast by Nature, 2020 to 2035
  • Table 65: South Asia & Pacific Market Value (USD Million) Forecast by Form, 2020 to 2035
  • Table 66: South Asia & Pacific Market Volume (Kilotons) Forecast by Form, 2020 to 2035
  • Table 67: South Asia & Pacific Market Value (USD Million) Forecast by End Use, 2020 to 2035
  • Table 68: South Asia & Pacific Market Volume (Kilotons) Forecast by End Use, 2020 to 2035
  • Table 69: South Asia & Pacific Market Value (USD Million) Forecast by Distribution Channel, 2020 to 2035
  • Table 70: South Asia & Pacific Market Volume (Kilotons) Forecast by Distribution Channel, 2020 to 2035
  • Table 71: Middle East and Africa Market Value (USD Million) Forecast by Country, 2020 to 2035
  • Table 72: Middle East and Africa Market Volume (Kilotons) Forecast by Country, 2020 to 2035
  • Table 73: Middle East and Africa Market Value (USD Million) Forecast by Nature, 2020 to 2035
  • Table 74: Middle East and Africa Market Volume (Kilotons) Forecast by Nature, 2020 to 2035
  • Table 75: Middle East and Africa Market Value (USD Million) Forecast by Form, 2020 to 2035
  • Table 76: Middle East and Africa Market Volume (Kilotons) Forecast by Form, 2020 to 2035
  • Table 77: Middle East and Africa Market Value (USD Million) Forecast by End Use, 2020 to 2035
  • Table 78: Middle East and Africa Market Volume (Kilotons) Forecast by End Use, 2020 to 2035
  • Table 79: Middle East and Africa Market Value (USD Million) Forecast by Distribution Channel, 2020 to 2035
  • Table 80: Middle East and Africa Market Volume (Kilotons) Forecast by Distribution Channel, 2020 to 2035

List of Figures

  • Figure 1: Global Market Volume (Kilotons) Forecast 2020 to 2035
  • Figure 2: Global Market Pricing Analysis
  • Figure 3: Global Market Value (USD Million) Forecast 2020 to 2035
  • Figure 4: Global Market Value Share and BPS Analysis by Nature, 2025 and 2035
  • Figure 5: Global Market Y-o-Y Growth Comparison by Nature, 2025 to 2035
  • Figure 6: Global Market Attractiveness Analysis by Nature
  • Figure 7: Global Market Value Share and BPS Analysis by Form, 2025 and 2035
  • Figure 8: Global Market Y-o-Y Growth Comparison by Form, 2025 to 2035
  • Figure 9: Global Market Attractiveness Analysis by Form
  • Figure 10: Global Market Value Share and BPS Analysis by End Use, 2025 and 2035
  • Figure 11: Global Market Y-o-Y Growth Comparison by End Use, 2025 to 2035
  • Figure 12: Global Market Attractiveness Analysis by End Use
  • Figure 13: Global Market Value Share and BPS Analysis by Distribution Channel, 2025 and 2035
  • Figure 14: Global Market Y-o-Y Growth Comparison by Distribution Channel, 2025 to 2035
  • Figure 15: Global Market Attractiveness Analysis by Distribution Channel
  • Figure 16: Global Market Value (USD Million) Share and BPS Analysis by Region, 2025 and 2035
  • Figure 17: Global Market Y-o-Y Growth Comparison by Region, 2025 to 2035
  • Figure 18: Global Market Attractiveness Analysis by Region
  • Figure 19: North America Market Incremental $ Opportunity, 2025 to 2035
  • Figure 20: Latin America Market Incremental $ Opportunity, 2025 to 2035
  • Figure 21: Western Europe Market Incremental $ Opportunity, 2025 to 2035
  • Figure 22: Eastern Europe Market Incremental $ Opportunity, 2025 to 2035
  • Figure 23: East Asia Market Incremental $ Opportunity, 2025 to 2035
  • Figure 24: South Asia & Pacific Market Incremental $ Opportunity, 2025 to 2035
  • Figure 25: Middle East and Africa Market Incremental $ Opportunity, 2025 to 2035
  • Figure 26: North America Market Value Share and BPS Analysis by Country, 2025 and 2035
  • Figure 27: North America Market Value Share and BPS Analysis by Nature, 2025 and 2035
  • Figure 28: North America Market Y-o-Y Growth Comparison by Nature, 2025 to 2035
  • Figure 29: North America Market Attractiveness Analysis by Nature
  • Figure 30: North America Market Value Share and BPS Analysis by Form, 2025 and 2035
  • Figure 31: North America Market Y-o-Y Growth Comparison by Form, 2025 to 2035
  • Figure 32: North America Market Attractiveness Analysis by Form
  • Figure 33: North America Market Value Share and BPS Analysis by End Use, 2025 and 2035
  • Figure 34: North America Market Y-o-Y Growth Comparison by End Use, 2025 to 2035
  • Figure 35: North America Market Attractiveness Analysis by End Use
  • Figure 36: North America Market Value Share and BPS Analysis by Distribution Channel, 2025 and 2035
  • Figure 37: North America Market Y-o-Y Growth Comparison by Distribution Channel, 2025 to 2035
  • Figure 38: North America Market Attractiveness Analysis by Distribution Channel
  • Figure 39: Latin America Market Value Share and BPS Analysis by Country, 2025 and 2035
  • Figure 40: Latin America Market Value Share and BPS Analysis by Nature, 2025 and 2035
  • Figure 41: Latin America Market Y-o-Y Growth Comparison by Nature, 2025 to 2035
  • Figure 42: Latin America Market Attractiveness Analysis by Nature
  • Figure 43: Latin America Market Value Share and BPS Analysis by Form, 2025 and 2035
  • Figure 44: Latin America Market Y-o-Y Growth Comparison by Form, 2025 to 2035
  • Figure 45: Latin America Market Attractiveness Analysis by Form
  • Figure 46: Latin America Market Value Share and BPS Analysis by End Use, 2025 and 2035
  • Figure 47: Latin America Market Y-o-Y Growth Comparison by End Use, 2025 to 2035
  • Figure 48: Latin America Market Attractiveness Analysis by End Use
  • Figure 49: Latin America Market Value Share and BPS Analysis by Distribution Channel, 2025 and 2035
  • Figure 50: Latin America Market Y-o-Y Growth Comparison by Distribution Channel, 2025 to 2035
  • Figure 51: Latin America Market Attractiveness Analysis by Distribution Channel
  • Figure 52: Western Europe Market Value Share and BPS Analysis by Country, 2025 and 2035
  • Figure 53: Western Europe Market Value Share and BPS Analysis by Nature, 2025 and 2035
  • Figure 54: Western Europe Market Y-o-Y Growth Comparison by Nature, 2025 to 2035
  • Figure 55: Western Europe Market Attractiveness Analysis by Nature
  • Figure 56: Western Europe Market Value Share and BPS Analysis by Form, 2025 and 2035
  • Figure 57: Western Europe Market Y-o-Y Growth Comparison by Form, 2025 to 2035
  • Figure 58: Western Europe Market Attractiveness Analysis by Form
  • Figure 59: Western Europe Market Value Share and BPS Analysis by End Use, 2025 and 2035
  • Figure 60: Western Europe Market Y-o-Y Growth Comparison by End Use, 2025 to 2035
  • Figure 61: Western Europe Market Attractiveness Analysis by End Use
  • Figure 62: Western Europe Market Value Share and BPS Analysis by Distribution Channel, 2025 and 2035
  • Figure 63: Western Europe Market Y-o-Y Growth Comparison by Distribution Channel, 2025 to 2035
  • Figure 64: Western Europe Market Attractiveness Analysis by Distribution Channel
  • Figure 65: Eastern Europe Market Value Share and BPS Analysis by Country, 2025 and 2035
  • Figure 66: Eastern Europe Market Value Share and BPS Analysis by Nature, 2025 and 2035
  • Figure 67: Eastern Europe Market Y-o-Y Growth Comparison by Nature, 2025 to 2035
  • Figure 68: Eastern Europe Market Attractiveness Analysis by Nature
  • Figure 69: Eastern Europe Market Value Share and BPS Analysis by Form, 2025 and 2035
  • Figure 70: Eastern Europe Market Y-o-Y Growth Comparison by Form, 2025 to 2035
  • Figure 71: Eastern Europe Market Attractiveness Analysis by Form
  • Figure 72: Eastern Europe Market Value Share and BPS Analysis by End Use, 2025 and 2035
  • Figure 73: Eastern Europe Market Y-o-Y Growth Comparison by End Use, 2025 to 2035
  • Figure 74: Eastern Europe Market Attractiveness Analysis by End Use
  • Figure 75: Eastern Europe Market Value Share and BPS Analysis by Distribution Channel, 2025 and 2035
  • Figure 76: Eastern Europe Market Y-o-Y Growth Comparison by Distribution Channel, 2025 to 2035
  • Figure 77: Eastern Europe Market Attractiveness Analysis by Distribution Channel
  • Figure 78: East Asia Market Value Share and BPS Analysis by Country, 2025 and 2035
  • Figure 79: East Asia Market Value Share and BPS Analysis by Nature, 2025 and 2035
  • Figure 80: East Asia Market Y-o-Y Growth Comparison by Nature, 2025 to 2035
  • Figure 81: East Asia Market Attractiveness Analysis by Nature
  • Figure 82: East Asia Market Value Share and BPS Analysis by Form, 2025 and 2035
  • Figure 83: East Asia Market Y-o-Y Growth Comparison by Form, 2025 to 2035
  • Figure 84: East Asia Market Attractiveness Analysis by Form
  • Figure 85: East Asia Market Value Share and BPS Analysis by End Use, 2025 and 2035
  • Figure 86: East Asia Market Y-o-Y Growth Comparison by End Use, 2025 to 2035
  • Figure 87: East Asia Market Attractiveness Analysis by End Use
  • Figure 88: East Asia Market Value Share and BPS Analysis by Distribution Channel, 2025 and 2035
  • Figure 89: East Asia Market Y-o-Y Growth Comparison by Distribution Channel, 2025 to 2035
  • Figure 90: East Asia Market Attractiveness Analysis by Distribution Channel
  • Figure 91: South Asia & Pacific Market Value Share and BPS Analysis by Country, 2025 and 2035
  • Figure 92: South Asia & Pacific Market Value Share and BPS Analysis by Nature, 2025 and 2035
  • Figure 93: South Asia & Pacific Market Y-o-Y Growth Comparison by Nature, 2025 to 2035
  • Figure 94: South Asia & Pacific Market Attractiveness Analysis by Nature
  • Figure 95: South Asia & Pacific Market Value Share and BPS Analysis by Form, 2025 and 2035
  • Figure 96: South Asia & Pacific Market Y-o-Y Growth Comparison by Form, 2025 to 2035
  • Figure 97: South Asia & Pacific Market Attractiveness Analysis by Form
  • Figure 98: South Asia & Pacific Market Value Share and BPS Analysis by End Use, 2025 and 2035
  • Figure 99: South Asia & Pacific Market Y-o-Y Growth Comparison by End Use, 2025 to 2035
  • Figure 100: South Asia & Pacific Market Attractiveness Analysis by End Use
  • Figure 101: South Asia & Pacific Market Value Share and BPS Analysis by Distribution Channel, 2025 and 2035
  • Figure 102: South Asia & Pacific Market Y-o-Y Growth Comparison by Distribution Channel, 2025 to 2035
  • Figure 103: South Asia & Pacific Market Attractiveness Analysis by Distribution Channel
  • Figure 104: Middle East and Africa Market Value Share and BPS Analysis by Country, 2025 and 2035
  • Figure 105: Middle East and Africa Market Value Share and BPS Analysis by Nature, 2025 and 2035
  • Figure 106: Middle East and Africa Market Value Share and BPS Analysis by Distribution Channel, 2025 and 2035

Frequently Asked Questions

What is the projected size of the elecampane root market in 2025?

The market size is valued at USD 940 million in 2025.

What is the outlook on elecampane root demand by 2035?

The market is forecasted to reach USD 1,590.5 million by 2035, reflecting a CAGR of 5.4%.

Which form leads the elecampane root market in 2025?

The powdered form is expected to lead the market with a 45% share in 2025.

What is the projected share of the conventional segment in the elecampane root market by 2025?

The conventional segment is projected to hold a 60% market share in 2025.

Which country is projected to have the fastest-growing elecampane root market?

The USA is anticipated to be the fastest-growing market with a CAGR of 6.2% from 2025 to 2035.

Explore Similar Insights

Future Market Insights

Elecampane Root Market