Astragalus Root Extract Market Size and Forecast Outlook 2025 to 2035

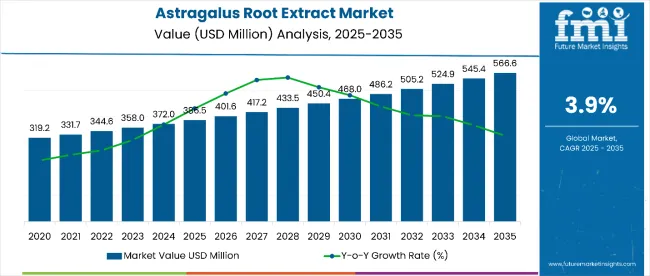
The astragalus root extract market is estimated to be valued at USD 386.5 million in 2025 and is projected to reach USD 566.6 million by 2035, registering a CAGR of 3.9% over the forecast period. The astragalus root extract market is projected to add an absolute dollar opportunity of USD 180.1 million over the forecast period.
Quick Stats for Astragalus Root Extract Market

  • Astragalus Root Extract Market Value (2025): USD 386.5 million
  • Astragalus Root Extract Market Forecast Value (2035): USD 566.6 million
  • Astragalus Root Extract Market Forecast CAGR: 3.9%
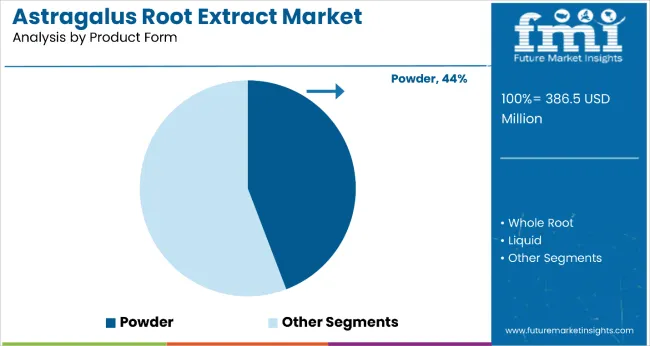
  • Leading Product Form Segment in Astragalus Root Extract Market in 2025: Powder (44%)
  • Key Growth Regions in Astragalus Root Extract Market: Asia-Pacific, Europe, and North America
  • Top Key Players in Astragalus Root Extract Market: Nutragreen Biotechnology Co., Xi'An Sanwei Biotechnology Co., Mountain Rose Herbs.

Astragalus Root Extract Market

Metric Value
Astragalus Root Extract Market Estimated Value in (2025E) USD 386.5 million
Astragalus Root Extract Market Forecast Value in (2035F) USD 566.6 million
Forecast CAGR (2025 to 2035) 3.9%

This reflects a 1.47 times growth at a compound annual growth rate of 3.9%. The market’s evolution is expected to be shaped by rising demand for immune-boosting supplements, traditional medicine acceptance, and growing interest in adaptogenic herbs across pharmaceutical and nutraceutical applications.

By 2030, the market is likely to reach approximately USD 472.4 million, accounting for USD 85.9 million in incremental value over the first half of the decade. The remaining USD 94.2 million is expected during the second half, suggesting a moderately back-loaded growth pattern. Product expansion beyond traditional Chinese medicine applications is gaining traction due to astragalus root’s proven immune-modulating properties and cardiovascular health benefits.

Companies such as Nutragreen Biotechnology Co. and Xi'An Sanwei Biotechnology Co. are advancing their competitive positions through investment in standardized extraction technologies and quality control systems. Certification-led procurement models are supporting expansion into Western pharmaceutical markets, dietary supplement formulations, and functional food applications. Market performance will remain anchored in clinical validation, standardized potency benchmarks, and regulatory compliance frameworks.

The market holds approximately 42% of the traditional herbal extract market, driven by its established immune-enhancing properties and growing acceptance in Western wellness practices. It accounts for around 28% of the adaptogenic supplements market, supported by increasing consumer awareness of stress management and vitality enhancement benefits.

The market contributes nearly 35% to the traditional Chinese medicine extract market, particularly for formulations targeting immune system support and cardiovascular health. It holds close to 24% of the botanical pharmaceutical ingredients market, where standardized astragalus extracts are used for immune modulation and inflammatory response management. The share in the functional food ingredients market reaches about 18%, reflecting its integration into health-focused food and beverage products.

The market is undergoing structural change driven by rising demand for evidence-based natural health solutions and immune system support products. Advanced extraction methods using standardized polysaccharide content and astragaloside IV concentration have enhanced bioavailability, therapeutic efficacy, and quality consistency, making astragalus a viable alternative to synthetic immune modulators. Manufacturers are introducing standardized capsules, liquid extracts, and powder formulations tailored for pharmaceutical and nutraceutical use, expanding their role beyond traditional medicine

Astragalus Root Extract Market by Top Investment Segments

The market is segmented by nature, product form, application, distribution channel, and region. By nature, the market is bifurcated into conventional and organic. Based on product form, the market is classified into powder, whole root, and liquid. In terms of application, the market is divided into food and beverage, personal care, and pharmaceuticals.

By distribution channel, the market is bifurcated into online and offline. Regionally, the market is characterized into North America, Latin America, Asia Pacific, Eastern Europe, Western Europe, and Japan.
By Form, Powder Segment Accounts for 44% of the Market Share

Astragalus Root Extract Market Analysis By Product Form

The powder form segment holds a leading 44% market share in the product form category, driven by its versatility, cost-effective manufacturing, and stability advantages in large-scale supplement production. Powdered astragalus root extract is favored for its standardized potency, extended shelf life, and compatibility with multiple delivery formats including capsules, tablets, and functional foods.

It enables precise dosing in pharmaceutical formulations and is commonly used as a bulk ingredient by nutraceutical manufacturers and health food producers. The segment is benefiting from rising demand for standardized herbal extracts that comply with good manufacturing practices and regulatory requirements.

Manufacturers are expanding powder offerings with certified organic variants, standardized polysaccharide levels, and third-party tested formulations to meet pharmaceutical and consumer supplement market needs. As quality standards tighten and clinical validation becomes more central, the powder format is expected to maintain steady growth and strengthen its position as the preferred ingredient type.
By Application, Food & Beverage Segment Accounts for 47.0% of the Market Share

Astragalus Root Extract Market Analysis By Application

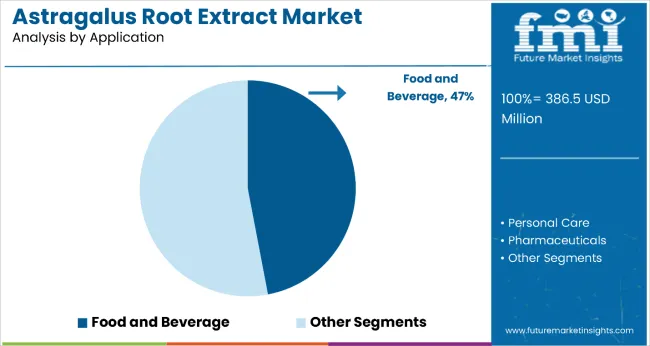
The food and beverage segment dominates the application category with a 47.0% market share in 2025, supported by rising global interest in functional products infused with plant-based ingredients. Astragalus root extract, rich in polysaccharides and flavonoids, is sought after for its immune-supporting, anti-inflammatory, and energy-enhancing benefits, making it a top choice among consumers and manufacturers.

The segment is being propelled by increasing cases of lifestyle-related disorders such as obesity and diabetes, fueling demand for herbal teas, infusions, supplements, and fortified beverages.

Clean-label movement and consumer inclination toward organic nutraceuticals are driving wider adoption of astragalus extract across formulations. In key regions such as Asia-Pacific and North America, innovative product development and functional food retail expansion are expected to keep the food and beverage application at the forefront of market growth.

Why is the Astragalus Root Extract Market Growing?

Astragalus membranaceus roots scientifically validated immune-boosting properties, cardiovascular health benefits, and adaptogenic characteristics make it an attractive ingredient for modern health-conscious consumers seeking natural wellness solutions.

Growing awareness of traditional Chinese medicine principles and preventive healthcare approaches is further propelling adoption, especially among aging populations and individuals with compromised immune systems. Research validating astragalus root’s polysaccharide content and immunomodulatory effects, along with standardized extraction technologies, also enhancing product quality and therapeutic reliability.

As consumer preferences shift toward plant-based health solutions and the global wellness industry expands, the market outlook remains favorable. With increasing integration into mainstream nutraceutical formulations, clinical validation studies, and regulatory acceptance, astragalus root extract is well-positioned to expand across pharmaceutical, dietary supplements, and functional food applications.

What are the Drivers, Restraints, and Key Trends of the Astragalus Root Extract Market?

From 2025 to 2035, immunomodulation research and clinical validation studies are expected to remain central to market expansion, with standardized extracts gaining acceptance in pharmaceutical applications. Advanced extraction technologies ensuring polysaccharide concentration and astragaloside IV standardization became key differentiators. Growing consumer awareness of traditional Chinese medicine principles and preventive healthcare approaches supported sustained demand growth.

Immune System Support Demand Drives Astragalus Market Growth

The rising focus on immune system enhancement and preventive healthcare has been identified as the primary catalyst for growth in the astragalus root extract market. In 2024, increasing consumer awareness of natural immune modulators led to widespread adoption of astragalus-based supplements among health-conscious populations. By 2025, demand was elevated as healthcare practitioners recommended adaptogenic herbs for immune system resilience and stress management applications.

Clinical Validation and Standardization Create Market Opportunities

In 2024, pharmaceutical companies began integrating standardized astragalus root extracts into immune support formulations, supported by clinical trials demonstrating measurable health benefits. By 2025, advanced extraction technologies were being deployed to ensure consistent polysaccharide concentrations and astragaloside IV standardization, enabling pharmaceutical-grade applications. These implementations demonstrate that astragalus root extract can evolve from a traditional medicine ingredient to a validated therapeutic component.
Analysis of Astragalus Root Extract Market by Key Countries

Astragalus Root Extract Market Country Wise Analysis

Country CAGR
China 6.2%
India 5.8%
Germany 5.3%
France 4.9%
UK 4.5%

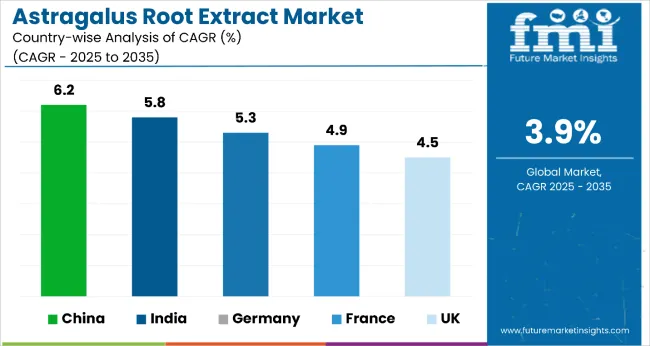
China leads the astragalus root extract market with a CAGR of 6.2%, driven by massive production capacity, government-backed TCM modernization, and GMP-certified exports. India follows with a CAGR of 5.8%, leveraging its Ayurvedic heritage and rapid standardization of extraction processes for export markets.

Germany exhibits a solid 5.3% CAGR, focused on pharmaceutical-grade imports and integration into research-backed health products. France, with a CAGR of 4.9%, is supported by phytotherapy adoption and strict regulatory oversight for botanical supplements. The UK records a CAGR of 4.5%, emphasizing clean-label, vegan, and preventive healthcare solutions.

The report includes an in-depth analysis of 40+ countries; five top-performing OECD countries are highlighted below.

Production Capacity Trends in Astragalus Root Extract Market in China

China astragalus root extract market is projected to grow at a CAGR of 6.2% from 2025 to 2035, outperforming the global average by 1.4%. The growth is linked to established cultivation zones in Inner Mongolia, Gansu, and Heilongjiang provinces. Standardized extraction facilities are widely adopted in pharmaceutical and nutraceutical production for both domestic and international markets.

Output has been expanded by government support for traditional Chinese medicine modernization and export promotion programs. Processed extracts are increasingly replacing raw herb exports to capture higher value-added revenues. More than 60% of production is linked to GMP-certified facilities catering to demand in North America, Europe, and Southeast Asia.

  • 4.2 million kg of standardized astragalus root extract produced in China in 2024
  • 156 GMP-certified extraction facilities operated at full capacity in 2023 to 2024
  • 68% of China's astragalus extract exports certified under international quality standards in 2024

Output Expansion in Astragalus Root Extract Market in India

Astragalus root extract revenue in India is forecast to grow at a CAGR of 5.8% from 2025 to 2035, ahead of the global average by 1.0%. Northern states, particularly Himachal Pradesh and Uttarakhand, have expanded cultivation and processing of astragalus root for both domestic Ayurvedic medicine and international export markets.

Government-backed clusters are supporting standardized extraction capabilities in Gujarat and Maharashtra. Traditional medicine manufacturers have integrated astragalus into immune support formulations to complement indigenous herbs. Export-grade standardized extracts are gaining traction in European and North American markets.

  • 2.1 million kg of astragalus root processed in India during FY 2024
  • 28% year-on-year growth in standardized extract exports between 2023 to 2024
  • 1,240 Ayurvedic formulations incorporated astragalus root extract across eight states in 2024

Market Integration in Astragalus Root Extract Market in Germany

Astragalus root extract demand in Germany is expected to grow at a CAGR of 5.3% from 2025 to 2035, exceeding the global rate by 0.5%. Growth is centered on pharmaceutical integration and standardized supplement applications in cities such as Munich, Berlin, and Hamburg. Standardized astragalus extracts with verified polysaccharide content are being specified for immune support formulations and pharmaceutical research applications.

Import volumes from China and other Asian suppliers have increased, particularly for GMP-certified and organic-certified extracts. Processed products with European pharmacopoeia compliance are favored under strict quality and safety guidelines.

  • 840,000 kg of standardized astragalus root extract imported into Germany in 2024
  • 72% of astragalus extract imports met European pharmacopoeia standards in FY 2024
  • 520 pharmaceutical research projects used standardized astragalus extracts in 2023 to 2024

Demand Analysis for Astragalus Root Extract Market in France

Sales of astragalus root extract in France are projected to grow at a CAGR of 4.9% from 2025 to 2035, making it one of the most dynamic markets for botanical extracts in Europe. The country is witnessing increased consumer preference for organic and natural health supplements, largely due to growing lifestyle-related diseases such as obesity, diabetes, and cardiovascular disorders.

France’s deep-rooted herbal tradition and preference for phytotherapy have created a favorable ecosystem for botanical extracts. Additionally, the strong regulatory backing from ANSES (the French Agency for Food, Environmental and Occupational Health & Safety) ensures product efficacy and safety, enhancing consumer trust.

  • Growing awareness of health and fitness among the population
  • High adoption of botanical-based nutraceuticals and supplements
  • Regulatory emphasis on herbal safety and efficacy standards

Astragalus Root Extract Market UK Market Share Analysis

The UK astragalus root extract market is expected to grow at a CAGR of 4.5% from 2025 to 2035, driven by a health-conscious population and strong demand for herbal remedies. Consumers in the UK are increasingly seeking clean-label, plant-derived ingredients to support holistic well-being and prevent chronic illnesses like Type 2 diabetes and hypertension.

Astragalus extract has gained significant traction as an ingredient in detox teas, sugar-control supplements, and vegan formulations. With growing NHS advocacy for preventive care, the use of botanical extracts in everyday health management has become mainstream. The UK’s supplement market is also supported by a vibrant e-commerce ecosystem that allows herbal brands to reach consumers directly.
  • High demand for natural blood sugar management solutions
  • Use in vegan, clean-label, and allergen-free supplements
  • Strong e-commerce and D2C sales channels

Competitive Landscape of Astragalus Root Extract Market

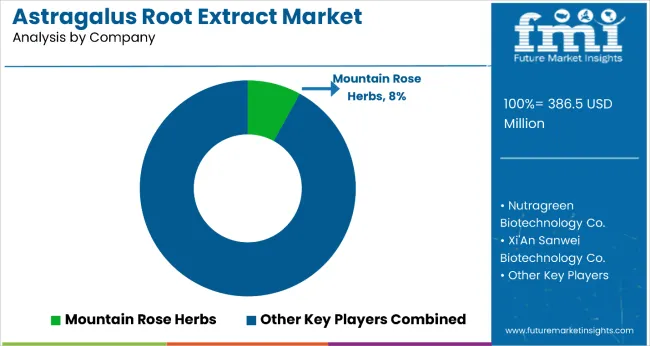
Astragalus Root Extract Market Analysis By Company

The market is moderately fragmented, featuring a mix of traditional Chinese medicine suppliers and Western nutraceutical manufacturers with varying degrees of vertical integration and quality standardization capabilities. Nutragreen Biotechnology Co. and Xi'An Sanwei Biotechnology Co. lead the manufacturing segment, supplying standardized extracts for pharmaceutical and nutraceutical applications. Their strength lies in GMP certification, consistent quality control, and established relationships with international buyers.

Mountain Rose Herbs and Z Natural Foods LLC differentiate through direct-to-consumer sales and organic certification, including retail-ready packaging and consumer education initiatives that cater to health-conscious supplement users. Martin Bauer Group and Naturex focus on pharmaceutical-grade extracts and standardized formulations, addressing the growing demand for clinically validated ingredients in immune support applications.

Regional players such as Health Genesis, Vita Forte Inc., and VidyaHerbs dominate specific geographic markets while maintaining cost efficiency and rapid response capabilities for regional demand. Meanwhile, Diana Group emphasizes research and development in extraction technologies and bioavailability enhancement, creating value in innovation and scientific validation.

Scope of the Report - Astragalus Root Extract Market

Item Value
Quantitative Units USD 386.5 Million
Nature Conventional and Organic
Product Form Powder, Whole Root, and Liquid
Application Food and Beverage, Personal Care, and Pharmaceuticals
Distribution Channel Online and Offline
Regions Covered North America, Europe, Asia-Pacific, Latin America, Middle East & Africa
Country Covered United States, Canada, Germany, France, United Kingdom, China, Japan, India, Brazil, South Africa, Australia, and 40+ countries
Key Companies Profiled Nutragreen Biotechnology Co., Xi'An Sanwei Biotechnology Co., Mountain Rose Herbs, Z Natural Foods LLC, Martin Bauer Group, Naturex, Diana Group, Health Genesis, Vita Forte Inc., and VidyaHerbs
Additional Attributes Dollar sales by product form and application sector, growing usage in immune support and cardiovascular health applications for preventive healthcare, stable demand in traditional medicine and pharmaceutical formulations, innovations in standardized extraction and polysaccharide concentration improve bioavailability, therapeutic efficacy, and regulatory compliance

Key Segments

By Nature:

  • Conventional
  • Organic

By Product Form:

  • Powder
  • Whole Root
  • Liquid

By Application:

  • Food and Beverage
  • Personal Care
  • Pharmaceuticals

By Distribution Channel:

  • Online
  • Offline

By Region:

  • North America
  • Latin America
  • Western Europe
  • Eastern Europe
  • East Asia
  • South Asia & Pacific
  • Middle East and Africa

Table of Content

  1. Executive Summary
    • Global Market Outlook
    • Demand-side Trends
    • Supply-side Trends
    • Technology Roadmap Analysis
    • Analysis and Recommendations
  2. Market Overview
    • Market Coverage / Taxonomy
    • Market Definition / Scope / Limitations
  3. Market Background
    • Market Dynamics
      • Drivers
      • Restraints
      • Opportunity
      • Trends
    • Scenario Forecast
      • Demand in Optimistic Scenario
      • Demand in Likely Scenario
      • Demand in Conservative Scenario
    • Opportunity Map Analysis
    • Product Life Cycle Analysis
    • Supply Chain Analysis
      • Supply Side Participants and their Roles
        • Producers
        • Mid-Level Participants (Traders/ Agents/ Brokers)
        • Wholesalers and Distributors
      • Value Added and Value Created at Node in the Supply Chain
      • List of Raw Material Suppliers
      • List of Existing and Potential Buyer’s
    • Investment Feasibility Matrix
    • Value Chain Analysis
      • Profit Margin Analysis
      • Wholesalers and Distributors
      • Retailers
    • PESTLE and Porter’s Analysis
    • Regulatory Landscape
      • By Key Regions
      • By Key Countries
    • Regional Parent Market Outlook
    • Production and Consumption Statistics
    • Import and Export Statistics
  4. Global Market Analysis 2020 to 2024 and Forecast, 2025 to 2035
    • Historical Market Size Value (USD Million) & Volume (Kilograms) Analysis, 2020 to 2024
    • Current and Future Market Size Value (USD Million) & Volume (Kilograms) Projections, 2025 to 2035
      • Y-o-Y Growth Trend Analysis
      • Absolute $ Opportunity Analysis
  5. Global Market Pricing Analysis 2020 to 2024 and Forecast 2025 to 2035
  6. Global Market Analysis 2020 to 2024 and Forecast 2025 to 2035, By Nature
    • Introduction / Key Findings
    • Historical Market Size Value (USD Million) & Volume (Kilograms) Analysis By Nature, 2020 to 2024
    • Current and Future Market Size Value (USD Million) & Volume (Kilograms) Analysis and Forecast By Nature, 2025 to 2035
      • Conventional
      • Organic
    • Y-o-Y Growth Trend Analysis By Nature, 2020 to 2024
    • Absolute $ Opportunity Analysis By Nature, 2025 to 2035
  7. Global Market Analysis 2020 to 2024 and Forecast 2025 to 2035, By Product Form
    • Introduction / Key Findings
    • Historical Market Size Value (USD Million) & Volume (Kilograms) Analysis By Product Form, 2020 to 2024
    • Current and Future Market Size Value (USD Million) & Volume (Kilograms) Analysis and Forecast By Product Form, 2025 to 2035
      • Powder
      • Whole Root
      • Liquid
    • Y-o-Y Growth Trend Analysis By Product Form, 2020 to 2024
    • Absolute $ Opportunity Analysis By Product Form, 2025 to 2035
  8. Global Market Analysis 2020 to 2024 and Forecast 2025 to 2035, By Application
    • Introduction / Key Findings
    • Historical Market Size Value (USD Million) & Volume (Kilograms) Analysis By Application, 2020 to 2024
    • Current and Future Market Size Value (USD Million) & Volume (Kilograms) Analysis and Forecast By Application, 2025 to 2035
      • Food and Beverage
      • Personal Care
      • Pharmaceuticals
    • Y-o-Y Growth Trend Analysis By Application, 2020 to 2024
    • Absolute $ Opportunity Analysis By Application, 2025 to 2035
  9. Global Market Analysis 2020 to 2024 and Forecast 2025 to 2035, By Distribution Channel
    • Introduction / Key Findings
    • Historical Market Size Value (USD Million) & Volume (Kilograms) Analysis By Distribution Channel, 2020 to 2024
    • Current and Future Market Size Value (USD Million) & Volume (Kilograms) Analysis and Forecast By Distribution Channel, 2025 to 2035
      • Online
      • Offline
    • Y-o-Y Growth Trend Analysis By Distribution Channel, 2020 to 2024
    • Absolute $ Opportunity Analysis By Distribution Channel, 2025 to 2035
  10. Global Market Analysis 2020 to 2024 and Forecast 2025 to 2035, By Region
    • Introduction
    • Historical Market Size Value (USD Million) & Volume (Kilograms) Analysis By Region, 2020 to 2024
    • Current Market Size Value (USD Million) & Volume (Kilograms) Analysis and Forecast By Region, 2025 to 2035
      • North America
      • Latin America
      • Western Europe
      • Eastern Europe
      • East Asia
      • South Asia & Pacific
      • Middle East and Africa
    • Market Attractiveness Analysis By Region
  11. North America Market Analysis 2020 to 2024 and Forecast 2025 to 2035, By Country
    • Historical Market Size Value (USD Million) & Volume (Kilograms) Trend Analysis By Market Taxonomy, 2020 to 2024
    • Market Size Value (USD Million) & Volume (Kilograms) Forecast By Market Taxonomy, 2025 to 2035
      • By Country
        • USA
        • Canada
        • Mexico
      • By Nature
      • By Product Form
      • By Application
      • By Distribution Channel
    • Market Attractiveness Analysis
      • By Country
      • By Nature
      • By Product Form
      • By Application
      • By Distribution Channel
    • Key Takeaways
  12. Latin America Market Analysis 2020 to 2024 and Forecast 2025 to 2035, By Country
    • Historical Market Size Value (USD Million) & Volume (Kilograms) Trend Analysis By Market Taxonomy, 2020 to 2024
    • Market Size Value (USD Million) & Volume (Kilograms) Forecast By Market Taxonomy, 2025 to 2035
      • By Country
        • Brazil
        • Argentina
        • Rest of LATAM
      • By Nature
      • By Product Form
      • By Application
      • By Distribution Channel
    • Market Attractiveness Analysis
      • By Country
      • By Nature
      • By Product Form
      • By Application
      • By Distribution Channel
    • Key Takeaways
  13. Western Europe Market Analysis 2020 to 2024 and Forecast 2025 to 2035, By Country
    • Historical Market Size Value (USD Million) & Volume (Kilograms) Trend Analysis By Market Taxonomy, 2020 to 2024
    • Market Size Value (USD Million) & Volume (Kilograms) Forecast By Market Taxonomy, 2025 to 2035
      • By Country
        • Germany
        • Italy
        • France
        • UK
        • Spain
        • BENELUX
        • Nordic
        • Rest of W.Europe
      • By Nature
      • By Product Form
      • By Application
      • By Distribution Channel
    • Market Attractiveness Analysis
      • By Country
      • By Nature
      • By Product Form
      • By Application
      • By Distribution Channel
    • Key Takeaways
  14. Eastern Europe Market Analysis 2020 to 2024 and Forecast 2025 to 2035, By Country
    • Historical Market Size Value (USD Million) & Volume (Kilograms) Trend Analysis By Market Taxonomy, 2020 to 2024
    • Market Size Value (USD Million) & Volume (Kilograms) Forecast By Market Taxonomy, 2025 to 2035
      • By Country
        • Russia
        • Hungary
        • Poland
        • Balkan & Baltics
        • Rest of E. Europe
      • By Nature
      • By Product Form
      • By Application
      • By Distribution Channel
    • Market Attractiveness Analysis
      • By Country
      • By Nature
      • By Product Form
      • By Application
      • By Distribution Channel
    • Key Takeaways
  15. East Asia Market Analysis 2020 to 2024 and Forecast 2025 to 2035, By Country
    • Historical Market Size Value (USD Million) & Volume (Kilograms) Trend Analysis By Market Taxonomy, 2020 to 2024
    • Market Size Value (USD Million) & Volume (Kilograms) Forecast By Market Taxonomy, 2025 to 2035
      • By Country
        • China
        • Japan
        • South Korea
      • By Nature
      • By Product Form
      • By Application
      • By Distribution Channel
    • Market Attractiveness Analysis
      • By Country
      • By Nature
      • By Product Form
      • By Application
      • By Distribution Channel
    • Key Takeaways
  16. South Asia & Pacific Market Analysis 2020 to 2024 and Forecast 2025 to 2035, By Country
    • Historical Market Size Value (USD Million) & Volume (Kilograms) Trend Analysis By Market Taxonomy, 2020 to 2024
    • Market Size Value (USD Million) & Volume (Kilograms) Forecast By Market Taxonomy, 2025 to 2035
      • By Country
        • India
        • Australia & New Zealand
        • ASEAN
        • Rest of SAP
      • By Nature
      • By Product Form
      • By Application
      • By Distribution Channel
    • Market Attractiveness Analysis
      • By Country
      • By Nature
      • By Product Form
      • By Application
      • By Distribution Channel
    • Key Takeaways
  17. Middle East and Africa Market Analysis 2020 to 2024 and Forecast 2025 to 2035, By Country
    • Historical Market Size Value (USD Million) & Volume (Kilograms) Trend Analysis By Market Taxonomy, 2020 to 2024
    • Market Size Value (USD Million) & Volume (Kilograms) Forecast By Market Taxonomy, 2025 to 2035
      • By Country
        • GCC Countries
        • Northern Africa
        • South Africa
        • Turkiye
        • Rest of MEA
      • By Nature
      • By Product Form
      • By Application
      • By Distribution Channel
    • Market Attractiveness Analysis
      • By Country
      • By Nature
      • By Product Form
      • By Application
      • By Distribution Channel
    • Key Takeaways
  18. Key Countries Market Analysis
    • USA
      • Pricing Analysis
      • Market Share Analysis, 2024
        • By Nature
        • By Product Form
        • By Application
        • By Distribution Channel
    • Canada
      • Pricing Analysis
      • Market Share Analysis, 2024
        • By Nature
        • By Product Form
        • By Application
        • By Distribution Channel
    • Brazil
      • Pricing Analysis
      • Market Share Analysis, 2024
        • By Nature
        • By Product Form
        • By Application
        • By Distribution Channel
    • Mexico
      • Pricing Analysis
      • Market Share Analysis, 2024
        • By Nature
        • By Product Form
        • By Application
        • By Distribution Channel
    • Argentina
      • Pricing Analysis
      • Market Share Analysis, 2024
        • By Nature
        • By Product Form
        • By Application
        • By Distribution Channel
  19. Market Structure Analysis
    • Competition Dashboard
    • Competition Benchmarking
    • Market Share Analysis of Top Players
      • By Regional
      • By Nature
      • By Product Form
      • By Application
      • By Distribution Channel
  20. Competition Analysis
    • Competition Deep Dive
      • Nutragreen Biotechnology Co.
        • Overview
        • Product Portfolio
        • Profitability by Market Segments (Product/Age /Sales Channel/Region)
        • Sales Footprint
        • Strategy Overview
          • Marketing Strategy
          • Product Strategy
          • Channel Strategy
      • Xi'An Sanwei Biotechnology Co.
        • Overview
        • Product Portfolio
        • Profitability by Market Segments (Product/Age /Sales Channel/Region)
        • Sales Footprint
        • Strategy Overview
          • Marketing Strategy
          • Product Strategy
          • Channel Strategy
      • Mountain Rose Herbs
        • Overview
        • Product Portfolio
        • Profitability by Market Segments (Product/Age /Sales Channel/Region)
        • Sales Footprint
        • Strategy Overview
          • Marketing Strategy
          • Product Strategy
          • Channel Strategy
      • Z Natural Foods, LLC
        • Overview
        • Product Portfolio
        • Profitability by Market Segments (Product/Age /Sales Channel/Region)
        • Sales Footprint
        • Strategy Overview
          • Marketing Strategy
          • Product Strategy
          • Channel Strategy
      • NaturaNectar LLC
        • Overview
        • Product Portfolio
        • Profitability by Market Segments (Product/Age /Sales Channel/Region)
        • Sales Footprint
        • Strategy Overview
          • Marketing Strategy
          • Product Strategy
          • Channel Strategy
      • Indena S.p.A.
        • Overview
        • Product Portfolio
        • Profitability by Market Segments (Product/Age /Sales Channel/Region)
        • Sales Footprint
        • Strategy Overview
          • Marketing Strategy
          • Product Strategy
          • Channel Strategy
      • Bio-Botanica Inc.
        • Overview
        • Product Portfolio
        • Profitability by Market Segments (Product/Age /Sales Channel/Region)
        • Sales Footprint
        • Strategy Overview
          • Marketing Strategy
          • Product Strategy
          • Channel Strategy
      • Starwest Botanicals
        • Overview
        • Product Portfolio
        • Profitability by Market Segments (Product/Age /Sales Channel/Region)
        • Sales Footprint
        • Strategy Overview
          • Marketing Strategy
          • Product Strategy
          • Channel Strategy
      • Hunan Huacheng Biotech, Inc.
        • Overview
        • Product Portfolio
        • Profitability by Market Segments (Product/Age /Sales Channel/Region)
        • Sales Footprint
        • Strategy Overview
          • Marketing Strategy
          • Product Strategy
          • Channel Strategy
      • Xi'an Greena Biotech Co., Ltd.
        • Overview
        • Product Portfolio
        • Profitability by Market Segments (Product/Age /Sales Channel/Region)
        • Sales Footprint
        • Strategy Overview
          • Marketing Strategy
          • Product Strategy
          • Channel Strategy
  21. Assumptions & Acronyms Used
  22. Research Methodology

List of Tables

  • Table 1: Global Market Value (USD Million) Forecast by Region, 2020-2035
  • Table 2: Global Market Volume (Kilograms) Forecast by Region, 2020-2035
  • Table 3: Global Market Value (USD Million) Forecast by Nature, 2020-2035
  • Table 4: Global Market Volume (Kilograms) Forecast by Nature, 2020-2035
  • Table 5: Global Market Value (USD Million) Forecast by Product Form, 2020-2035
  • Table 6: Global Market Volume (Kilograms) Forecast by Product Form, 2020-2035
  • Table 7: Global Market Value (USD Million) Forecast by Application, 2020-2035
  • Table 8: Global Market Volume (Kilograms) Forecast by Application, 2020-2035
  • Table 9: Global Market Value (USD Million) Forecast by Distribution Channel, 2020-2035
  • Table 10: Global Market Volume (Kilograms) Forecast by Distribution Channel, 2020-2035
  • Table 11: North America Market Value (USD Million) Forecast by Country, 2020-2035
  • Table 12: North America Market Volume (Kilograms) Forecast by Country, 2020-2035
  • Table 13: North America Market Value (USD Million) Forecast by Nature, 2020-2035
  • Table 14: North America Market Volume (Kilograms) Forecast by Nature, 2020-2035
  • Table 15: North America Market Value (USD Million) Forecast by Product Form, 2020-2035
  • Table 16: North America Market Volume (Kilograms) Forecast by Product Form, 2020-2035
  • Table 17: North America Market Value (USD Million) Forecast by Application, 2020-2035
  • Table 18: North America Market Volume (Kilograms) Forecast by Application, 2020-2035
  • Table 19: North America Market Value (USD Million) Forecast by Distribution Channel, 2020-2035
  • Table 20: North America Market Volume (Kilograms) Forecast by Distribution Channel, 2020-2035
  • Table 21: Latin America Market Value (USD Million) Forecast by Country, 2020-2035
  • Table 22: Latin America Market Volume (Kilograms) Forecast by Country, 2020-2035
  • Table 23: Latin America Market Value (USD Million) Forecast by Nature, 2020-2035
  • Table 24: Latin America Market Volume (Kilograms) Forecast by Nature, 2020-2035
  • Table 25: Latin America Market Value (USD Million) Forecast by Product Form, 2020-2035
  • Table 26: Latin America Market Volume (Kilograms) Forecast by Product Form, 2020-2035
  • Table 27: Latin America Market Value (USD Million) Forecast by Application, 2020-2035
  • Table 28: Latin America Market Volume (Kilograms) Forecast by Application, 2020-2035
  • Table 29: Latin America Market Value (USD Million) Forecast by Distribution Channel, 2020-2035
  • Table 30: Latin America Market Volume (Kilograms) Forecast by Distribution Channel, 2020-2035
  • Table 31: Western Europe Market Value (USD Million) Forecast by Country, 2020-2035
  • Table 32: Western Europe Market Volume (Kilograms) Forecast by Country, 2020-2035
  • Table 33: Western Europe Market Value (USD Million) Forecast by Nature, 2020-2035
  • Table 34: Western Europe Market Volume (Kilograms) Forecast by Nature, 2020-2035
  • Table 35: Western Europe Market Value (USD Million) Forecast by Product Form, 2020-2035
  • Table 36: Western Europe Market Volume (Kilograms) Forecast by Product Form, 2020-2035
  • Table 37: Western Europe Market Value (USD Million) Forecast by Application, 2020-2035
  • Table 38: Western Europe Market Volume (Kilograms) Forecast by Application, 2020-2035
  • Table 39: Western Europe Market Value (USD Million) Forecast by Distribution Channel, 2020-2035
  • Table 40: Western Europe Market Volume (Kilograms) Forecast by Distribution Channel, 2020-2035
  • Table 41: Eastern Europe Market Value (USD Million) Forecast by Country, 2020-2035
  • Table 42: Eastern Europe Market Volume (Kilograms) Forecast by Country, 2020-2035
  • Table 43: Eastern Europe Market Value (USD Million) Forecast by Nature, 2020-2035
  • Table 44: Eastern Europe Market Volume (Kilograms) Forecast by Nature, 2020-2035
  • Table 45: Eastern Europe Market Value (USD Million) Forecast by Product Form, 2020-2035
  • Table 46: Eastern Europe Market Volume (Kilograms) Forecast by Product Form, 2020-2035
  • Table 47: Eastern Europe Market Value (USD Million) Forecast by Application, 2020-2035
  • Table 48: Eastern Europe Market Volume (Kilograms) Forecast by Application, 2020-2035
  • Table 49: Eastern Europe Market Value (USD Million) Forecast by Distribution Channel, 2020-2035
  • Table 50: Eastern Europe Market Volume (Kilograms) Forecast by Distribution Channel, 2020-2035
  • Table 51: East Asia Market Value (USD Million) Forecast by Country, 2020-2035
  • Table 52: East Asia Market Volume (Kilograms) Forecast by Country, 2020-2035
  • Table 53: East Asia Market Value (USD Million) Forecast by Nature, 2020-2035
  • Table 54: East Asia Market Volume (Kilograms) Forecast by Nature, 2020-2035
  • Table 55: East Asia Market Value (USD Million) Forecast by Product Form, 2020-2035
  • Table 56: East Asia Market Volume (Kilograms) Forecast by Product Form, 2020-2035
  • Table 57: East Asia Market Value (USD Million) Forecast by Application, 2020-2035
  • Table 58: East Asia Market Volume (Kilograms) Forecast by Application, 2020-2035
  • Table 59: East Asia Market Value (USD Million) Forecast by Distribution Channel, 2020-2035
  • Table 60: East Asia Market Volume (Kilograms) Forecast by Distribution Channel, 2020-2035
  • Table 61: South Asia & Pacific Market Value (USD Million) Forecast by Country, 2020-2035
  • Table 62: South Asia & Pacific Market Volume (Kilograms) Forecast by Country, 2020-2035
  • Table 63: South Asia & Pacific Market Value (USD Million) Forecast by Nature, 2020-2035
  • Table 64: South Asia & Pacific Market Volume (Kilograms) Forecast by Nature, 2020-2035
  • Table 65: South Asia & Pacific Market Value (USD Million) Forecast by Product Form, 2020-2035
  • Table 66: South Asia & Pacific Market Volume (Kilograms) Forecast by Product Form, 2020-2035
  • Table 67: South Asia & Pacific Market Value (USD Million) Forecast by Application, 2020-2035
  • Table 68: South Asia & Pacific Market Volume (Kilograms) Forecast by Application, 2020-2035
  • Table 69: South Asia & Pacific Market Value (USD Million) Forecast by Distribution Channel, 2020-2035
  • Table 70: South Asia & Pacific Market Volume (Kilograms) Forecast by Distribution Channel, 2020-2035
  • Table 71: Middle East and Africa Market Value (USD Million) Forecast by Country, 2020-2035
  • Table 72: Middle East and Africa Market Volume (Kilograms) Forecast by Country, 2020-2035
  • Table 73: Middle East and Africa Market Value (USD Million) Forecast by Nature, 2020-2035
  • Table 74: Middle East and Africa Market Volume (Kilograms) Forecast by Nature, 2020-2035
  • Table 75: Middle East and Africa Market Value (USD Million) Forecast by Product Form, 2020-2035
  • Table 76: Middle East and Africa Market Volume (Kilograms) Forecast by Product Form, 2020-2035
  • Table 77: Middle East and Africa Market Value (USD Million) Forecast by Application, 2020-2035
  • Table 78: Middle East and Africa Market Volume (Kilograms) Forecast by Application, 2020-2035
  • Table 79: Middle East and Africa Market Value (USD Million) Forecast by Distribution Channel, 2020-2035
  • Table 80: Middle East and Africa Market Volume (Kilograms) Forecast by Distribution Channel, 2020-2035

List of Figures

  • Figure 1: Global Market Volume (Kilograms) Forecast 2020-2035
  • Figure 2: Global Market Pricing Analysis
  • Figure 3: Global Market Value (USD Million) Forecast 2020-2035
  • Figure 4: Global Market Value Share and BPS Analysis by Nature, 2025 and 2035
  • Figure 5: Global Market Y-o-Y Growth Comparison by Nature, 2025-2035
  • Figure 6: Global Market Attractiveness Analysis by Nature
  • Figure 7: Global Market Value Share and BPS Analysis by Product Form, 2025 and 2035
  • Figure 8: Global Market Y-o-Y Growth Comparison by Product Form, 2025-2035
  • Figure 9: Global Market Attractiveness Analysis by Product Form
  • Figure 10: Global Market Value Share and BPS Analysis by Application, 2025 and 2035
  • Figure 11: Global Market Y-o-Y Growth Comparison by Application, 2025-2035
  • Figure 12: Global Market Attractiveness Analysis by Application
  • Figure 13: Global Market Value Share and BPS Analysis by Distribution Channel, 2025 and 2035
  • Figure 14: Global Market Y-o-Y Growth Comparison by Distribution Channel, 2025-2035
  • Figure 15: Global Market Attractiveness Analysis by Distribution Channel
  • Figure 16: Global Market Value (USD Million) Share and BPS Analysis by Region, 2025 and 2035
  • Figure 17: Global Market Y-o-Y Growth Comparison by Region, 2025-2035
  • Figure 18: Global Market Attractiveness Analysis by Region
  • Figure 19: North America Market Incremental $ Opportunity, 2025-2035
  • Figure 20: Latin America Market Incremental $ Opportunity, 2025-2035
  • Figure 21: Western Europe Market Incremental $ Opportunity, 2025-2035
  • Figure 22: Eastern Europe Market Incremental $ Opportunity, 2025-2035
  • Figure 23: East Asia Market Incremental $ Opportunity, 2025-2035
  • Figure 24: South Asia & Pacific Market Incremental $ Opportunity, 2025-2035
  • Figure 25: Middle East and Africa Market Incremental $ Opportunity, 2025-2035
  • Figure 26: North America Market Value Share and BPS Analysis by Country, 2025 and 2035
  • Figure 27: North America Market Value Share and BPS Analysis by Nature, 2025 and 2035
  • Figure 28: North America Market Y-o-Y Growth Comparison by Nature, 2025-2035
  • Figure 29: North America Market Attractiveness Analysis by Nature
  • Figure 30: North America Market Value Share and BPS Analysis by Product Form, 2025 and 2035
  • Figure 31: North America Market Y-o-Y Growth Comparison by Product Form, 2025-2035
  • Figure 32: North America Market Attractiveness Analysis by Product Form
  • Figure 33: North America Market Value Share and BPS Analysis by Application, 2025 and 2035
  • Figure 34: North America Market Y-o-Y Growth Comparison by Application, 2025-2035
  • Figure 35: North America Market Attractiveness Analysis by Application
  • Figure 36: North America Market Value Share and BPS Analysis by Distribution Channel, 2025 and 2035
  • Figure 37: North America Market Y-o-Y Growth Comparison by Distribution Channel, 2025-2035
  • Figure 38: North America Market Attractiveness Analysis by Distribution Channel
  • Figure 39: Latin America Market Value Share and BPS Analysis by Country, 2025 and 2035
  • Figure 40: Latin America Market Value Share and BPS Analysis by Nature, 2025 and 2035
  • Figure 41: Latin America Market Y-o-Y Growth Comparison by Nature, 2025-2035
  • Figure 42: Latin America Market Attractiveness Analysis by Nature
  • Figure 43: Latin America Market Value Share and BPS Analysis by Product Form, 2025 and 2035
  • Figure 44: Latin America Market Y-o-Y Growth Comparison by Product Form, 2025-2035
  • Figure 45: Latin America Market Attractiveness Analysis by Product Form
  • Figure 46: Latin America Market Value Share and BPS Analysis by Application, 2025 and 2035
  • Figure 47: Latin America Market Y-o-Y Growth Comparison by Application, 2025-2035
  • Figure 48: Latin America Market Attractiveness Analysis by Application
  • Figure 49: Latin America Market Value Share and BPS Analysis by Distribution Channel, 2025 and 2035
  • Figure 50: Latin America Market Y-o-Y Growth Comparison by Distribution Channel, 2025-2035
  • Figure 51: Latin America Market Attractiveness Analysis by Distribution Channel
  • Figure 52: Western Europe Market Value Share and BPS Analysis by Country, 2025 and 2035
  • Figure 53: Western Europe Market Value Share and BPS Analysis by Nature, 2025 and 2035
  • Figure 54: Western Europe Market Y-o-Y Growth Comparison by Nature, 2025-2035
  • Figure 55: Western Europe Market Attractiveness Analysis by Nature
  • Figure 56: Western Europe Market Value Share and BPS Analysis by Product Form, 2025 and 2035
  • Figure 57: Western Europe Market Y-o-Y Growth Comparison by Product Form, 2025-2035
  • Figure 58: Western Europe Market Attractiveness Analysis by Product Form
  • Figure 59: Western Europe Market Value Share and BPS Analysis by Application, 2025 and 2035
  • Figure 60: Western Europe Market Y-o-Y Growth Comparison by Application, 2025-2035
  • Figure 61: Western Europe Market Attractiveness Analysis by Application
  • Figure 62: Western Europe Market Value Share and BPS Analysis by Distribution Channel, 2025 and 2035
  • Figure 63: Western Europe Market Y-o-Y Growth Comparison by Distribution Channel, 2025-2035
  • Figure 64: Western Europe Market Attractiveness Analysis by Distribution Channel
  • Figure 65: Eastern Europe Market Value Share and BPS Analysis by Country, 2025 and 2035
  • Figure 66: Eastern Europe Market Value Share and BPS Analysis by Nature, 2025 and 2035
  • Figure 67: Eastern Europe Market Y-o-Y Growth Comparison by Nature, 2025-2035
  • Figure 68: Eastern Europe Market Attractiveness Analysis by Nature
  • Figure 69: Eastern Europe Market Value Share and BPS Analysis by Product Form, 2025 and 2035
  • Figure 70: Eastern Europe Market Y-o-Y Growth Comparison by Product Form, 2025-2035
  • Figure 71: Eastern Europe Market Attractiveness Analysis by Product Form
  • Figure 72: Eastern Europe Market Value Share and BPS Analysis by Application, 2025 and 2035
  • Figure 73: Eastern Europe Market Y-o-Y Growth Comparison by Application, 2025-2035
  • Figure 74: Eastern Europe Market Attractiveness Analysis by Application
  • Figure 75: Eastern Europe Market Value Share and BPS Analysis by Distribution Channel, 2025 and 2035
  • Figure 76: Eastern Europe Market Y-o-Y Growth Comparison by Distribution Channel, 2025-2035
  • Figure 77: Eastern Europe Market Attractiveness Analysis by Distribution Channel
  • Figure 78: East Asia Market Value Share and BPS Analysis by Country, 2025 and 2035
  • Figure 79: East Asia Market Value Share and BPS Analysis by Nature, 2025 and 2035
  • Figure 80: East Asia Market Y-o-Y Growth Comparison by Nature, 2025-2035
  • Figure 81: East Asia Market Attractiveness Analysis by Nature
  • Figure 82: East Asia Market Value Share and BPS Analysis by Product Form, 2025 and 2035
  • Figure 83: East Asia Market Y-o-Y Growth Comparison by Product Form, 2025-2035
  • Figure 84: East Asia Market Attractiveness Analysis by Product Form
  • Figure 85: East Asia Market Value Share and BPS Analysis by Application, 2025 and 2035
  • Figure 86: East Asia Market Y-o-Y Growth Comparison by Application, 2025-2035
  • Figure 87: East Asia Market Attractiveness Analysis by Application
  • Figure 88: East Asia Market Value Share and BPS Analysis by Distribution Channel, 2025 and 2035
  • Figure 89: East Asia Market Y-o-Y Growth Comparison by Distribution Channel, 2025-2035
  • Figure 90: East Asia Market Attractiveness Analysis by Distribution Channel
  • Figure 91: South Asia & Pacific Market Value Share and BPS Analysis by Country, 2025 and 2035
  • Figure 92: South Asia & Pacific Market Value Share and BPS Analysis by Nature, 2025 and 2035
  • Figure 93: South Asia & Pacific Market Y-o-Y Growth Comparison by Nature, 2025-2035
  • Figure 94: South Asia & Pacific Market Attractiveness Analysis by Nature
  • Figure 95: South Asia & Pacific Market Value Share and BPS Analysis by Product Form, 2025 and 2035
  • Figure 96: South Asia & Pacific Market Y-o-Y Growth Comparison by Product Form, 2025-2035
  • Figure 97: South Asia & Pacific Market Attractiveness Analysis by Product Form
  • Figure 98: South Asia & Pacific Market Value Share and BPS Analysis by Application, 2025 and 2035
  • Figure 99: South Asia & Pacific Market Y-o-Y Growth Comparison by Application, 2025-2035
  • Figure 100: South Asia & Pacific Market Attractiveness Analysis by Application
  • Figure 101: South Asia & Pacific Market Value Share and BPS Analysis by Distribution Channel, 2025 and 2035
  • Figure 102: South Asia & Pacific Market Y-o-Y Growth Comparison by Distribution Channel, 2025-2035
  • Figure 103: South Asia & Pacific Market Attractiveness Analysis by Distribution Channel
  • Figure 104: Middle East and Africa Market Value Share and BPS Analysis by Country, 2025 and 2035
  • Figure 105: Middle East and Africa Market Value Share and BPS Analysis by Nature, 2025 and 2035
  • Figure 106: Middle East and Africa Market Y-o-Y Growth Comparison by Nature, 2025-2035
  • Figure 107: Middle East and Africa Market Attractiveness Analysis by Nature
  • Figure 108: Middle East and Africa Market Value Share and BPS Analysis by Product Form, 2025 and 2035
  • Figure 109: Middle East and Africa Market Y-o-Y Growth Comparison by Product Form, 2025-2035
  • Figure 110: Middle East and Africa Market Attractiveness Analysis by Product Form
  • Figure 111: Middle East and Africa Market Value Share and BPS Analysis by Application, 2025 and 2035
  • Figure 112: Middle East and Africa Market Y-o-Y Growth Comparison by Application, 2025-2035
  • Figure 113: Middle East and Africa Market Attractiveness Analysis by Application
  • Figure 114: Middle East and Africa Market Value Share and BPS Analysis by Distribution Channel, 2025 and 2035
  • Figure 115: Middle East and Africa Market Y-o-Y Growth Comparison by Distribution Channel, 2025-2035
  • Figure 116: Middle East and Africa Market Attractiveness Analysis by Distribution Channel
  • Figure 117: Global Market - Tier Structure Analysis
  • Figure 118: Global Market - Company Share Analysis

Frequently Asked Questions

How big is the astragalus root extract market in 2025?

The global astragalus root extract market is estimated to be valued at USD 386.5 million in 2025.

What will be the size of the astragalus root extract market in 2035?

The market size for the astragalus root extract market is projected to reach USD 566.6 million by 2035.

How much will the astragalus root extract market grow between 2025 and 2035?

The astragalus root extract market is expected to grow at a 3.9% CAGR between 2025 and 2035.

Which application segment is expected to contribute a significant share in the astragalus root extract market in 2025?

In terms of application, the food & beverage segment is expected to command a 47% share in the astragalus root extract market in 2025.

Which country is projected to exhibit the highest CAGR in the astragalus root extract market?

China is projected to exhibit the highest CAGR of 6.2% in the astragalus root extract market during the forecast period.

Explore Similar Insights

Future Market Insights

Astragalus Root Extract Market