Global Ginseng Root Extracts Skincare Market Size and Share Forecast Outlook 2025 to 2035

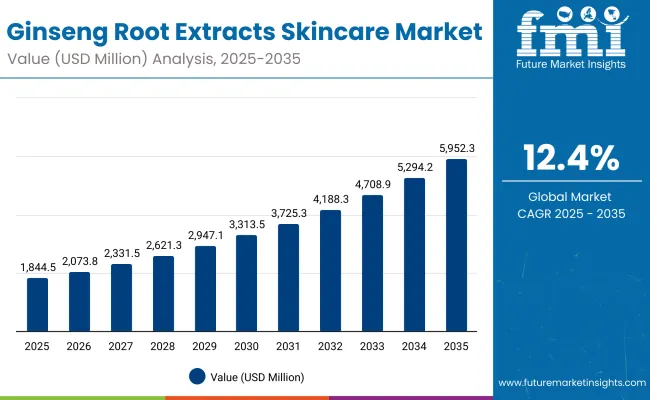
The global ginseng root extracts skincare market is expected to record a valuation of USD 1,844.5 million in 2025 and USD 5,952.3 million in 2035, with an increase of USD 4,107.8 million, which equals a growth of nearly 223% over the decade. The overall expansion represents a CAGR of 12.4% and a 3.2X increase in market size.
Quick Stats for Global Ginseng Root Extracts Skincare Market

  • Global Ginseng Root Extracts Skincare Market Value (2025): USD 1,844.5 million
  • Global Ginseng Root Extracts Skincare Market Forecast Value (2035): USD 5,952.3 million
  • Global Ginseng Root Extracts Skincare Market Forecast CAGR: 12.4%
  • Leading Segment in Global Ginseng Root Extracts Skincare Market in 2025: Anti-aging (53.5%)
  • Key Growth Regions in the Global Ginseng Root Extracts Skincare Market: Asia-Pacific, North America, Europe
  • Top Key Players in Global Ginseng Root Extracts Skincare Market: Sulwhasoo, Innisfree, The Face Shop, Shiseido, Amorepacific, Herbivore Botanicals, Origins, Estée Lauder, Dr. Jart+, Belif

Ginseng Root Extracts Skincare Market

Metric Value
Global Ginseng Root Extracts Skincare Market Estimated Value in (2025E) USD 1,844.5 million
Global Ginseng Root Extracts Skincare Market Forecast Value in (2035F) USD 5,952.3 million
Forecast CAGR (2025 to 2035) 12.4%

During the first five-year period from 2025 to 2030, the market increases from USD 1,844.5 million to USD 3,313.5 million, adding USD 1,469.0 million, which accounts for 36% of the total decade growth. This phase records steady adoption of ginseng-based formulations across anti-aging serums, brightening creams, and skin rejuvenation masks, driven by the need for natural botanical actives. Anti-aging products dominate this period as they cater to over 53% of skincare applications, reflecting ginseng’s proven role in collagen stimulation and wrinkle reduction.

The second half from 2030 to 2035 contributes USD 2,638.8 million, equal to 64% of total growth, as the market jumps from USD 3,313.5 million to USD 5,952.3 million. This acceleration is powered by widespread deployment of clean-label, vegan-certified, and dermatologist-tested skincare lines enriched with ginseng. E-commerce and specialty retail expand significantly, capturing larger channel share by the end of the decade. Software-like enablers in beauty tech, such as AI skin analyzers recommending ginseng products, add recurring value streams, increasing the digital sales share beyond 46% in total value.

From 2020 to 2024, the global ginseng root extracts skincare market grew from an estimated USD 1,120 million to USD 1,740 million, driven by anti-aging and herbal/natural-centric adoption. During this period, the competitive landscape was dominated by Asian beauty brands controlling nearly 65% of revenue, with leaders such as Sulwhasoo, Amorepacific, and Shiseido focusing on premium ginseng serums and creams. Competitive differentiation relied on natural sourcing, K-beauty heritage, and luxury positioning, while dermatologist-tested claims were often bundled as secondary rather than primary value propositions. Vegan and clean-label formats had minimal traction, contributing less than 15% of the total market value.

Demand for ginseng skincare will expand to USD 1,844.5 million in 2025, and the revenue mix will shift as vegan, clean-label, and e-commerce-driven formats grow to over 50% share. Traditional leaders face rising competition from digital-first beauty brands offering AI-powered personalization, subscription-based refills, and eco-conscious ginseng formulations. Major brands are pivoting to hybrid models, integrating beauty tech with herbal actives to retain relevance. Emerging entrants specializing in vegan certification, sustainability, and wellness-driven positioning are gaining share. The competitive advantage is moving away from traditional herbal branding alone to ecosystem strength, omni-channel reach, and digital consumer engagement.

Why the Global Ginseng Root Extracts Skincare Market is growing?

Advances in herbal formulation science have improved efficacy and stability of ginseng extracts, allowing for more potent anti-aging and rejuvenating benefits across diverse skincare applications. Anti-aging has gained popularity due to its suitability for addressing wrinkles, fine lines, and dullness, supported by clinical evidence of ginseng’s collagen-boosting properties. The rise of herbal and natural claims has contributed to enhanced consumer trust and premium positioning in global skincare. Industries such as luxury beauty, derma-cosmetics, and mass retail skincare are driving demand for ginseng-based products that can integrate seamlessly into daily beauty routines.

Expansion of clean-label beauty and wellness-driven formulations has fueled market growth. Innovations in serums, masks, and AI-personalized beauty devices recommending ginseng products are expected to open new application areas. Segment growth is expected to be led by anti-aging function, serums in product type, herbal/natural in claims, and e-commerce in channels due to their precision positioning, consumer trust, and adaptability across regions.

Segmental Analysis

The market is segmented by function, product type, channel, claim, and region. Functions include anti-aging, brightening, anti-fatigue/energizing, and skin rejuvenation, highlighting the core benefits driving adoption. Product type classification covers serums, creams/lotions, masks, and toners to cater to different skincare regimes. Based on channel, the segmentation includes e-commerce, pharmacies, specialty beauty stores, and mass retail. In terms of claims, categories encompass herbal/natural, clean-label, vegan, and dermatologist-tested. Regionally, the scope spans North America, Europe, Asia-Pacific, Latin America, and the Middle East & Africa.
Insights into the Function Segment with Anti-aging Leading in Market Share

Ginseng Root Extracts Skincare Market By Function

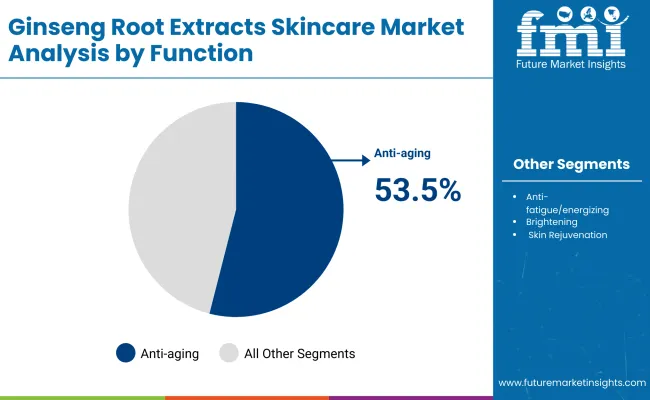
Function Segment Market Value Share, 2025
Anti-aging 53.5%
Others 46.5%

The anti-aging segment is projected to contribute 53.5% of the global ginseng root extracts skincare market revenue in 2025, maintaining its lead as the dominant function category. This is driven by ongoing demand for ginseng’s proven anti-aging properties such as wrinkle reduction, enhanced elasticity, and improved skin tone. Anti-aging investments are prioritized by consumers seeking high-efficacy formulations in serums and creams that deliver visible results.

The segment’s growth is also supported by the integration of ginseng with other antioxidants such as vitamin C and hyaluronic acid, which enhance synergy. As premium and luxury skincare continue to expand in Asia, the USA, and Europe, the anti-aging segment is expected to retain its position as the backbone of ginseng skincare demand.
Insights into the Channel Segment with E-commerce Emerging as a Core Growth Driver

Ginseng Root Extracts Skincare Market By Channel

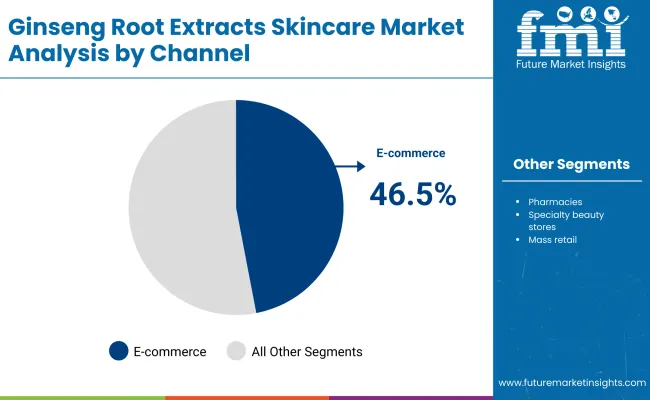
Channel Segment Market Value Share, 2025
E-commerce 46.5%
Others 53.5%

The e-commerce segment, valued at USD 837.5 million in 2025, is projected to account for 46.5% of the global ginseng root extracts skincare market, positioning it as one of the fastest-growing distribution channels. Its strong performance is attributed to the rising penetration of cross-border e-commerce platforms such as Tmall Global, JD.com, Amazon, and Shopee, which have made ginseng-based serums, masks, and creams widely accessible across both developed and emerging markets. Social media marketing and live-stream shopping events in China and Southeast Asia are particularly effective in boosting sales of ginseng skincare, often creating viral demand during seasonal campaigns.

Consumer preference for personalized shopping experiences online has also been a catalyst. Beauty-tech apps that recommend skincare routines featuring ginseng serums or rejuvenating creams are increasing conversion rates. Subscription-based D2C (direct-to-consumer) models offering monthly ginseng skincare boxes further accelerate digital adoption, particularly among millennials and Gen Z consumers. While offline channels such as specialty beauty stores and pharmacies still lead slightly with 53.5% share (USD 986.3 million), the e-commerce segment’s agility, promotional campaigns, and global reach make it a core driver of future growth, with its share expected to surpass offline channels by the early 2030s.
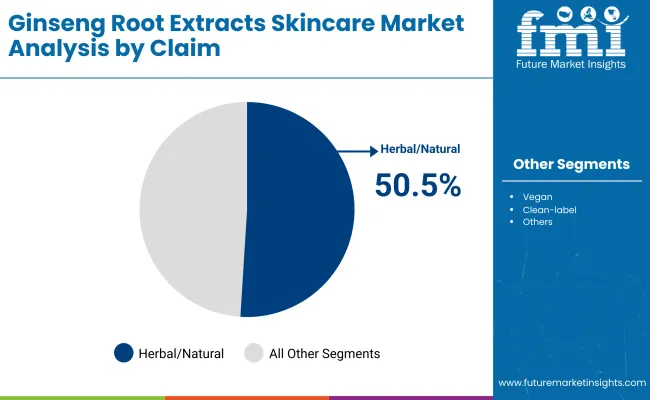
Insights into the Claim Segment with Herbal/Natural Leading in Market Share

Ginseng Root Extracts Skincare Market By Claim

Claim Segment Market Value Share, 2025
Herbal/Natural 50.5%
Others 49.5%

The herbal/natural claim segment is projected to account for 50.5% of the global ginseng root extracts skincare market revenue in 2025, establishing it as the leading claim type. This category is preferred for its ability to align with consumer trust in botanical skincare, tapping into rising demand for clean beauty.

Its suitability for both luxury and mass-market products, along with its strong presence in Asia-Pacific markets like China, South Korea, and Japan, has made it dominant. Developments in sustainable sourcing and eco-friendly packaging further boost the natural positioning of ginseng products. Given its balance of authenticity and modern consumer demand, herbal/natural claims are expected to maintain their leading role in the global ginseng skincare market.

What are the Drivers, Restraints, and Key Trends of the Global Ginseng Root Extracts Skincare Market?

Drivers

Rising Clinical Validation of Ginsenosides in Dermatology

One of the strongest drivers in the global ginseng root extracts skincare market is the growing body of clinical studies validating ginsenosides (the active compounds in ginseng) for skincare benefits. Unlike many botanical extracts that rely heavily on traditional knowledge or anecdotal benefits, ginseng has increasingly been backed by peer-reviewed studies showing measurable improvements in skin elasticity, wrinkle reduction, hydration, and brightening. Dermatology clinics in Asia, particularly in South Korea and China, have begun incorporating ginseng extracts into cosmeceutical formulations prescribed alongside standard anti-aging regimens. This clinical credibility has elevated ginseng from a heritage herb into a scientifically endorsed ingredient, positioning it favorably against competitors like retinol or peptides. The result is stronger adoption in both premium skincare brands and dermatologist-tested claims, driving demand globally.

PremiumizationThrough K-Beauty and East Asian Heritage Branding

The second major driver is the premiumization of ginseng-based skincare, propelled by K-beauty exports and East Asian heritage branding. Brands like Sulwhasoo and Amorepacific have successfully marketed ginseng as a luxury anti-aging solution that blends traditional wisdom with modern science. This has created aspirational demand in Western markets such as the USA and Europe, where consumers associate ginseng with holistic wellness and authenticity. Furthermore, in China, ginseng skincare products are perceived as not only beauty enhancers but also cultural extensions of Traditional Chinese Medicine (TCM). This dual appeal luxury in the West and cultural trust in Asia is a unique driver that sustains higher price points, repeat purchases, and consumer loyalty.

Restraints

High Cost of Extraction and Standardization

A key restraint is the high cost associated with extracting and standardizing ginseng root extracts. Unlike synthetic actives, ginseng requires complex processing to ensure consistent concentration of ginsenosides. This leads to variability in product efficacy, which in turn affects brand reputation if results are inconsistent. The costs of cultivation, aging (many brands highlight “6-year-old red ginseng”), and sustainable farming practices add to the expense. Smaller brands often struggle to compete with large players that control vertical integration of sourcing and extraction. This price barrier restricts penetration in mass retail channels, making ginseng skincare more concentrated in premium and specialty categories, and limiting adoption among price-sensitive consumers.

Regulatory and Labeling Challenges in Western Markets

Another restraint lies in the regulatory complexity of positioning ginseng skincare products in Western markets. In the USA and EU, botanical actives often fall into a grey area between cosmetic claims and therapeutic claims. This forces brands to either understate potential benefits (reducing marketing appeal) or risk scrutiny from regulatory agencies. For example, anti-fatigue or energizing claims based on herbal positioning are often challenged unless supported by robust data. In addition, “herbal/natural” and “clean-label” claims are under increasing regulatory oversight to prevent greenwashing. These hurdles slow down market entry and innovation pipelines in North America and Europe compared to Asia-Pacific, where herbal cosmetics enjoy cultural and regulatory acceptance.

Key Trends

Integration of Ginseng Extracts with Next-Gen Delivery Systems

A major trend shaping the market is the integration of ginseng root extracts with advanced delivery technologies, such as liposomal encapsulation, nanoemulsions, and hydrogel masks. These systems enhance the bioavailability of ginsenosides, ensuring deeper skin penetration and longer-lasting effects. Brands are moving beyond traditional creams and serums to 3D-printed masks, AI-personalized patches, and bio-cellulose sheets infused with ginseng. This innovation is particularly strong in Asia-Pacific and is increasingly being adopted in premium USA and European product lines. The trend positions ginseng not just as a heritage ingredient but as a tech-enabled active, bridging tradition and biotechnology.

E-commerce Acceleration Through Storytelling and Cross-Border Platforms

The second trend is the explosive growth of ginseng skincare sales via e-commerce and cross-border retail platforms. Digital-native consumers are drawn to the storytelling aspect luxury brands narrate centuries-old ginseng heritage while digital-first startups emphasize vegan, sustainable sourcing. Platforms like Tmall (China), Amazon (USA), and Shopee (Southeast Asia) have become critical in educating consumers and scaling niche ginseng brands globally. Live-stream shopping, social commerce, and influencer-led campaigns are amplifying ginseng’s reach. This trend ensures that even niche claims such as “energizing/anti-fatigue” or “dermatologist-tested” gain traction through direct-to-consumer online strategies, reinforcing e-commerce as the fastest growing channel in the ginseng skincare ecosystem.
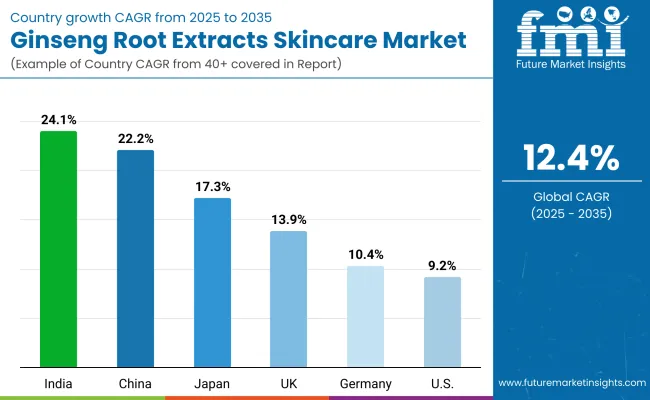
Analysis of Global Ginseng Root Extracts Skincare Market By Key Countries

Country Wise Ginseng Root Extracts Skincare Market

Countries Estimated CAGR (2025 to 2035)
China 22.2%
USA 9.2%
India 24.1%
UK 13.9%
Germany 10.4%
Japan 17.3%

The country-wise growth outlook for the global ginseng root extracts skincare market (2025 to 2035) highlights strong regional disparities shaped by cultural preferences, consumer spending power, and adoption of herbal actives. India (24.1% CAGR) and China (22.2% CAGR) are projected to record the fastest growth, fueled by a deep-rooted cultural association with herbal medicine and rapid consumer upgrading to premium skincare formats. In China, ginseng is strongly linked to Traditional Chinese Medicine (TCM), which drives both domestic demand and premium positioning across e-commerce platforms. Meanwhile, India’s young consumer base and preference for natural, ayurvedic-inspired beauty products are creating fertile ground for ginseng adoption, especially within serums and brightening creams that align with local skincare routines. Both markets benefit from rising disposable incomes, expanding online retail, and the growing influence of K-beauty, which positions ginseng as both authentic and aspirational.

Mature markets such as the USA (9.2% CAGR), Germany (10.4% CAGR), and the UK (13.9% CAGR) will grow at slower yet steady rates, driven primarily by anti-aging and dermatologist-tested claims. In these regions, ginseng is perceived less as a cultural herb and more as a scientifically validated premium ingredient, making it attractive in luxury and clean-label formulations. The USA market remains the largest in terms of absolute size, but its CAGR reflects saturation and competitive overlap with other actives like retinol, niacinamide, and peptides. In contrast, Japan (17.3% CAGR) shows a unique dual growth path, combining local demand for traditional herbal actives with a highly sophisticated skincare culture focused on innovation, layering, and hybrid formats like essences and toners. Collectively, these differences illustrate how Asia-Pacific (China, India, Japan) will lead the acceleration of ginseng skincare globally, while North America and Europe will maintain steady but more selective adoption patterns.
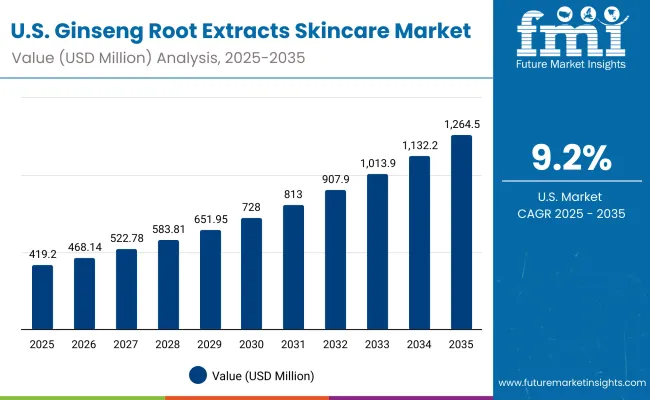
Sales Outlook for Ginseng Root Extracts Skincare in the United States

Usa Ginseng Root Extracts Skincare Market

Year USA Ginseng Root Extracts Skincare Market (USD Million)
2025 419.2
2026 468.1
2027 522.8
2028 583.8
2029 652.0
2030 728.1
2031 813.0
2032 907.9
2033 1,013.9
2034 1,132.3
2035 1,264.5

The global ginseng root extracts skincare market in the United States is projected to grow at a CAGR of 9.2%, led by strong consumer adoption of anti-aging and dermatologist-tested claims. Premium serums and creams dominate demand, with USA consumers willing to pay higher prices for clinically validated results. E-commerce platforms and specialty retailers are key growth drivers, as clean-label and vegan-certified ginseng lines appeal to wellness-oriented buyers. Dermatology clinics and medical spas are also integrating ginseng formulations into cosmeceutical treatments, reinforcing credibility. Rising awareness of botanical actives, supported by digital campaigns from K-beauty brands, is boosting penetration across both luxury and mass markets.

  • Anti-aging serums and creams dominate USA demand, capturing the largest functional share.
  • Dermatologist-tested positioning strengthens consumer trust in clinical-grade formulations.
  • Specialty beauty stores and e-commerce channels drive premium ginseng adoption.

Growth and Expansion Outlook for Ginseng Root Extracts Skincare in the United Kingdom

The global ginseng root extracts skincare market in the United Kingdom is expected to grow at a CAGR of 13.9%, supported by clean-label positioning, heritage-inspired branding, and luxury skincare uptake. British consumers are increasingly adopting premium ginseng serums and masks, marketed as natural yet scientifically advanced solutions. The luxury beauty retail landscape, including department stores and boutique skincare chains, has fueled visibility for Asian-origin brands. Meanwhile, heritage-inspired botanical positioning resonates with eco-conscious buyers, aligning with UK consumer preference for sustainable and transparent skincare. Digital marketing campaigns, especially influencer-led narratives emphasizing rejuvenation and brightening, are accelerating market growth.

  • Premium retailers are expanding shelf space for ginseng-infused serums and toners.
  • Consumers are drawn to clean-label and vegan-certified ginseng formulations.
  • Luxury skincare branding strengthens market adoption among middle- and upper-income groups.

Growth and Expansion Outlook for Ginseng Root Extracts Skincare in India

India is witnessing rapid growth in the global ginseng root extracts skincare market, which is forecast to expand at a CAGR of 24.1% through 2035. Rising awareness of K-beauty-inspired regimens and ayurvedic alignment of ginseng as a botanical active are key drivers. Indian millennials and Gen Z consumers are driving demand for brightening and rejuvenating claims, supported by growing social media influence and e-commerce penetration. Local skincare brands are beginning to blend ginseng with ayurvedic and herbal actives, positioning it as both global and culturally relatable. Adoption in tier-2 and tier-3 cities is expanding as affordability improves, aided by D2C beauty startups and online-first distribution.

  • E-commerce platforms dominate entry points for ginseng skincare among Indian consumers.
  • Brightening and rejuvenating claims align with local beauty preferences.
  • Cross-over positioning with ayurvedic wellness builds trust in ginseng formulations.

Sales Outlook for Ginseng Root Extracts Skincare in China

The global ginseng root extracts skincare market in China is expected to grow at a CAGR of 22.2%, the second highest among leading economies after India. This momentum is driven by cultural association with Traditional Chinese Medicine (TCM), where ginseng is perceived as both a medicinal herb and a premium beauty active. The luxury segment is dominated by Amorepacific and Sulwhasoo, which position ginseng as a prestige anti-aging ingredient. At the same time, mass-market adoption is expanding through cross-border e-commerce platforms like Tmall and JD.com, making ginseng products accessible to younger consumers. Affordable ginseng masks and toners are gaining traction, while premium anti-aging serums remain aspirational.

  • TCM heritage strengthens cultural credibility for ginseng skincare in China.
  • Premium anti-aging lines dominate urban luxury markets, while masks fuel mass-market growth.
  • Cross-border e-commerce platforms drive rapid brand visibility and adoption.
Countries 2025 Share (%)
USA 22.7%
China 12.1%
Japan 7.1%
Germany 15.7%
UK 8.6%
India 5.4%
Countries 2035 Share (%)
USA 21.2%
China 13.2%
Japan 10.1%
Germany 13.7%
UK 7.4%
India 6.1%

Opportunity Analysis of United States Ginseng Root Extracts Skincare Market

Usa Ginseng Root Extracts Skincare Market By Function

Function Segment Market Value Share, 2025
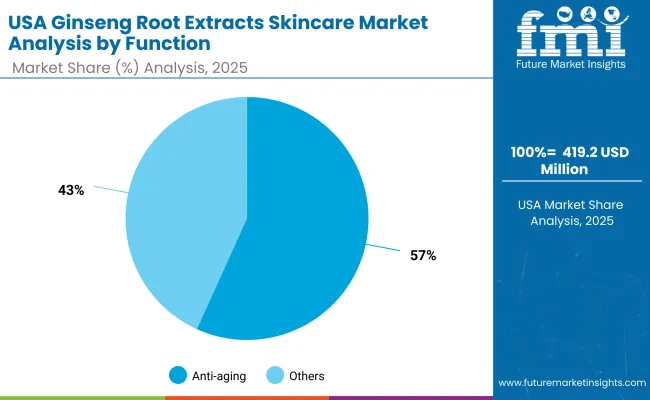
Anti-aging 56.8%
Others 43.2%

The global ginseng root extracts skincare market in the United States is valued at USD 419.2 million in 2025, with anti-aging leading at 56.8%, followed by other functions at 43.2%. The dominance of anti-aging products is a direct outcome of the USA consumer base prioritizing visible skin health benefits such as wrinkle reduction, elasticity restoration, and collagen stimulation. This segment thrives particularly in serums and creams, where consumers expect high efficacy supported by dermatologist-tested claims.

Portability in packaging, personalization through AI-driven beauty apps, and clinical-grade branding further enhance adoption, allowing ginseng-based anti-aging products to penetrate both luxury beauty chains and online channels. This advantage positions anti-aging as an essential category in premium skincare routines across urban markets. Other function categories like brightening and rejuvenation remain smaller, though they are gaining traction among younger demographics. With an increasing focus on wellness and clean-label claims, AI-personalized beauty routines integrated with ginseng extracts are expected to expand adoption in the next decade.
  • Market size for United States in 2025 is USD 419.2 million
  • Global market share is approximately 22.7%
  • Anti-aging leads at 56.8% due to clinical validation and consumer demand for visible results

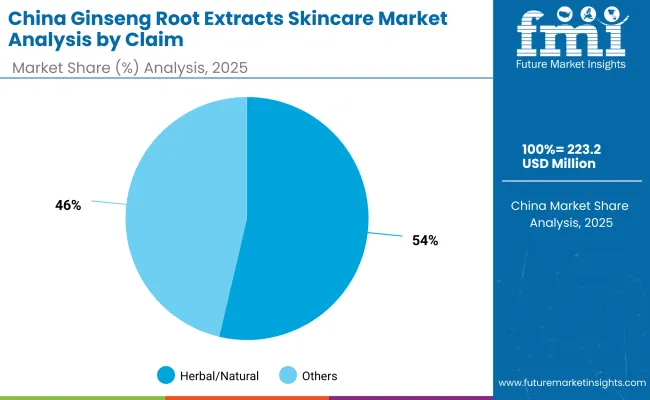
Opportunity Analysis of China Ginseng Root Extracts Skincare Market

China Ginseng Root Extracts Skincare Market By Claim

Claim Segment Market Value Share, 2025
Herbal/Natural 53.7%
Others 46.3%

The global ginseng root extracts skincare market in China is valued at USD 223.2 million in 2025 (based on 12.1% global share), with herbal/natural claims leading at 53.7%, followed by others at 46.3%. The dominance of herbal/natural positioning is a direct outcome of China’s deep cultural connection to Traditional Chinese Medicine (TCM), where ginseng is regarded as both a health and beauty enhancer. Consumers trust ginseng-infused products due to centuries-old familiarity, making them particularly receptive to herbal-branded skincare lines.

Cross-border e-commerce platforms such as Tmall Global and JD.com have amplified availability of both premium K-beauty ginseng brands (e.g., Sulwhasoo, Amorepacific) and local entrants. Younger demographics are adopting ginseng sheet masks, brightening toners, and rejuvenating creams marketed as daily-use herbal essentials. The affordability of mass-market offerings combined with premium anti-aging luxury lines creates a dual growth path across consumer segments. With digital storytelling, influencer-driven campaigns, and heritage-based narratives, herbal/natural positioning is expected to dominate China’s ginseng skincare market through 2035.
  • Market size for China in 2025 is USD 223.2 million
  • Global market share is approximately 12.1%
  • Herbal/natural leads at 53.7% due to strong cultural trust in TCM beauty

Competitive Landscape of Global Ginseng Root Extracts Skincare Market

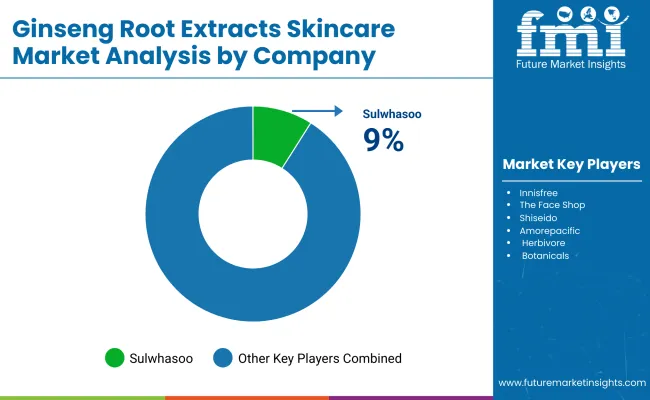
Ginseng Root Extracts Skincare Market By Company

Company Global Value Share 2025
Sulwhasoo 9.0%
Others 91.0%

The global ginseng root extracts skincare market is moderately fragmented, with K-beauty giants, multinational conglomerates, and niche botanical specialists competing across diverse application areas. Global leaders such as Sulwhasoo, Amorepacific, and Shiseido hold significant share, driven by their premium positioning, luxury branding, and integration of ginseng into anti-aging lines. Their strategies emphasize luxury heritage storytelling, cross-border e-commerce penetration, and dermatologist-tested claims targeting high-income consumers.

Established multinational players like Estée Lauder, Origins, and Dr. Jart+ are focusing on hybrid clean-label and clinical positioning, expanding ginseng’s appeal beyond Asia into North America and Europe. These companies leverage strong distribution in specialty beauty stores, pharmacies, and online platforms, ensuring both mass visibility and premium presence.

Specialized botanical brands such as Herbivore Botanicals, Belif, and The Face Shop focus on natural, vegan, and sustainable skincare narratives, making them relevant for younger demographics that prioritize clean-label beauty. Their strength lies in customization, niche digital marketing, and regional adaptability rather than scale. Competitive differentiation is shifting away from ginseng as a single hero ingredient toward ecosystem-driven skincare solutions, where brands integrate ginseng with other actives (vitamin C, niacinamide, hyaluronic acid) and deliver via advanced formats like serums, sheet masks, and AI-personalized routines. Subscription-based D2C sales, influencer-led campaigns, and eco-conscious packaging are increasingly central to competitive positioning.

Key Developments in Global Ginseng Root Extracts Skincare Market

  • On March 12, 2024, Sulwhasoo expanded its flagship ginseng anti-aging line in the USA with the launch of Concentrated Ginseng Renewing Serum EX, supported by a nationwide Sephora rollout and influencer-led digital campaigns.
  • On June 27, 2024, Amorepacific partnered with Tmall Global to introduce exclusive ginseng-based sheet mask bundles for Chinese consumers, aligning with the Double 6 mid-year shopping festival.

Scope of the Report

Item Value
Quantitative Units USD 1,844.5 million
Function Anti-aging, Brightening, Anti-fatigue/energizing, and Skin rejuvenation
Product Type Serums, Creams/lotions, Masks, and Toners
Channel E-commerce, Pharmacies, Specialty beauty stores, and Mass retail
Claim Herbal/natural, Vegan, Dermatologist-tested, and Clean-label
Regions Covered North America, Europe, Asia-Pacific, Latin America, Middle East & Africa
Country Covered United States, Canada, Germany, France, United Kingdom, China, Japan, India, Brazil, South Africa
Key Companies Profiled Sulwhasoo, Innisfree, The Face Shop, Shiseido, Amorepacific, Herbivore Botanicals, Origins, Estée Lauder, Dr. Jart +, and Belif
Additional Attributes Dollar sales by function, product type, and channel, adoption trends in anti-aging and brightening skincare, rising demand for herbal/natural, vegan, and dermatologist-tested claims, segment-specific growth in serums and e-commerce, integration of ginseng with complementary actives (vitamin C, niacinamide, hyaluronic acid), regional trends influenced by K-beauty and clean-label/TCM movements, and innovations in sustainably sourced and biotech-cultured ginseng cell extracts.

Key Segments

By Function:

  • Brightening
  • Anti-fatigue/energizing
  • Skin rejuvenation
  • Anti-aging

By Product Type:

  • Serums
  • Creams & lotions
  • Masks
  • Toners

By Channel:

  • E-commerce
  • Pharmacies
  • Mass retail
  • Specialty beauty stores

By Claim:

  • Herbal/natural
  • Vegan
  • Dermatologist-tested
  • Clean-label

By Region:

  • North America
  • Latin America
  • Europe
  • East Asia
  • South Asia & Pacific
  • Middle East and Africa

Table of Content

  1. Executive Summary
    • Global Market Outlook
    • Demand-side Trends
    • Supply-side Trends
    • Technology Roadmap Analysis
    • Analysis and Recommendations
  2. Market Overview
    • Market Coverage / Taxonomy
    • Market Definition / Scope / Limitations
  3. Market Background
    • Market Dynamics
      • Drivers
      • Restraints
      • Opportunity
      • Trends
    • Scenario Forecast
      • Demand in Optimistic Scenario
      • Demand in Likely Scenario
      • Demand in Conservative Scenario
    • Opportunity Map Analysis
    • Product Life Cycle Analysis
    • Supply Chain Analysis
      • Supply Side Participants and their Roles
        • Producers
        • Mid-Level Participants (Traders/ Agents/ Brokers)
        • Wholesalers and Distributors
      • Value Added and Value Created at Node in the Supply Chain
      • List of Raw Material Suppliers
      • List of Existing and Potential Buyer’s
    • Investment Feasibility Matrix
    • Value Chain Analysis
      • Profit Margin Analysis
      • Wholesalers and Distributors
      • Retailers
    • PESTLE and Porter’s Analysis
    • Regulatory Landscape
      • By Key Regions
      • By Key Countries
    • Regional Parent Market Outlook
    • Production and Consumption Statistics
    • Import and Export Statistics
  4. Global Market Analysis 2020 to 2024 and Forecast, 2025 to 2035
    • Historical Market Size Value (USD Million) & Volume (Units) Analysis, 2020 to 2024
    • Current and Future Market Size Value (USD Million) & Volume (Units) Projections, 2025 to 2035
      • Y-o-Y Growth Trend Analysis
      • Absolute $ Opportunity Analysis
  5. Global Market Analysis 2020 to 2024 and Forecast 2025 to 2035, By Function
    • Introduction / Key Findings
    • Historical Market Size Value (USD Million) & Volume (Units) Analysis By Function, 2020 to 2024
    • Current and Future Market Size Value (USD Million) & Volume (Units) Analysis and Forecast By Function, 2025 to 2035
      • Brightening
      • Anti-fatigue/energizing
      • Skin rejuvenation
      • Anti-aging
    • Y-o-Y Growth Trend Analysis By Function, 2020 to 2024
    • Absolute $ Opportunity Analysis By Function, 2025 to 2035
  6. Global Market Analysis 2020 to 2024 and Forecast 2025 to 2035, By Product Type
    • Introduction / Key Findings
    • Historical Market Size Value (USD Million) & Volume (Units) Analysis By Product Type, 2020 to 2024
    • Current and Future Market Size Value (USD Million) & Volume (Units) Analysis and Forecast By Product Type, 2025 to 2035
      • Serums
      • Creams & lotions
      • Masks
      • Toners
    • Y-o-Y Growth Trend Analysis By Product Type, 2020 to 2024
    • Absolute $ Opportunity Analysis By Product Type, 2025 to 2035
  7. Global Market Analysis 2020 to 2024 and Forecast 2025 to 2035, By Channel
    • Introduction / Key Findings
    • Historical Market Size Value (USD Million) & Volume (Units) Analysis By Channel, 2020 to 2024
    • Current and Future Market Size Value (USD Million) & Volume (Units) Analysis and Forecast By Channel, 2025 to 2035
      • E-commerce
      • Pharmacies
      • Mass retail
      • Specialty beauty stores
    • Y-o-Y Growth Trend Analysis By Channel, 2020 to 2024
    • Absolute $ Opportunity Analysis By Channel, 2025 to 2035
  8. Global Market Analysis 2020 to 2024 and Forecast 2025 to 2035, By Claim
    • Introduction / Key Findings
    • Historical Market Size Value (USD Million) & Volume (Units) Analysis By Claim, 2020 to 2024
    • Current and Future Market Size Value (USD Million) & Volume (Units) Analysis and Forecast By Claim, 2025 to 2035
      • Herbal/natural
      • Vegan
      • Dermatologist-tested
      • Clean-label
    • Y-o-Y Growth Trend Analysis By Claim, 2020 to 2024
    • Absolute $ Opportunity Analysis By Claim, 2025 to 2035
  9. Global Market Analysis 2020 to 2024 and Forecast 2025 to 2035, By Region
    • Introduction
    • Historical Market Size Value (USD Million) & Volume (Units) Analysis By Region, 2020 to 2024
    • Current Market Size Value (USD Million) & Volume (Units) Analysis and Forecast By Region, 2025 to 2035
      • North America
      • Latin America
      • Europe
      • East Asia
      • South Asia & Pacific
      • Middle East and Africa
    • Market Attractiveness Analysis By Region
  10. North America Market Analysis 2020 to 2024 and Forecast 2025 to 2035, By Country
    • Historical Market Size Value (USD Million) & Volume (Units) Trend Analysis By Market Taxonomy, 2020 to 2024
    • Market Size Value (USD Million) & Volume (Units) Forecast By Market Taxonomy, 2025 to 2035
      • By Country
        • U.S.
        • Canada
      • By Function
      • By Product Type
      • By Channel
      • By Claim
    • Market Attractiveness Analysis
      • By Country
      • By Function
      • By Product Type
      • By Channel
      • By Claim
    • Key Takeaways
  11. Latin America Market Analysis 2020 to 2024 and Forecast 2025 to 2035, By Country
    • Historical Market Size Value (USD Million) & Volume (Units) Trend Analysis By Market Taxonomy, 2020 to 2024
    • Market Size Value (USD Million) & Volume (Units) Forecast By Market Taxonomy, 2025 to 2035
      • By Country
        • Brazil
        • Mexico
        • Colombia
        • Rest of Latin America
      • By Function
      • By Product Type
      • By Channel
      • By Claim
    • Market Attractiveness Analysis
      • By Country
      • By Function
      • By Product Type
      • By Channel
      • By Claim
    • Key Takeaways
  12. Europe Market Analysis 2020 to 2024 and Forecast 2025 to 2035, By Country
    • Historical Market Size Value (USD Million) & Volume (Units) Trend Analysis By Market Taxonomy, 2020 to 2024
    • Market Size Value (USD Million) & Volume (Units) Forecast By Market Taxonomy, 2025 to 2035
      • By Country
        • Germany
        • U.K.
        • France
        • Italy
        • Spain
        • Belgium
        • Netherlands
        • Nordic
        • Switzerland
        • Russia
        • Poland
        • Rest of Europe
      • By Function
      • By Product Type
      • By Channel
      • By Claim
    • Market Attractiveness Analysis
      • By Country
      • By Function
      • By Product Type
      • By Channel
      • By Claim
    • Key Takeaways
  13. East Asia Market Analysis 2020 to 2024 and Forecast 2025 to 2035, By Country
    • Historical Market Size Value (USD Million) & Volume (Units) Trend Analysis By Market Taxonomy, 2020 to 2024
    • Market Size Value (USD Million) & Volume (Units) Forecast By Market Taxonomy, 2025 to 2035
      • By Country
        • China
        • Japan
        • South Korea
      • By Function
      • By Product Type
      • By Channel
      • By Claim
    • Market Attractiveness Analysis
      • By Country
      • By Function
      • By Product Type
      • By Channel
      • By Claim
    • Key Takeaways
  14. South Asia & Pacific Market Analysis 2020 to 2024 and Forecast 2025 to 2035, By Country
    • Historical Market Size Value (USD Million) & Volume (Units) Trend Analysis By Market Taxonomy, 2020 to 2024
    • Market Size Value (USD Million) & Volume (Units) Forecast By Market Taxonomy, 2025 to 2035
      • By Country
        • India
        • Thailand
        • Malaysia
        • Indonesia
        • Singapore
        • Vietnam
        • Australia
        • New Zealand
        • Rest of South Asia
      • By Function
      • By Product Type
      • By Channel
      • By Claim
    • Market Attractiveness Analysis
      • By Country
      • By Function
      • By Product Type
      • By Channel
      • By Claim
    • Key Takeaways
  15. Middle East and Africa Market Analysis 2020 to 2024 and Forecast 2025 to 2035, By Country
    • Historical Market Size Value (USD Million) & Volume (Units) Trend Analysis By Market Taxonomy, 2020 to 2024
    • Market Size Value (USD Million) & Volume (Units) Forecast By Market Taxonomy, 2025 to 2035
      • By Country
        • Turkey
        • UAE
        • Saudi Arabia
        • Israel
        • Other GCC Countries
        • North Africa
        • South Africa
      • By Function
      • By Product Type
      • By Channel
      • By Claim
    • Market Attractiveness Analysis
      • By Country
      • By Function
      • By Product Type
      • By Channel
      • By Claim
    • Key Takeaways
  16. Key Countries Market Analysis
    • U.S.
      • Pricing Analysis
      • Market Share Analysis, 2024
        • By Function
        • By Product Type
        • By Channel
        • By Claim
    • Canada
      • Pricing Analysis
      • Market Share Analysis, 2024
        • By Function
        • By Product Type
        • By Channel
        • By Claim
    • Brazil
      • Pricing Analysis
      • Market Share Analysis, 2024
        • By Function
        • By Product Type
        • By Channel
        • By Claim
    • Mexico
      • Pricing Analysis
      • Market Share Analysis, 2024
        • By Function
        • By Product Type
        • By Channel
        • By Claim
    • Colombia
      • Pricing Analysis
      • Market Share Analysis, 2024
        • By Function
        • By Product Type
        • By Channel
        • By Claim
    • Germany
      • Pricing Analysis
      • Market Share Analysis, 2024
        • By Function
        • By Product Type
        • By Channel
        • By Claim
    • U.K.
      • Pricing Analysis
      • Market Share Analysis, 2024
        • By Function
        • By Product Type
        • By Channel
        • By Claim
    • France
      • Pricing Analysis
      • Market Share Analysis, 2024
        • By Function
        • By Product Type
        • By Channel
        • By Claim
    • Italy
      • Pricing Analysis
      • Market Share Analysis, 2024
        • By Function
        • By Product Type
        • By Channel
        • By Claim
    • Spain
      • Pricing Analysis
      • Market Share Analysis, 2024
        • By Function
        • By Product Type
        • By Channel
        • By Claim
    • Belgium
      • Pricing Analysis
      • Market Share Analysis, 2024
        • By Function
        • By Product Type
        • By Channel
        • By Claim
    • Netherlands
      • Pricing Analysis
      • Market Share Analysis, 2024
        • By Function
        • By Product Type
        • By Channel
        • By Claim
    • Nordic
      • Pricing Analysis
      • Market Share Analysis, 2024
        • By Function
        • By Product Type
        • By Channel
        • By Claim
    • Switzerland
      • Pricing Analysis
      • Market Share Analysis, 2024
        • By Function
        • By Product Type
        • By Channel
        • By Claim
    • Russia
      • Pricing Analysis
      • Market Share Analysis, 2024
        • By Function
        • By Product Type
        • By Channel
        • By Claim
    • Poland
      • Pricing Analysis
      • Market Share Analysis, 2024
        • By Function
        • By Product Type
        • By Channel
        • By Claim
    • China
      • Pricing Analysis
      • Market Share Analysis, 2024
        • By Function
        • By Product Type
        • By Channel
        • By Claim
    • Japan
      • Pricing Analysis
      • Market Share Analysis, 2024
        • By Function
        • By Product Type
        • By Channel
        • By Claim
    • South Korea
      • Pricing Analysis
      • Market Share Analysis, 2024
        • By Function
        • By Product Type
        • By Channel
        • By Claim
    • India
      • Pricing Analysis
      • Market Share Analysis, 2024
        • By Function
        • By Product Type
        • By Channel
        • By Claim
    • Thailand
      • Pricing Analysis
      • Market Share Analysis, 2024
        • By Function
        • By Product Type
        • By Channel
        • By Claim
    • Indonesia
      • Pricing Analysis
      • Market Share Analysis, 2024
        • By Function
        • By Product Type
        • By Channel
        • By Claim
    • Australia
      • Pricing Analysis
      • Market Share Analysis, 2024
        • By Function
        • By Product Type
        • By Channel
        • By Claim
    • New Zealand
      • Pricing Analysis
      • Market Share Analysis, 2024
        • By Function
        • By Product Type
        • By Channel
        • By Claim
    • Turkey
      • Pricing Analysis
      • Market Share Analysis, 2024
        • By Function
        • By Product Type
        • By Channel
        • By Claim
    • UAE
      • Pricing Analysis
      • Market Share Analysis, 2024
        • By Function
        • By Product Type
        • By Channel
        • By Claim
    • Saudi Arabia
      • Pricing Analysis
      • Market Share Analysis, 2024
        • By Function
        • By Product Type
        • By Channel
        • By Claim
    • Israel
      • Pricing Analysis
      • Market Share Analysis, 2024
        • By Function
        • By Product Type
        • By Channel
        • By Claim
    • North Africa
      • Pricing Analysis
      • Market Share Analysis, 2024
        • By Function
        • By Product Type
        • By Channel
        • By Claim
    • South Africa
      • Pricing Analysis
      • Market Share Analysis, 2024
        • By Function
        • By Product Type
        • By Channel
        • By Claim
  17. Market Structure Analysis
    • Competition Dashboard
    • Competition Benchmarking
    • Market Share Analysis of Top Players
      • By Regional
      • By Function
      • By Product Type
      • By Channel
      • By Claim
  18. Competition Analysis
    • Competition Deep Dive
      • Sulwhasoo
        • Overview
        • Product Portfolio
        • Profitability by Market Segments (Product/Age /Sales Channel/Region)
        • Sales Footprint
        • Strategy Overview
          • Marketing Strategy
          • Product Strategy
          • Channel Strategy
      • Innisfree
        • Overview
        • Product Portfolio
        • Profitability by Market Segments (Product/Age /Sales Channel/Region)
        • Sales Footprint
        • Strategy Overview
          • Marketing Strategy
          • Product Strategy
          • Channel Strategy
      • The Face Shop
        • Overview
        • Product Portfolio
        • Profitability by Market Segments (Product/Age /Sales Channel/Region)
        • Sales Footprint
        • Strategy Overview
          • Marketing Strategy
          • Product Strategy
          • Channel Strategy
      • Shiseido
        • Overview
        • Product Portfolio
        • Profitability by Market Segments (Product/Age /Sales Channel/Region)
        • Sales Footprint
        • Strategy Overview
          • Marketing Strategy
          • Product Strategy
          • Channel Strategy
      • Amorepacific
        • Overview
        • Product Portfolio
        • Profitability by Market Segments (Product/Age /Sales Channel/Region)
        • Sales Footprint
        • Strategy Overview
          • Marketing Strategy
          • Product Strategy
          • Channel Strategy
      • Herbivore Botanicals
        • Overview
        • Product Portfolio
        • Profitability by Market Segments (Product/Age /Sales Channel/Region)
        • Sales Footprint
        • Strategy Overview
          • Marketing Strategy
          • Product Strategy
          • Channel Strategy
      • Origins
        • Overview
        • Product Portfolio
        • Profitability by Market Segments (Product/Age /Sales Channel/Region)
        • Sales Footprint
        • Strategy Overview
          • Marketing Strategy
          • Product Strategy
          • Channel Strategy
      • Estee Lauder
        • Overview
        • Product Portfolio
        • Profitability by Market Segments (Product/Age /Sales Channel/Region)
        • Sales Footprint
        • Strategy Overview
          • Marketing Strategy
          • Product Strategy
          • Channel Strategy
      • Dr. Jart+
        • Overview
        • Product Portfolio
        • Profitability by Market Segments (Product/Age /Sales Channel/Region)
        • Sales Footprint
        • Strategy Overview
          • Marketing Strategy
          • Product Strategy
          • Channel Strategy
      • Belif
        • Overview
        • Product Portfolio
        • Profitability by Market Segments (Product/Age /Sales Channel/Region)
        • Sales Footprint
        • Strategy Overview
          • Marketing Strategy
          • Product Strategy
          • Channel Strategy
  19. Assumptions & Acronyms Used
  20. Research Methodology

List of Tables

  • Table 1: Global Market Value (USD Million) Forecast by Region, 2020-2035
  • Table 2: Global Market Volume (Units) Forecast by Region, 2020-2035
  • Table 3: Global Market Value (USD Million) Forecast by Function, 2020-2035
  • Table 4: Global Market Volume (Units) Forecast by Function, 2020-2035
  • Table 5: Global Market Value (USD Million) Forecast by Product Type, 2020-2035
  • Table 6: Global Market Volume (Units) Forecast by Product Type, 2020-2035
  • Table 7: Global Market Value (USD Million) Forecast by Channel, 2020-2035
  • Table 8: Global Market Volume (Units) Forecast by Channel, 2020-2035
  • Table 9: Global Market Value (USD Million) Forecast by Claim, 2020-2035
  • Table 10: Global Market Volume (Units) Forecast by Claim, 2020-2035
  • Table 11: North America Market Value (USD Million) Forecast by Country, 2020-2035
  • Table 12: North America Market Volume (Units) Forecast by Country, 2020-2035
  • Table 13: North America Market Value (USD Million) Forecast by Function, 2020-2035
  • Table 14: North America Market Volume (Units) Forecast by Function, 2020-2035
  • Table 15: North America Market Value (USD Million) Forecast by Product Type, 2020-2035
  • Table 16: North America Market Volume (Units) Forecast by Product Type, 2020-2035
  • Table 17: North America Market Value (USD Million) Forecast by Channel, 2020-2035
  • Table 18: North America Market Volume (Units) Forecast by Channel, 2020-2035
  • Table 19: North America Market Value (USD Million) Forecast by Claim, 2020-2035
  • Table 20: North America Market Volume (Units) Forecast by Claim, 2020-2035
  • Table 21: Latin America Market Value (USD Million) Forecast by Country, 2020-2035
  • Table 22: Latin America Market Volume (Units) Forecast by Country, 2020-2035
  • Table 23: Latin America Market Value (USD Million) Forecast by Function, 2020-2035
  • Table 24: Latin America Market Volume (Units) Forecast by Function, 2020-2035
  • Table 25: Latin America Market Value (USD Million) Forecast by Product Type, 2020-2035
  • Table 26: Latin America Market Volume (Units) Forecast by Product Type, 2020-2035
  • Table 27: Latin America Market Value (USD Million) Forecast by Channel, 2020-2035
  • Table 28: Latin America Market Volume (Units) Forecast by Channel, 2020-2035
  • Table 29: Latin America Market Value (USD Million) Forecast by Claim, 2020-2035
  • Table 30: Latin America Market Volume (Units) Forecast by Claim, 2020-2035
  • Table 31: Europe Market Value (USD Million) Forecast by Country, 2020-2035
  • Table 32: Europe Market Volume (Units) Forecast by Country, 2020-2035
  • Table 33: Europe Market Value (USD Million) Forecast by Function, 2020-2035
  • Table 34: Europe Market Volume (Units) Forecast by Function, 2020-2035
  • Table 35: Europe Market Value (USD Million) Forecast by Product Type, 2020-2035
  • Table 36: Europe Market Volume (Units) Forecast by Product Type, 2020-2035
  • Table 37: Europe Market Value (USD Million) Forecast by Channel, 2020-2035
  • Table 38: Europe Market Volume (Units) Forecast by Channel, 2020-2035
  • Table 39: Europe Market Value (USD Million) Forecast by Claim, 2020-2035
  • Table 40: Europe Market Volume (Units) Forecast by Claim, 2020-2035
  • Table 41: East Asia Market Value (USD Million) Forecast by Country, 2020-2035
  • Table 42: East Asia Market Volume (Units) Forecast by Country, 2020-2035
  • Table 43: East Asia Market Value (USD Million) Forecast by Function, 2020-2035
  • Table 44: East Asia Market Volume (Units) Forecast by Function, 2020-2035
  • Table 45: East Asia Market Value (USD Million) Forecast by Product Type, 2020-2035
  • Table 46: East Asia Market Volume (Units) Forecast by Product Type, 2020-2035
  • Table 47: East Asia Market Value (USD Million) Forecast by Channel, 2020-2035
  • Table 48: East Asia Market Volume (Units) Forecast by Channel, 2020-2035
  • Table 49: East Asia Market Value (USD Million) Forecast by Claim, 2020-2035
  • Table 50: East Asia Market Volume (Units) Forecast by Claim, 2020-2035
  • Table 51: South Asia & Pacific Market Value (USD Million) Forecast by Country, 2020-2035
  • Table 52: South Asia & Pacific Market Volume (Units) Forecast by Country, 2020-2035
  • Table 53: South Asia & Pacific Market Value (USD Million) Forecast by Function, 2020-2035
  • Table 54: South Asia & Pacific Market Volume (Units) Forecast by Function, 2020-2035
  • Table 55: South Asia & Pacific Market Value (USD Million) Forecast by Product Type, 2020-2035
  • Table 56: South Asia & Pacific Market Volume (Units) Forecast by Product Type, 2020-2035
  • Table 57: South Asia & Pacific Market Value (USD Million) Forecast by Channel, 2020-2035
  • Table 58: South Asia & Pacific Market Volume (Units) Forecast by Channel, 2020-2035
  • Table 59: South Asia & Pacific Market Value (USD Million) Forecast by Claim, 2020-2035
  • Table 60: South Asia & Pacific Market Volume (Units) Forecast by Claim, 2020-2035
  • Table 61: Middle East and Africa Market Value (USD Million) Forecast by Country, 2020-2035
  • Table 62: Middle East and Africa Market Volume (Units) Forecast by Country, 2020-2035
  • Table 63: Middle East and Africa Market Value (USD Million) Forecast by Function, 2020-2035
  • Table 64: Middle East and Africa Market Volume (Units) Forecast by Function, 2020-2035
  • Table 65: Middle East and Africa Market Value (USD Million) Forecast by Product Type, 2020-2035
  • Table 66: Middle East and Africa Market Volume (Units) Forecast by Product Type, 2020-2035
  • Table 67: Middle East and Africa Market Value (USD Million) Forecast by Channel, 2020-2035
  • Table 68: Middle East and Africa Market Volume (Units) Forecast by Channel, 2020-2035
  • Table 69: Middle East and Africa Market Value (USD Million) Forecast by Claim, 2020-2035
  • Table 70: Middle East and Africa Market Volume (Units) Forecast by Claim, 2020-2035

List of Figures

  • Figure 1: Global Market Value (USD Million) by Function, 2025-2035
  • Figure 2: Global Market Value (USD Million) by Product Type, 2025-2035
  • Figure 3: Global Market Value (USD Million) by Channel, 2025-2035
  • Figure 4: Global Market Value (USD Million) by Claim, 2025-2035
  • Figure 5: Global Market Value (USD Million) by Region, 2025-2035
  • Figure 6: Global Market Value (USD Million) Analysis by Region, 2020-2035
  • Figure 7: Global Market Volume (Units) Analysis by Region, 2020-2035
  • Figure 8: Global Market Value Share (%) and BPS Analysis by Region, 2025-2035
  • Figure 9: Global Market Y-o-Y Growth (%) Projections by Region, 2025-2035
  • Figure 10: Global Market Value (USD Million) Analysis by Function, 2020-2035
  • Figure 11: Global Market Volume (Units) Analysis by Function, 2020-2035
  • Figure 12: Global Market Value Share (%) and BPS Analysis by Function, 2025-2035
  • Figure 13: Global Market Y-o-Y Growth (%) Projections by Function, 2025-2035
  • Figure 14: Global Market Value (USD Million) Analysis by Product Type, 2020-2035
  • Figure 15: Global Market Volume (Units) Analysis by Product Type, 2020-2035
  • Figure 16: Global Market Value Share (%) and BPS Analysis by Product Type, 2025-2035
  • Figure 17: Global Market Y-o-Y Growth (%) Projections by Product Type, 2025-2035
  • Figure 18: Global Market Value (USD Million) Analysis by Channel, 2020-2035
  • Figure 19: Global Market Volume (Units) Analysis by Channel, 2020-2035
  • Figure 20: Global Market Value Share (%) and BPS Analysis by Channel, 2025-2035
  • Figure 21: Global Market Y-o-Y Growth (%) Projections by Channel, 2025-2035
  • Figure 22: Global Market Value (USD Million) Analysis by Claim, 2020-2035
  • Figure 23: Global Market Volume (Units) Analysis by Claim, 2020-2035
  • Figure 24: Global Market Value Share (%) and BPS Analysis by Claim, 2025-2035
  • Figure 25: Global Market Y-o-Y Growth (%) Projections by Claim, 2025-2035
  • Figure 26: Global Market Attractiveness by Function, 2025-2035
  • Figure 27: Global Market Attractiveness by Product Type, 2025-2035
  • Figure 28: Global Market Attractiveness by Channel, 2025-2035
  • Figure 29: Global Market Attractiveness by Claim, 2025-2035
  • Figure 30: Global Market Attractiveness by Region, 2025-2035
  • Figure 31: North America Market Value (USD Million) by Function, 2025-2035
  • Figure 32: North America Market Value (USD Million) by Product Type, 2025-2035
  • Figure 33: North America Market Value (USD Million) by Channel, 2025-2035
  • Figure 34: North America Market Value (USD Million) by Claim, 2025-2035
  • Figure 35: North America Market Value (USD Million) by Country, 2025-2035
  • Figure 36: North America Market Value (USD Million) Analysis by Country, 2020-2035
  • Figure 37: North America Market Volume (Units) Analysis by Country, 2020-2035
  • Figure 38: North America Market Value Share (%) and BPS Analysis by Country, 2025-2035
  • Figure 39: North America Market Y-o-Y Growth (%) Projections by Country, 2025-2035
  • Figure 40: North America Market Value (USD Million) Analysis by Function, 2020-2035
  • Figure 41: North America Market Volume (Units) Analysis by Function, 2020-2035
  • Figure 42: North America Market Value Share (%) and BPS Analysis by Function, 2025-2035
  • Figure 43: North America Market Y-o-Y Growth (%) Projections by Function, 2025-2035
  • Figure 44: North America Market Value (USD Million) Analysis by Product Type, 2020-2035
  • Figure 45: North America Market Volume (Units) Analysis by Product Type, 2020-2035
  • Figure 46: North America Market Value Share (%) and BPS Analysis by Product Type, 2025-2035
  • Figure 47: North America Market Y-o-Y Growth (%) Projections by Product Type, 2025-2035
  • Figure 48: North America Market Value (USD Million) Analysis by Channel, 2020-2035
  • Figure 49: North America Market Volume (Units) Analysis by Channel, 2020-2035
  • Figure 50: North America Market Value Share (%) and BPS Analysis by Channel, 2025-2035
  • Figure 51: North America Market Y-o-Y Growth (%) Projections by Channel, 2025-2035
  • Figure 52: North America Market Value (USD Million) Analysis by Claim, 2020-2035
  • Figure 53: North America Market Volume (Units) Analysis by Claim, 2020-2035
  • Figure 54: North America Market Value Share (%) and BPS Analysis by Claim, 2025-2035
  • Figure 55: North America Market Y-o-Y Growth (%) Projections by Claim, 2025-2035
  • Figure 56: North America Market Attractiveness by Function, 2025-2035
  • Figure 57: North America Market Attractiveness by Product Type, 2025-2035
  • Figure 58: North America Market Attractiveness by Channel, 2025-2035
  • Figure 59: North America Market Attractiveness by Claim, 2025-2035
  • Figure 60: North America Market Attractiveness by Country, 2025-2035
  • Figure 61: Latin America Market Value (USD Million) by Function, 2025-2035
  • Figure 62: Latin America Market Value (USD Million) by Product Type, 2025-2035
  • Figure 63: Latin America Market Value (USD Million) by Channel, 2025-2035
  • Figure 64: Latin America Market Value (USD Million) by Claim, 2025-2035
  • Figure 65: Latin America Market Value (USD Million) by Country, 2025-2035
  • Figure 66: Latin America Market Value (USD Million) Analysis by Country, 2020-2035
  • Figure 67: Latin America Market Volume (Units) Analysis by Country, 2020-2035
  • Figure 68: Latin America Market Value Share (%) and BPS Analysis by Country, 2025-2035
  • Figure 69: Latin America Market Y-o-Y Growth (%) Projections by Country, 2025-2035
  • Figure 70: Latin America Market Value (USD Million) Analysis by Function, 2020-2035
  • Figure 71: Latin America Market Volume (Units) Analysis by Function, 2020-2035
  • Figure 72: Latin America Market Value Share (%) and BPS Analysis by Function, 2025-2035
  • Figure 73: Latin America Market Y-o-Y Growth (%) Projections by Function, 2025-2035
  • Figure 74: Latin America Market Value (USD Million) Analysis by Product Type, 2020-2035
  • Figure 75: Latin America Market Volume (Units) Analysis by Product Type, 2020-2035
  • Figure 76: Latin America Market Value Share (%) and BPS Analysis by Product Type, 2025-2035
  • Figure 77: Latin America Market Y-o-Y Growth (%) Projections by Product Type, 2025-2035
  • Figure 78: Latin America Market Value (USD Million) Analysis by Channel, 2020-2035
  • Figure 79: Latin America Market Volume (Units) Analysis by Channel, 2020-2035
  • Figure 80: Latin America Market Value Share (%) and BPS Analysis by Channel, 2025-2035
  • Figure 81: Latin America Market Y-o-Y Growth (%) Projections by Channel, 2025-2035
  • Figure 82: Latin America Market Value (USD Million) Analysis by Claim, 2020-2035
  • Figure 83: Latin America Market Volume (Units) Analysis by Claim, 2020-2035
  • Figure 84: Latin America Market Value Share (%) and BPS Analysis by Claim, 2025-2035
  • Figure 85: Latin America Market Y-o-Y Growth (%) Projections by Claim, 2025-2035
  • Figure 86: Latin America Market Attractiveness by Function, 2025-2035
  • Figure 87: Latin America Market Attractiveness by Product Type, 2025-2035
  • Figure 88: Latin America Market Attractiveness by Channel, 2025-2035
  • Figure 89: Latin America Market Attractiveness by Claim, 2025-2035
  • Figure 90: Latin America Market Attractiveness by Country, 2025-2035
  • Figure 91: Europe Market Value (USD Million) by Function, 2025-2035
  • Figure 92: Europe Market Value (USD Million) by Product Type, 2025-2035
  • Figure 93: Europe Market Value (USD Million) by Channel, 2025-2035
  • Figure 94: Europe Market Value (USD Million) by Claim, 2025-2035
  • Figure 95: Europe Market Value (USD Million) by Country, 2025-2035
  • Figure 96: Europe Market Value (USD Million) Analysis by Country, 2020-2035
  • Figure 97: Europe Market Volume (Units) Analysis by Country, 2020-2035
  • Figure 98: Europe Market Value Share (%) and BPS Analysis by Country, 2025-2035
  • Figure 99: Europe Market Y-o-Y Growth (%) Projections by Country, 2025-2035
  • Figure 100: Europe Market Value (USD Million) Analysis by Function, 2020-2035
  • Figure 101: Europe Market Volume (Units) Analysis by Function, 2020-2035
  • Figure 102: Europe Market Value Share (%) and BPS Analysis by Function, 2025-2035
  • Figure 103: Europe Market Y-o-Y Growth (%) Projections by Function, 2025-2035
  • Figure 104: Europe Market Value (USD Million) Analysis by Product Type, 2020-2035
  • Figure 105: Europe Market Volume (Units) Analysis by Product Type, 2020-2035
  • Figure 106: Europe Market Value Share (%) and BPS Analysis by Product Type, 2025-2035
  • Figure 107: Europe Market Y-o-Y Growth (%) Projections by Product Type, 2025-2035
  • Figure 108: Europe Market Value (USD Million) Analysis by Channel, 2020-2035
  • Figure 109: Europe Market Volume (Units) Analysis by Channel, 2020-2035
  • Figure 110: Europe Market Value Share (%) and BPS Analysis by Channel, 2025-2035
  • Figure 111: Europe Market Y-o-Y Growth (%) Projections by Channel, 2025-2035
  • Figure 112: Europe Market Value (USD Million) Analysis by Claim, 2020-2035
  • Figure 113: Europe Market Volume (Units) Analysis by Claim, 2020-2035
  • Figure 114: Europe Market Value Share (%) and BPS Analysis by Claim, 2025-2035
  • Figure 115: Europe Market Y-o-Y Growth (%) Projections by Claim, 2025-2035
  • Figure 116: Europe Market Attractiveness by Function, 2025-2035
  • Figure 117: Europe Market Attractiveness by Product Type, 2025-2035
  • Figure 118: Europe Market Attractiveness by Channel, 2025-2035
  • Figure 119: Europe Market Attractiveness by Claim, 2025-2035
  • Figure 120: Europe Market Attractiveness by Country, 2025-2035
  • Figure 121: East Asia Market Value (USD Million) by Function, 2025-2035
  • Figure 122: East Asia Market Value (USD Million) by Product Type, 2025-2035
  • Figure 123: East Asia Market Value (USD Million) by Channel, 2025-2035
  • Figure 124: East Asia Market Value (USD Million) by Claim, 2025-2035
  • Figure 125: East Asia Market Value (USD Million) by Country, 2025-2035
  • Figure 126: East Asia Market Value (USD Million) Analysis by Country, 2020-2035
  • Figure 127: East Asia Market Volume (Units) Analysis by Country, 2020-2035
  • Figure 128: East Asia Market Value Share (%) and BPS Analysis by Country, 2025-2035
  • Figure 129: East Asia Market Y-o-Y Growth (%) Projections by Country, 2025-2035
  • Figure 130: East Asia Market Value (USD Million) Analysis by Function, 2020-2035
  • Figure 131: East Asia Market Volume (Units) Analysis by Function, 2020-2035
  • Figure 132: East Asia Market Value Share (%) and BPS Analysis by Function, 2025-2035
  • Figure 133: East Asia Market Y-o-Y Growth (%) Projections by Function, 2025-2035
  • Figure 134: East Asia Market Value (USD Million) Analysis by Product Type, 2020-2035
  • Figure 135: East Asia Market Volume (Units) Analysis by Product Type, 2020-2035
  • Figure 136: East Asia Market Value Share (%) and BPS Analysis by Product Type, 2025-2035
  • Figure 137: East Asia Market Y-o-Y Growth (%) Projections by Product Type, 2025-2035
  • Figure 138: East Asia Market Value (USD Million) Analysis by Channel, 2020-2035
  • Figure 139: East Asia Market Volume (Units) Analysis by Channel, 2020-2035
  • Figure 140: East Asia Market Value Share (%) and BPS Analysis by Channel, 2025-2035
  • Figure 141: East Asia Market Y-o-Y Growth (%) Projections by Channel, 2025-2035
  • Figure 142: East Asia Market Value (USD Million) Analysis by Claim, 2020-2035
  • Figure 143: East Asia Market Volume (Units) Analysis by Claim, 2020-2035
  • Figure 144: East Asia Market Value Share (%) and BPS Analysis by Claim, 2025-2035
  • Figure 145: East Asia Market Y-o-Y Growth (%) Projections by Claim, 2025-2035
  • Figure 146: East Asia Market Attractiveness by Function, 2025-2035
  • Figure 147: East Asia Market Attractiveness by Product Type, 2025-2035
  • Figure 148: East Asia Market Attractiveness by Channel, 2025-2035
  • Figure 149: East Asia Market Attractiveness by Claim, 2025-2035
  • Figure 150: East Asia Market Attractiveness by Country, 2025-2035
  • Figure 151: South Asia & Pacific Market Value (USD Million) by Function, 2025-2035
  • Figure 152: South Asia & Pacific Market Value (USD Million) by Product Type, 2025-2035
  • Figure 153: South Asia & Pacific Market Value (USD Million) by Channel, 2025-2035
  • Figure 154: South Asia & Pacific Market Value (USD Million) by Claim, 2025-2035
  • Figure 155: South Asia & Pacific Market Value (USD Million) by Country, 2025-2035
  • Figure 156: South Asia & Pacific Market Value (USD Million) Analysis by Country, 2020-2035
  • Figure 157: South Asia & Pacific Market Volume (Units) Analysis by Country, 2020-2035
  • Figure 158: South Asia & Pacific Market Value Share (%) and BPS Analysis by Country, 2025-2035
  • Figure 159: South Asia & Pacific Market Y-o-Y Growth (%) Projections by Country, 2025-2035
  • Figure 160: South Asia & Pacific Market Value (USD Million) Analysis by Function, 2020-2035
  • Figure 161: South Asia & Pacific Market Volume (Units) Analysis by Function, 2020-2035
  • Figure 162: South Asia & Pacific Market Value Share (%) and BPS Analysis by Function, 2025-2035
  • Figure 163: South Asia & Pacific Market Y-o-Y Growth (%) Projections by Function, 2025-2035
  • Figure 164: South Asia & Pacific Market Value (USD Million) Analysis by Product Type, 2020-2035
  • Figure 165: South Asia & Pacific Market Volume (Units) Analysis by Product Type, 2020-2035
  • Figure 166: South Asia & Pacific Market Value Share (%) and BPS Analysis by Product Type, 2025-2035
  • Figure 167: South Asia & Pacific Market Y-o-Y Growth (%) Projections by Product Type, 2025-2035
  • Figure 168: South Asia & Pacific Market Value (USD Million) Analysis by Channel, 2020-2035
  • Figure 169: South Asia & Pacific Market Volume (Units) Analysis by Channel, 2020-2035
  • Figure 170: South Asia & Pacific Market Value Share (%) and BPS Analysis by Channel, 2025-2035
  • Figure 171: South Asia & Pacific Market Y-o-Y Growth (%) Projections by Channel, 2025-2035
  • Figure 172: South Asia & Pacific Market Value (USD Million) Analysis by Claim, 2020-2035
  • Figure 173: South Asia & Pacific Market Volume (Units) Analysis by Claim, 2020-2035
  • Figure 174: South Asia & Pacific Market Value Share (%) and BPS Analysis by Claim, 2025-2035
  • Figure 175: South Asia & Pacific Market Y-o-Y Growth (%) Projections by Claim, 2025-2035
  • Figure 176: South Asia & Pacific Market Attractiveness by Function, 2025-2035
  • Figure 177: South Asia & Pacific Market Attractiveness by Product Type, 2025-2035
  • Figure 178: South Asia & Pacific Market Attractiveness by Channel, 2025-2035
  • Figure 179: South Asia & Pacific Market Attractiveness by Claim, 2025-2035
  • Figure 180: South Asia & Pacific Market Attractiveness by Country, 2025-2035
  • Figure 181: Middle East and Africa Market Value (USD Million) by Function, 2025-2035
  • Figure 182: Middle East and Africa Market Value (USD Million) by Product Type, 2025-2035
  • Figure 183: Middle East and Africa Market Value (USD Million) by Channel, 2025-2035
  • Figure 184: Middle East and Africa Market Value (USD Million) by Claim, 2025-2035
  • Figure 185: Middle East and Africa Market Value (USD Million) by Country, 2025-2035
  • Figure 186: Middle East and Africa Market Value (USD Million) Analysis by Country, 2020-2035
  • Figure 187: Middle East and Africa Market Volume (Units) Analysis by Country, 2020-2035
  • Figure 188: Middle East and Africa Market Value Share (%) and BPS Analysis by Country, 2025-2035
  • Figure 189: Middle East and Africa Market Y-o-Y Growth (%) Projections by Country, 2025-2035
  • Figure 190: Middle East and Africa Market Value (USD Million) Analysis by Function, 2020-2035
  • Figure 191: Middle East and Africa Market Volume (Units) Analysis by Function, 2020-2035
  • Figure 192: Middle East and Africa Market Value Share (%) and BPS Analysis by Function, 2025-2035
  • Figure 193: Middle East and Africa Market Y-o-Y Growth (%) Projections by Function, 2025-2035
  • Figure 194: Middle East and Africa Market Value (USD Million) Analysis by Product Type, 2020-2035
  • Figure 195: Middle East and Africa Market Volume (Units) Analysis by Product Type, 2020-2035
  • Figure 196: Middle East and Africa Market Value Share (%) and BPS Analysis by Product Type, 2025-2035
  • Figure 197: Middle East and Africa Market Y-o-Y Growth (%) Projections by Product Type, 2025-2035
  • Figure 198: Middle East and Africa Market Value (USD Million) Analysis by Channel, 2020-2035
  • Figure 199: Middle East and Africa Market Volume (Units) Analysis by Channel, 2020-2035
  • Figure 200: Middle East and Africa Market Value Share (%) and BPS Analysis by Channel, 2025-2035
  • Figure 201: Middle East and Africa Market Y-o-Y Growth (%) Projections by Channel, 2025-2035
  • Figure 202: Middle East and Africa Market Value (USD Million) Analysis by Claim, 2020-2035
  • Figure 203: Middle East and Africa Market Volume (Units) Analysis by Claim, 2020-2035
  • Figure 204: Middle East and Africa Market Value Share (%) and BPS Analysis by Claim, 2025-2035
  • Figure 205: Middle East and Africa Market Y-o-Y Growth (%) Projections by Claim, 2025-2035
  • Figure 206: Middle East and Africa Market Attractiveness by Function, 2025-2035
  • Figure 207: Middle East and Africa Market Attractiveness by Product Type, 2025-2035
  • Figure 208: Middle East and Africa Market Attractiveness by Channel, 2025-2035
  • Figure 209: Middle East and Africa Market Attractiveness by Claim, 2025-2035
  • Figure 210: Middle East and Africa Market Attractiveness by Country, 2025-2035

Frequently Asked Questions

How big is the Global Ginseng Root Extracts Skincare Market in 2025?

The Global Ginseng Root Extracts Skincare Market is estimated to be valued at USD 1,844.5 million in 2025.

What will be the size of the Global Ginseng Root Extracts Skincare Market in 2035?

The market size for the Global Ginseng Root Extracts Skincare Market is projected to reach USD 5,952.3 million by 2035.

How much will be the Global Ginseng Root Extracts Skincare Market growth between 2025 and 2035?

The Global Ginseng Root Extracts Skincare Market is expected to grow at a 12.4% CAGR between 2025 and 2035.

What are the key product types in the Global Ginseng Root Extracts Skincare Market?

The key product types in the Global Ginseng Root Extracts Skincare Market are serums, creams/lotions, masks, and toners.

Which function segment will contribute significant share in the Global Ginseng Root Extracts Skincare Market in 2025?

In terms of function, the anti-aging segment is projected to command 53.5% share in the Global Ginseng Root Extracts Skincare Market in 2025.

Explore Similar Insights

Future Market Insights

Ginseng Root Extracts Skincare Market