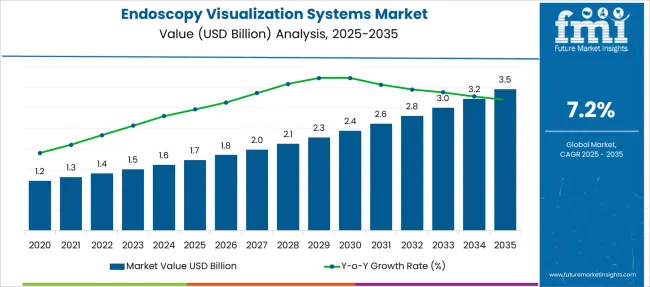
The Endoscopy Visualization Systems Market is estimated to be valued at USD 1.7 billion in 2025 and is projected to reach USD 3.5 billion by 2035, registering a compound annual growth rate (CAGR) of 7.2% over the forecast period.
| Metric | Value |
|---|---|
| Endoscopy Visualization Systems Market Estimated Value in (2025 E) | USD 1.7 billion |
| Endoscopy Visualization Systems Market Forecast Value in (2035 F) | USD 3.5 billion |
| Forecast CAGR (2025 to 2035) | 7.2% |
The endoscopy visualization systems market is witnessing consistent advancements, driven by the demand for minimally invasive diagnostic and surgical procedures across gastroenterology, urology, and oncology. Innovations in imaging resolution, real-time 3D visualization, and AI-assisted detection are enhancing diagnostic accuracy, while reducing surgical risk and patient recovery time.
Hospitals and specialty clinics are investing in integrated visualization platforms that provide better ergonomics, data storage, and remote collaboration functionalities. Additionally, aging global populations and increased incidence of gastrointestinal disorders are prompting healthcare systems to expand their endoscopy capabilities.
Regulatory approval of next-generation devices and integration of robotics are expected to further accelerate market growth. With greater emphasis on patient outcomes and early diagnosis, the industry is moving toward higher-value systems that combine optical clarity, data integration, and procedural efficiency.
The market is segmented by Product Type, Area, and End User and region. By Product Type, the market is divided into High Range EVS, Mid-Range EVS, and Low Range EVS. In terms of Area, the market is classified into Gastrointestinal Tract, Respiratory Tract, Ear, Urinary Tract, Female Reproductive Tract, and Through a small incision. Based on End User, the market is segmented into Hospitals, Ambulatory Surgical Centers, Specialty Clinics, and Diagnostic Imaging Centers. Regionally, the market is classified into North America, Latin America, Western Europe, Eastern Europe, Balkan & Baltic Countries, Russia & Belarus, Central Asia, East Asia, South Asia & Pacific, and the Middle East & Africa.
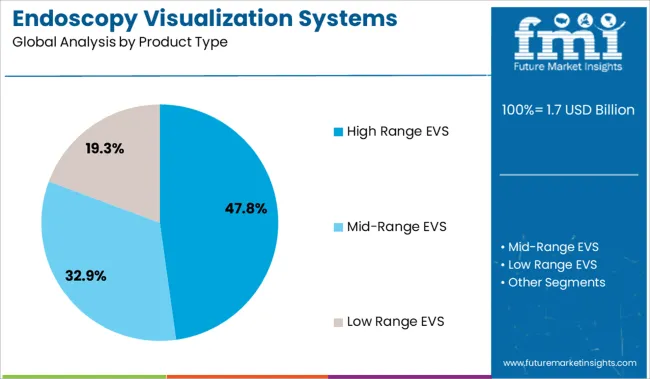
High range endoscopy visualization systems are projected to account for 47.80% of the total market share in 2025, making them the dominant product type. Their growth is being supported by rising demand for ultra-high-definition imaging, enhanced depth perception, and digital integration in complex diagnostic and surgical applications.
These systems offer features such as fluorescence imaging, 4K clarity, and automatic light adjustment, which improve tissue differentiation and surgeon precision. As procedures become more specialized, hospitals and surgical centers are prioritizing equipment that minimizes intraoperative error while supporting advanced documentation and telemedicine compatibility.
The ability of high range systems to interface with robotic-assisted tools and AI-based software further elevates their utility in modern clinical workflows.
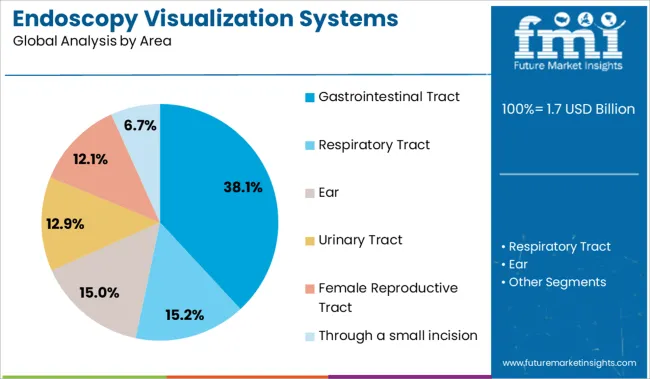
The gastrointestinal tract is expected to contribute 38.10% of the market revenue in 2025, emerging as the leading anatomical area for endoscopy visualization system usage. This leadership is being driven by the high prevalence of gastrointestinal diseases, increased adoption of colonoscopy and gastroscopy screening, and aging demographics across major healthcare markets.
Routine GI screenings have become central to early cancer detection protocols, necessitating the use of advanced visualization tools for accurate polyp detection and biopsy guidance. Inflammatory bowel disease and chronic gastric conditions are also expanding the procedural volume.
With reimbursement support improving and public health awareness increasing, endoscopic visualization in GI applications remains a core area of investment for healthcare facilities.
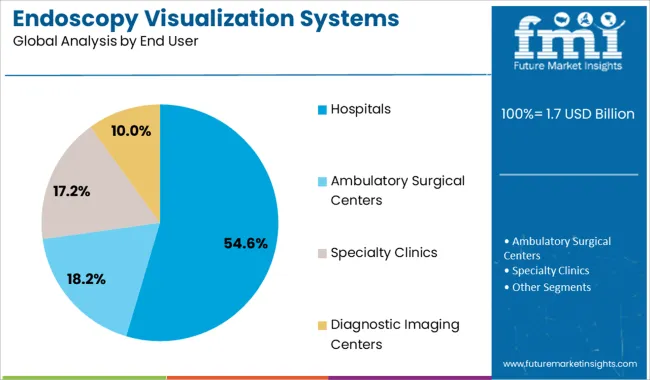
Hospitals are forecast to hold 54.60% of the total market revenue in 2025, solidifying their position as the primary end users of endoscopy visualization systems. This segment’s dominance stems from hospitals' broad procedural scope, high patient throughput, and access to capital-intensive equipment.
Endoscopy units within hospitals are increasingly integrating modular visualization systems that allow for multi-specialty use, central data archiving, and real-time image sharing. The trend toward value-based healthcare and outcome optimization has led to the prioritization of imaging systems that support faster diagnosis, reduced readmission rates, and safer surgical interventions.
Hospitals also benefit from in-house technical expertise and service agreements with OEMs, ensuring long-term operational reliability and equipment lifecycle efficiency.
| Particulars | Details |
|---|---|
| H1, 2024 | 7.28% |
| H1, 2025 Projected | 7.19% |
| H1, 2025 Outlook | 7.09% |
| BPS Change - H1, 2025 (O) - H1, 2025 (P) | (-) 10 ↓ |
| BPS Change – H1, 2025 (O) - H1, 2024 | (-) 19 ↓ |
According to Future Market Insights Analysis, the global endoscopy visualization systems market observed a diminished change in the Basis Point Share (BPS) by nearly 19 BPS in H1- 2025(O) compared to H1-2024, whereas, in comparison to H1-2025 Projected value, the market growth rate during H1-2025 outlook period will show a dip of 10 BPS.
This was majorly due to the impact of the COVID-19 pandemic which affected the overall market scenario by postponement of elective surgical procedures, thereby negatively affecting the endoscopic visualization systems market. This is based on value consumption as per the company’s reported revenue.
In developing markets like India, the cost of these visualization systems are very high and this contributes to less growth of the endoscopy visualization in this country. Additionally, the cost recovery scenario in developing regions is quite low which will result in slower growth of this market.
Despite these negative aspects, increasing healthcare expenditure in developed regions, along with technological advances in in-vivo imaging systems will fuel the growth of endoscopy visualization market.
Sales of endoscopy visualization systems market grew at a CAGR of 6.0% between 2013 and 2024.
In 2024, the global market of endoscopy visualization systems accounts for approx. 10.1% of the overall endoscopy market that accounts around USD 13.2 Billion.
Rising demand for minimally invasive procedures will have a high impact on endoscopy visualization system market. Traditionally done surgeries are complex procedures, however, minimally invasive procedures are less complex and safe as they involve smaller incisions on the patient’s body. This procedures is highly adapted by patient due to its less invasive nature and also lesser time taken during surgery plus quick recovery post-surgery. Hence, the demand for endoscopy visualization systems has risen in the recent times.
Minimally invasive procedures have various advantage like less blood loss & reduced chances of infection, rapid recovery time and less marks after surgery on the body. These benefits have attracted a lot of end user consideration thus, driving the endoscopy visualization system market.
Considering this, it is expected for the global endoscopy visualization systems market to grow at a CAGR of 7.2% through 2035.
High costs for endoscopy visualization system is expected to hamper the growth of market over the forecast period. Installations, repair, service of equipment of endoscope involves high cost. Partial financial support from government in installation also adds to the restraining factor for the growth of the global endoscopy visualization system market
Prospect of installation price return depends on the number of procedures performed per day and availability of good medical facilities. Hence, cost recovering is quite uncertain in regions where medical facilities and surgical procedures are limited and therefore, involves high risk. This factor may restrain the market growth at high rate.
Moreover, lack of trained endoscopy specialists and professionals also adds to the constraints for the growth of endoscopy visualization systems market.
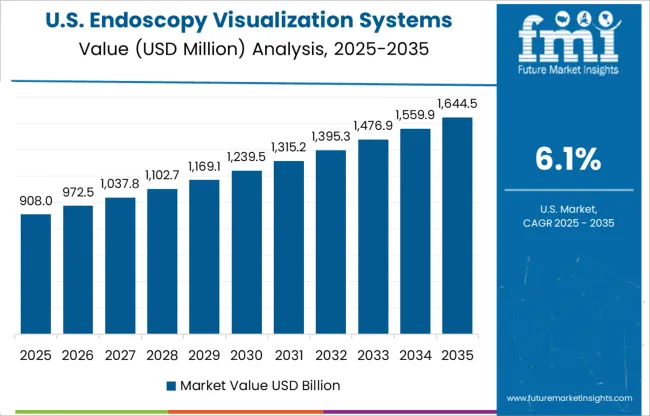
The USA is estimated to account for over 84.9% of the North America endoscopy visualization systems market in 2025. High adoption of technologically advanced systems and devices by the medical facilities and huge number of medical institutions are expected to drive the demand in this country.
Increasing healthcare expenditure by governments has enabled the installation and usage of sophisticated endoscopy visualization systems for endoscopic surgeries in hospitals of USA which will fuel the overall revenue of the endoscopy visualization systems and drive the growth of the market.
Moreover, focus on new technology development with advancements in medical device industry exhibiting innovative product design and enhanced patient safety is expected to create a huge platform for innovative technologies in USA
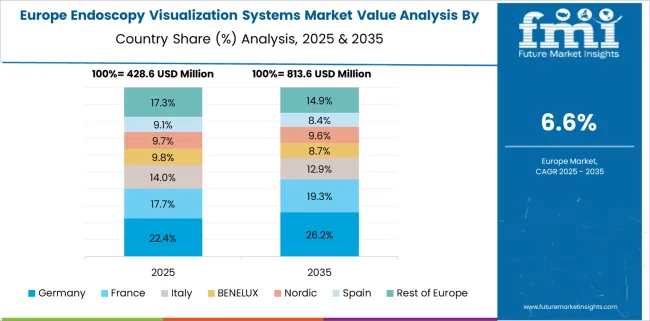
Germany is estimated to account for 27.0% market revenue share in Europe in 2025. Rising geriatric population, increased obesity rates, growing incidence of associated disease, rising awareness among the patient population and well established healthcare facilities are the major factor boosting the demand for endoscopy visualization systems market in Germany.
For instance, According to the World Health Aging 2024 highlights by the United Nations Department of Economic and Social Affairs, in October 2024, the number of people aged 65 years and older was estimated to be around 1.6 million globally. In 2024, population aged 65 years and above for Germany was 21.7%. Population ages 65 and above as a percentage of the total population.
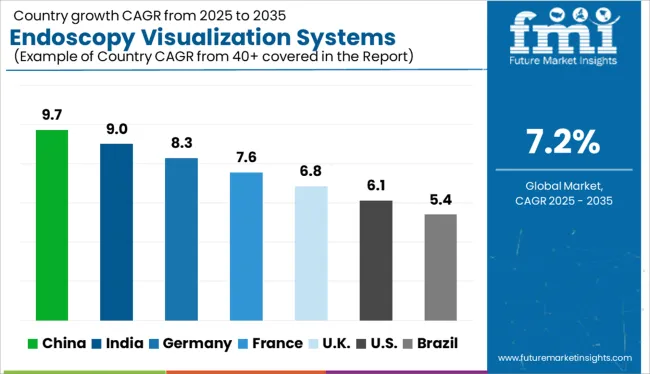
China having great growth opportunities due to changing demographics in emerging economies and growth is demonstrated with CAGR 8.7% by 2035.
Additionally, rapid technological advancement, increasing case of chronic diseases and the increase in disposable income within this particular region is boosting the demand for endoscopy visualization systems.
Emerging economies such as china and japan are expected to provide high growth opportunities for endoscopy visualization market. Healthcare expenditure for public and private use in these countries is projected to see huge growth, which in turn is expected to drive the focus of the manufacturers in these markets.
According to the World Bank Group in 2014 China’s healthcare expenditure was 5.5% of the GDP, and increased in 2024
Recently demand for endoscopy visualization systems market in India is rising and contribute 19.5% market share by value in 2024.
Developing countries such as India have a large share of undiagnosed patients. These geographies represent a big opportunity for medical device manufacturers.
Additionally, the increasing demand for endoscopic procedures due to high prevalence of urology, cancer, gynecology, gastrointestinal, and other cavity disorders owing to changing lifestyle is expected to drive the demand for endoscopy visualization systems in the India.
High Range EVS accounts for the highest share of around 47.9% in 2024 due to advanced clear image producing technology at less cost and high specificity as compared with low and medium range system.
High-Range EVS is gaining traction due to high adoption of this procedures in endoscopy visualization system as they provide more clear image with advanced features as compared to low and mid-range EVS.
By disease Type, gastrointestinal tract is the leading segments and hold around 21.4% market revenue share in 2024.
There’s a high prevalence of gastrointestinal infectious diseases all over the world due to unhealthy lifestyles and malnutrition. Pain of such diseases is unbearable and physician preference for endoscopy to diagnose the related issues better and provide for effective treatment options. Hence, this segments is highest revenue generating segment.
According to reported data from the Center for Science in the Public Interest, in 2024, unhealthy diets contributed to approximately 678,000 deaths each year in the U.S.
By end user, hospitals segment lead the market with market share of 67.4% in 2024 owing to an increase in the use of endoscopic equipment in hospitals, rising government and private support in the healthcare industry, and increasing number of skilled healthcare professionals and technologically advanced services in medical institutions.
Additionally, most of patient prefer to go to hospital for diagnosis. As the treatment and diagnosis is easily available in hospital. Endoscopy visualization systems can be easily installed in hospitals and more walk in patient can by entertained for treatment. Thus this segment will witness significant growth in recent years.
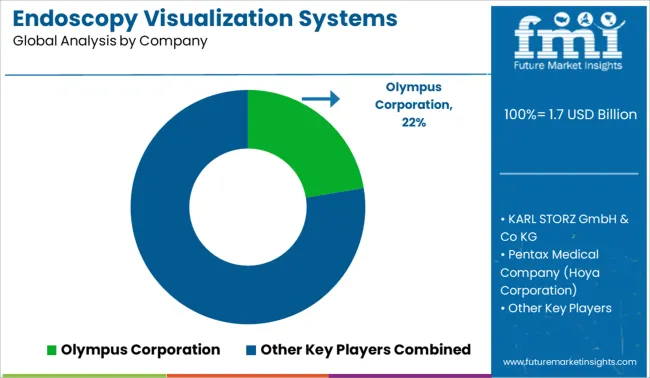
The endoscopy visualization systems market is an extremely consolidated market, with major competitors such as Olympus Corporation, Pentax Medical Company (Hoya Corporation), Fujifilm Holding Corporation, Karl Storz GmbH & Co KG, Richard Wolf GmbH and Boston Scientific Corporation, Smith & Nephew, ConMed Corporation, Stryker Corporation, Terumo Corporation, DePuy Synthes (Johnson & Johnson Services, Inc. ) operating in every region of the globe. To attract more customers, major players are focusing on mergers and acquisition and launching novel products in order to boost their market position and expand their product portfolios.
| Attribute | Details |
|---|---|
| Forecast Period | 2025 to 2035 |
| Historical Data Available for | 2013 to 2024 |
| Market Analysis | USD Million for Value and Volume in Unit |
| Key Countries Covered | USA, Canada, Brazil, Mexico, Argentina, Germany, UK, France, Spain, Russia, China, Japan, South Korea, India, Australia, New Zealand, GCC Countries, South Africa |
| Key Segments Covered | Product Type, Area End User and Region |
| Key Companies Profiled | Olympus Corporation; Pentax Medical Company (Hoya Corporation); Fujifilm Holding Corporation; Karl Storz GmbH & Co KG; Richard Wolf GmbH; Boston Scientific Corporation; Smith & Nephew; ConMed Corporation; Stryker Corporation; Terumo Corporation; DePuy Synthes (Johnson & Johnson Services, Inc.) |
| Report Coverage | Market Forecast, Competition Intelligence, DROT Analysis, Market Dynamics and Challenges, Strategic Growth Initiatives |
| Customization & Pricing | Available upon Request |
The global endoscopy visualization systems market is estimated to be valued at USD 1.7 billion in 2025.
The market size for the endoscopy visualization systems market is projected to reach USD 3.5 billion by 2035.
The endoscopy visualization systems market is expected to grow at a 7.2% CAGR between 2025 and 2035.
The key product types in endoscopy visualization systems market are high range evs, mid-range evs and low range evs.
In terms of area, gastrointestinal tract segment to command 38.1% share in the endoscopy visualization systems market in 2025.


Our Research Products

The "Full Research Suite" delivers actionable market intel, deep dives on markets or technologies, so clients act faster, cut risk, and unlock growth.

The Leaderboard benchmarks and ranks top vendors, classifying them as Established Leaders, Leading Challengers, or Disruptors & Challengers.

Locates where complements amplify value and substitutes erode it, forecasting net impact by horizon

We deliver granular, decision-grade intel: market sizing, 5-year forecasts, pricing, adoption, usage, revenue, and operational KPIs—plus competitor tracking, regulation, and value chains—across 60 countries broadly.

Spot the shifts before they hit your P&L. We track inflection points, adoption curves, pricing moves, and ecosystem plays to show where demand is heading, why it is changing, and what to do next across high-growth markets and disruptive tech

Real-time reads of user behavior. We track shifting priorities, perceptions of today’s and next-gen services, and provider experience, then pace how fast tech moves from trial to adoption, blending buyer, consumer, and channel inputs with social signals (#WhySwitch, #UX).

Partner with our analyst team to build a custom report designed around your business priorities. From analysing market trends to assessing competitors or crafting bespoke datasets, we tailor insights to your needs.
Supplier Intelligence
Discovery & Profiling
Capacity & Footprint
Performance & Risk
Compliance & Governance
Commercial Readiness
Who Supplies Whom
Scorecards & Shortlists
Playbooks & Docs
Category Intelligence
Definition & Scope
Demand & Use Cases
Cost Drivers
Market Structure
Supply Chain Map
Trade & Policy
Operating Norms
Deliverables
Buyer Intelligence
Account Basics
Spend & Scope
Procurement Model
Vendor Requirements
Terms & Policies
Entry Strategy
Pain Points & Triggers
Outputs
Pricing Analysis
Benchmarks
Trends
Should-Cost
Indexation
Landed Cost
Commercial Terms
Deliverables
Brand Analysis
Positioning & Value Prop
Share & Presence
Customer Evidence
Go-to-Market
Digital & Reputation
Compliance & Trust
KPIs & Gaps
Outputs
Full Research Suite comprises of:
Market outlook & trends analysis
Interviews & case studies
Strategic recommendations
Vendor profiles & capabilities analysis
5-year forecasts
8 regions and 60+ country-level data splits
Market segment data splits
12 months of continuous data updates
DELIVERED AS:
PDF EXCEL ONLINE
Endoscopy Video Systems Market Size and Share Forecast Outlook 2025 to 2035
Endoscopy Fluid Management Systems Market Size and Share Forecast Outlook 2025 to 2035
Endoscopy Visualization System And Component Market Analysis – Trends & Forecast 2024-2034
ENT endoscopy Market
Global Neuroendoscopy Devices Market Analysis – Size, Share & Forecast 2023-2033
Veterinary Video Endoscopy Market Analysis by Solution, Product Type, Animal Type, Application, Procedure, End User and Region: Forecast for 2025 to 2035
Unilateral Biportal Endoscopy Market Analysis – Size, Share & Forecast 2024-2034
Surgical Visualization Market
Logistics Visualization System Market
Arthroscopy Visualization Systems Market Size and Share Forecast Outlook 2025 to 2035
Advanced (3D/4D) Visualization Systems Market Analysis by Platform, End User, Application, and Region through 2035
Systems Administration Management Tools Market Size and Share Forecast Outlook 2025 to 2035
VRF Systems Market Growth - Trends & Forecast 2025 to 2035
Cloud Systems Management Software Market Size and Share Forecast Outlook 2025 to 2035
Hi-Fi Systems Market Size and Share Forecast Outlook 2025 to 2035
Cough systems Market
Backpack Systems Market Size and Share Forecast Outlook 2025 to 2035
Unmanned Systems Market Analysis - Size, Share, & Forecast Outlook 2025 to 2035
DC Power Systems Market Trends - Growth, Demand & Forecast 2025 to 2035
Catheter Systems Market

Thank you!
You will receive an email from our Business Development Manager. Please be sure to check your SPAM/JUNK folder too.
Chat With
MaRIA