

- Market Size (2026)
- USD 434.3 Mn
- Forecast (2036)
- USD 1652.9 Mn
- CAGR (2026 to 2036)
- 14.3%
Energy-Optimized Regenerative Brake Algorithms Market Size, Market Forecast and Outlook By FMI
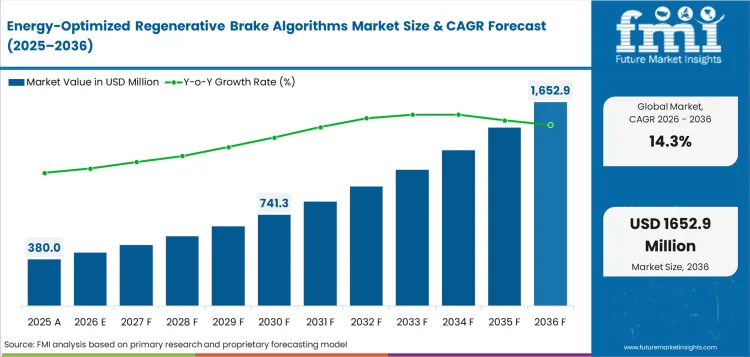
The energy-optimized regenerative brake algorithms market was valued at USD 380.0 million in 2025. Sales are projected at USD 434.3 million by 2026-end and USD 1,652.9 million by 2036, expanding at a CAGR of 14.3% between 2026 and 2036. Energy recovery is expected to account for 34.0% optimization focus share, and OEM fitment is expected to lead the sales channel segment with a 69.0% share.
Summary of the Energy-Optimized Regenerative Brake Algorithms Market
- Demand and Growth Drivers
- Range recovery needs lift demand for brake algorithms as EV makers seek higher usable energy from every deceleration event.
- Brake-by-wire platforms increase software value as pedal input and wheel braking can be tuned through electronic controls.
- Battery protection routines raise algorithm depth as charge intake limits change with temperature and pack condition.
- Product and Segment View
- Energy recovery is projected to account for 34.0% share in 2026, as automakers treat captured braking energy as a direct range improvement lever.
- Battery electric platforms are expected to represent 58.0% of propulsion type demand in 2026, driven by larger battery packs and deeper recuperation capacity.
- OEM fitment holds the top sales position, with factory-level validation shaping demand before regenerative braking software enters vehicle programs.
- Geography and Competitive Outlook
- China is expected to record a CAGR of 16.8% through 2036, reflecting large EV platform volume and local software demand.
- India is projected to expand at 16.0% CAGR through 2036, as local EV production adds calibration work.
- Companies combining brake hardware access with control software validation are strengthening their market position during the forecast period.
- Analyst Opinion
- Nikhil Kaitwade, Principal Consultant for the Automotive domain at FMI, says, “Regenerative brake algorithms are becoming core EV software for efficiency and brake feel. Automakers need recovered energy without pedal inconsistency or battery stress. Calibration work and road testing raise cost while actuator access and battery interface skill reduce software rework.”
- Energy-Optimized Regenerative Brake Algorithms Market Value Analysis
- The energy-optimized regenerative brake algorithms market is moving from basic recuperation control into brake energy management software.
- Adoption is being driven by range targets and safety validation needs across electric vehicle platforms.
- The market is benefiting from deeper use of regenerative braking system platforms across passenger cars and electric buses.
- OEM software update cycles reinforce adoption through brake-by-wire platforms and battery management controls.
Key Takeaways, Market Size and Forecast
- The energy-optimized regenerative brake algorithms market was valued at USD 380.0 million in 2025.
- By 2036, the energy-optimized regenerative brake algorithms market is projected to reach USD 1,652.9 million.
- From 2026 to 2036, the market is projected to expand at a CAGR of 14.3%.
- The market is projected to create an incremental opportunity of USD 1,218.6 million between 2026 and 2036.
- In 2026, energy recovery is expected to account for 34.0% of optimization focus demand.
- China at 16.8% and India at 16.0% are two of the fastest expanding country markets.
Regenerative braking software now has two main jobs inside an EV. It must recover energy for driving range and work safely with braking systems during sudden stops. IEA reported in May 2026 that global electric car sales exceeded 20 million in 2025, with battery electric cars forming 65% of electric car sales. This makes energy recovery software more important as automakers try to improve range across large EV fleets. NHTSA’s April 2024 FMVSS No. 127 rule adds safety pressure, as the AEB standard is projected to save at least 360 lives each year.
Regenerative braking software needs to work smoothly with emergency braking systems. Bosch’s January 2025 brake-by-wire test over 2,050 miles shows why real-road validation is important before OEM sourcing. Suppliers with proven brake feel control and vehicle testing capability will be better placed in future electric vehicle programs.
Energy-Optimized Regenerative Brake Algorithms Market Definition
The energy-optimized regenerative brake algorithms market includes embedded control software used to optimize electric energy recovery during braking. These algorithms manage motor braking, friction brake blending, pedal feel, and battery charge limits. Scope includes OEM software, calibration services, validation tools, and control logic used in EV and hybrid braking systems. Mechanical brake pads, hydraulic hardware sold alone, and traction motors sold without brake control software are outside the scope.
Energy-Optimized Regenerative Brake Algorithms Market Inclusions
Market scope covers all commercially traded energy-optimized regenerative brake algorithm solutions categorized by optimization focus, including energy recovery, torque blending, battery protection, low-speed handover, and pedal feel; propulsion type, including battery electric, plug-in hybrid, hybrid electric, and fuel cell vehicles; vehicle type, including passenger cars, light commercial vehicles, electric buses, heavy trucks, and two-wheelers; control architecture, including distributed ECU, centralized domain, zonal gateway, cloud-calibrated, and edge AI systems; and sales channel, including OEM fitment, software updates, calibration services, aftermarket retrofit, and simulation licenses.
Revenue scope covers 2026 to 2036. Key stakeholders include vehicle manufacturers, brake system suppliers, chassis control software providers, ECU suppliers, battery management system developers, validation service providers, simulation tool vendors, Tier-1 component manufacturers, fleet operators, calibration specialists, system integrators, distributors, and regulatory bodies.
Energy-Optimized Regenerative Brake Algorithms Market Exclusions
Scope does not include brake pads, brake discs, hydraulic fluid circuits, standalone electric motors, charging stations, or battery packs sold without braking control software.
Energy-Optimized Regenerative Brake Algorithms Market Research Methodology
- Primary Research: FMI analysts talked to vehicle manufacturers, brake system suppliers, software calibration specialists, and validation service providers in important markets.
- Desk Research: Combined data from EV policy sources, brake safety rules, company product portfolios, and vehicle software architecture references.
- Market sizing and forecasting: Added software value per vehicle across propulsion types and sales channels from the bottom up.
- Data validation: Cross-checked every three months against EV sales patterns, brake-by-wire programs, and supplier control software coverage.
Why is the Energy-Optimized Regenerative Brake Algorithms Market Growing?
- Vehicle makers are using regenerative brake algorithms earlier to reduce range loss across real-world driving cycles.
- Brake suppliers are becoming important as EV platforms combine motor braking and friction braking in one control plan.
- Manufacturers are outsourcing calibration work to firms with stronger simulation methods and vehicle-level validation systems.
Electric vehicle expansion is raising the value of braking software inside each new platform. Larger EV fleets make even small energy recovery improvements useful for range planning and battery management. Algorithm providers gain importance as automakers need repeatable control maps across battery electric and hybrid vehicles.
Brake safety rules are adding pressure to make regenerative control more predictable. NHTSA finalized FMVSS No. 127 in April 2024 and requires automatic emergency braking as standard on cars and light trucks from 2029. Regenerative software must coordinate with service brakes during emergency braking without reducing stopping confidence. Suppliers with automotive active safety system experience can reduce validation gaps during vehicle launch programs.
Market Segmentation Analysis
- Energy recovery is forecast to capture 34.0% of optimization focus value in 2026, as range-sensitive EV programs place higher value on usable braking energy.
- Battery electric platforms are expected to represent 58.0% of propulsion type revenue in 2026 due to deeper recuperation potential across larger battery packs.
- Passenger cars are projected to hold 61.0% of vehicle type share in 2026, reflecting broad software reuse across high-volume EV platforms.
- Distributed ECU systems are expected to account for 46.0% of control architecture adoption in 2026, supported by fast local brake control needs.
- OEM fitment is expected to lead sales channels with 69.0% share in 2026, as regenerative braking software needs validation before vehicle launch.
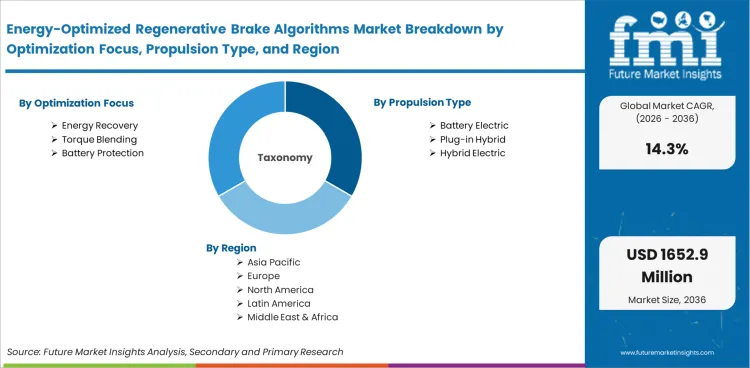
The market for energy-optimized regenerative brake algorithms is divided into groups based on optimization focus, propulsion type, vehicle type, control architecture, sales channel, and region. Under optimization focus, the market includes energy recovery, torque blending, battery protection, low-speed handover, and pedal feel. By propulsion type, the market covers battery electric vehicles, plug-in hybrid vehicles, hybrid electric vehicles, and fuel cell vehicles. Based on vehicle type, it includes passenger cars, light commercial vehicles, electric buses, heavy trucks, and two-wheelers. By control architecture, the market includes distributed ECU, centralized domain, zonal gateway, cloud-calibrated, and edge AI systems. By sales channel, the market is segmented into OEM fitment, software updates, calibration services, aftermarket retrofit, and simulation licenses.
Insights into Energy-Optimized Regenerative Brake Algorithms Market by Optimization Focus
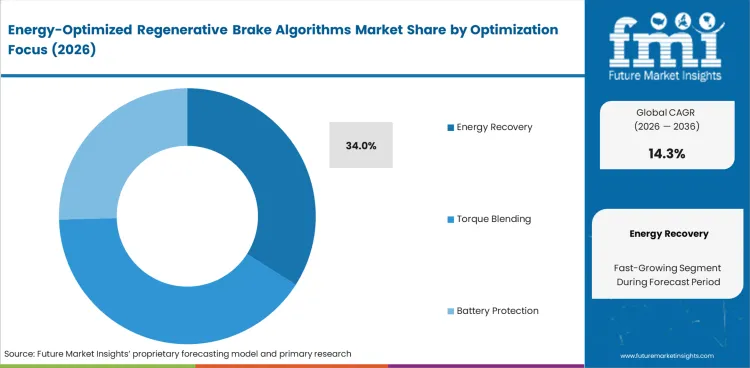
- In 2026, energy recovery algorithms are expected to contribute 34.0% of the optimization focus segment. Energy recovery routines help automakers capture usable braking energy and maintain stable pedal response across repeated stops.
- Torque blending and battery protection options address selected EV control needs. Their value improves in models requiring smoother brake handover and stronger pack protection.
Insights into Energy-Optimized Regenerative Brake Algorithms Market by Propulsion Type
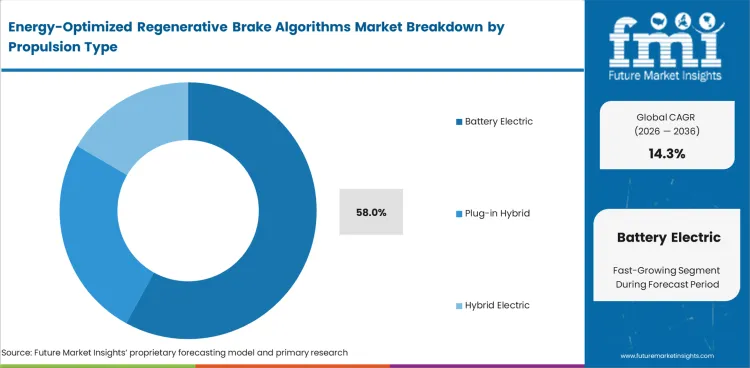
- Battery electric platforms are projected to account for 58.0% of the propulsion type segment in 2026. Larger battery packs create stronger scope for recuperation during city braking and highway deceleration.
- Plug-in hybrid and hybrid electric platforms require more selective calibration work. Their value improves in programs balancing engine operation with motor-based braking response.
Insights into Energy-Optimized Regenerative Brake Algorithms Market by Vehicle Type
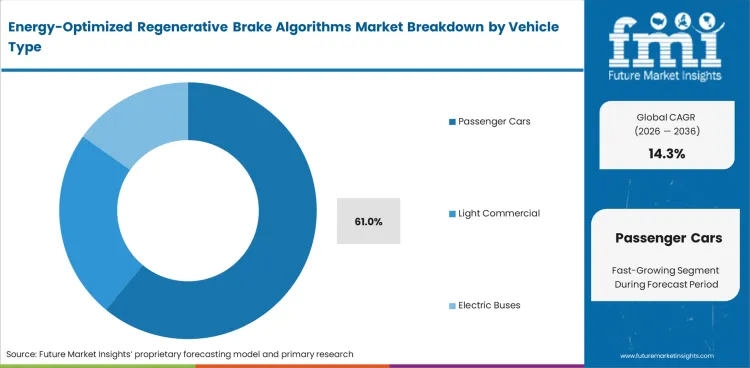
- Passenger cars are expected to represent 61.0% of vehicle type demand in 2026. High-volume EV programs use shared software maps to reduce release cost across multiple models.
- Electric buses and heavy trucks address duty cycles with frequent braking loads. Their value improves in fleet routes with repeated stops and predictable energy recovery windows.
Insights into Energy-Optimized Regenerative Brake Algorithms Market by Control Architecture
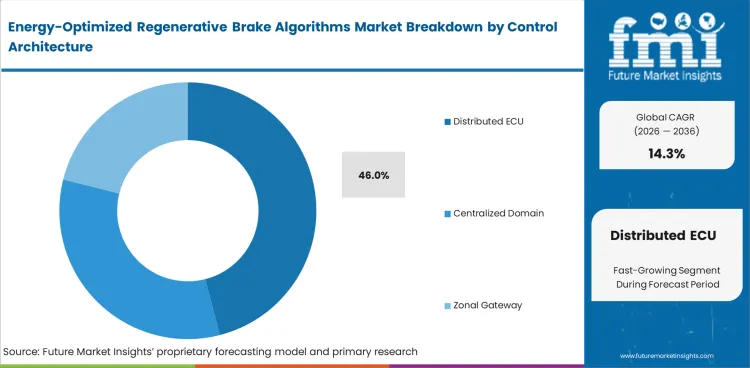
- Distributed ECU systems are expected to account for 46.0% share in 2026. Local brake controllers support faster actuator response across safety-critical braking functions.
- Centralized domain and zonal gateway options address newer software-defined vehicle programs. Their value improves in platforms using shared compute power and unified chassis control.
Insights into Energy-Optimized Regenerative Brake Algorithms Market by Sales Channel
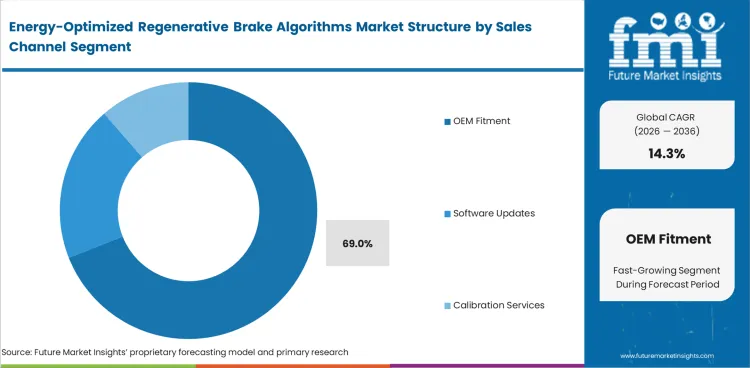
- OEM fitment is projected to hold 69.0% share in 2026. Vehicle makers prefer factory-integrated software because braking algorithms need safety validation before launch.
- Software updates and calibration services lift models already in service. Their value improves as fleet data helps refine energy recovery and pedal response after release.
Energy-Optimized Regenerative Brake Algorithms Market Drivers, Restraints, and Opportunities
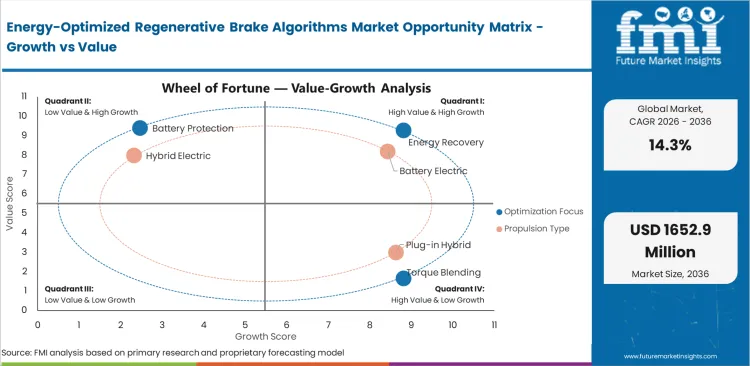
- Brake-by-wire adoption is creating demand for regenerative control software across EV platforms.
- The requirement for specialized validation and skilled calibration teams increases pricing pressure for smaller software providers.
- Connected vehicle data improves service opportunity through software updates and fleet-based brake map refinement.
Energy-optimized regenerative brake algorithms keep growing as EVs and hybrid vehicles need smoother brake energy recovery and stable pedal response during repeated deceleration. Cost pressure and long validation cycles can slow broader use across price-sensitive vehicle programs. Growth continues through brake-by-wire platforms and OEM software updates.
EV Scale Is Pulling Base Calibration Prices Down
In May 2025, the IEA reported that electric car sales topped 17 million worldwide in 2024, up over 25%, with first-quarter 2025 sales exceeding 4 million and rising 35% year over year. For energy optimized regenerative brake algorithms, this scale changes pricing behavior across vehicle programs. OEMs now have more platforms to amortize code libraries and model-in-the-loop validation costs. Brake blending calibration benefits from this scale, which reduces baseline per vehicle pricing.
Baseline regenerative braking logic faces lower pricing and stronger bundling pressure within vehicle control software. The price premium is shifting toward adaptive algorithms to demonstrate measurable incremental range improvements. These specialized solutions improve pedal feel and favor battery health protection features. They enable OTA calibratability across models which adds further value beyond basic functionality. Generic energy recovery functionality no longer commands a strong premium in competitive software offerings.
Battery Cost Declines Are Repricing Software Value
In January 2025, DOE stated that battery costs for light-duty BEVs, SUVs, pickup trucks, and Class 3 vans were captured at $128-$133/kWh, down from $150/kWh in its 2022 analysis; the high-voltage battery cost reduction reached $4,134 for a midsize SUV and $2,996 for a pickup truck. This cost deflation changes how regenerative brake algorithm suppliers are priced. When hardware cost falls, OEM purchasing teams become less willing to pay separate premiums for standard efficiency code.
Vendors need value-based quotes tied to reduced brake wear and smaller usable buffer requirements. They should reflect warranty risk reduction to strengthen the economic case for customers. Measurable range gains under drive cycle testing can further justify stronger pricing positions. Without these elements pricing tends to move toward platform level license compression over time.
Analysis of Energy-Optimized Regenerative Brake Algorithms Market By Key Countries
.webp "Top Country Growth Comparison Energy Optimized Regenerative Brake Algorithms Market Cagr (2026 2036)")
| Country | CAGR |
|---|---|
| China | 16.8% |
| India | 16.0% |
| South Korea | 15.2% |
| USA | 14.5% |
| Germany | 14.1% |
| Japan | 12.9% |
| UK | 12.5% |
Source: Future Market Insights, 2026.
Energy-Optimized Regenerative Brake Algorithms Market CAGR Analysis By Country
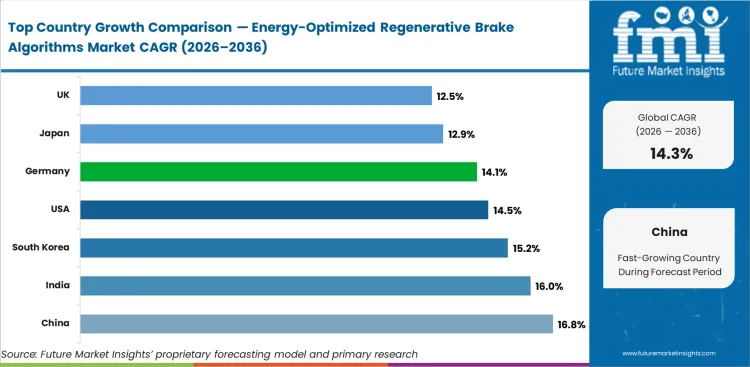
- China is projected to record a 16.8% CAGR through 2036, with domestic EV platform scale creating heavier demand for brake software calibration.
- India’s 16.0% CAGR is shaped by local EV manufacturing programs and the need for cost-efficient passenger car software localization.
- South Korea is expected to reach 15.2% CAGR by 2036, backed by EV policy targets and strong chassis electronics capability.
- A 14.5% CAGR in the United States points to brake safety regulation and heavier EV formats needing more refined regenerative control.
- Germany is forecast to expand at 14.1% CAGR as premium EV production raises demand for validated chassis software.
- Japan at 12.9% and the UK at 12.5% indicate steadier expansion across mature engineering markets with controlled EV software rollout.
Demand for energy-optimized regenerative brake algorithms is forecast to rise at 14.3% CAGR from 2026 to 2036. Country-level analysis covers the major markets contributing to this forecast, with the key markets listed below.
Demand Outlook for Energy-Optimized Regenerative Brake Algorithms Market in China
China’s energy-optimized regenerative brake algorithms industry is projected to record a CAGR of 16.8% through 2036. IEA reported in May 2026 over 13 million electric cars were sold in China during 2025. This manufacturing and sales base creates high recurring demand for China energy-optimized regenerative brake algorithms. Local suppliers can gain from EV makers seeking range improvement and stable brake feel across many models.
- Domestic EV platforms raise demand for energy recovery and torque blending software across city driving cycles.
- China’s high model count enhances more calibration variants across battery sizes and braking hardware packages.
- Local OEMs need control software aligned with electric vehicle sensor inputs and pack protection rules.
Sales Analysis of Energy-Optimized Regenerative Brake Algorithms Market in India
The energy-optimized regenerative brake algorithms sector in India is expected to expand at a CAGR of 16.0% during the assessment period. IEA reported in May 2026 electric car sales in India increased 75% year over year to reach 165,000 in 2025. This sales base supports demand for India energy-optimized regenerative brake algorithms. Software providers benefit from local manufacturers seeking affordable calibration packages for compact EV programs.
- Tata and Mahindra EV programs boost demand for localized regeneration maps across urban driving patterns.
- India’s SPMEPCI framework strengthens interest in local EV manufacturing and platform software work.
- Two wheeler electrification increases future demand for smaller regenerative control modules across high-volume mobility use.
Demand Outlook for Energy-Optimized Regenerative Brake Algorithms Market in South Korea
The South Korea energy-optimized regenerative brake algorithms industry is forecast to grow at a CAGR of 15.2% by 2036. IEA reported in May 2026 electric car sales in Korea grew around 65% year over year to exceed 200,000 in 2025. Korean vehicle manufacturers value suppliers with chassis electronics and battery software knowledge. Local algorithm demand benefits from national targets for electric and fuel cell vehicles.
- Hyundai Motor Group programs improve demand for regenerative brake tuning across passenger EV platforms.
- Korea’s 2030 zero-emission vehicle target adds direction for brake control and battery interface planning.
- Local chassis suppliers need validation depth for export models sold across North America and Europe.
Opportunity Analysis of Energy-Optimized Regenerative Brake Algorithms Market in the United States
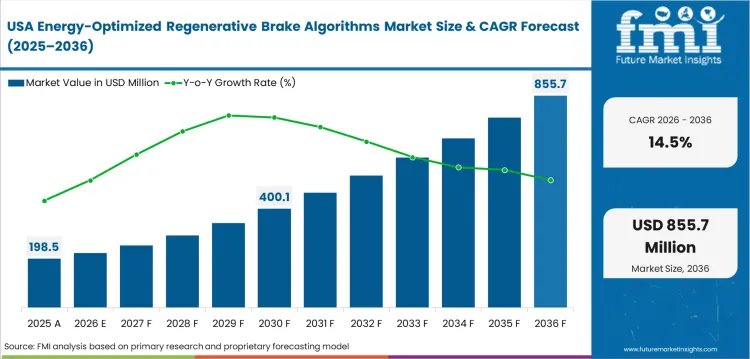
The USA energy-optimized regenerative brake algorithms segment is projected to advance at 14.5% CAGR over the forecast years. IEA reported in May 2026 USA electric car sales were around 1.5 million in 2025. Large vehicle formats boost demand for USA energy-optimized regenerative brake algorithms. Software demand is high for SUVs and pickups needing stable pedal feel under heavier loads.
- FMVSS No. 127 creates a safety validation frame for brake control software from 2029.
- Detroit engineering centers keep demand active for platform calibration and embedded chassis software.
- Large SUVs create high brake energy loads, which raises algorithm value during repeated deceleration events.
Future Outlook for Energy-Optimized Regenerative Brake Algorithms Market in Germany
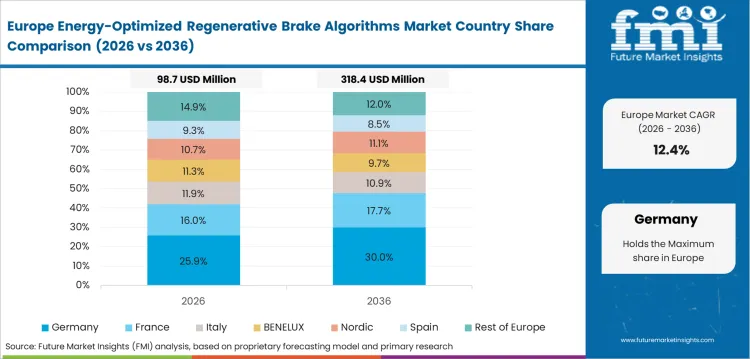
Germany’s energy-optimized regenerative brake algorithms industry is expected to post 14.1% CAGR from 2026 to 2036. IEA reported in May 2026 electric car sales in Germany reached a record 850,000 in 2025. This favors demand for Germany energy-optimized regenerative brake algorithms as premium brands tune range and braking feel together. Suppliers with fast simulation and road validation can serve compact and premium EV platforms.
- Bavaria and Baden-Württemberg concentrate automotive engineering demand for chassis software validation.
- German premium EV programs need strong pedal feel consistency across winter testing and Autobahn braking.
- Local Tier-1 suppliers connect vehicle control unit (vcu) integration with brake energy recovery.
Demand Outlook for Energy-Optimized Regenerative Brake Algorithms Market in Japan
Japan’s energy-optimized regenerative brake algorithms industry is projected to record a CAGR of 12.9% over the assessment period. IEA reported in May 2026 electric car sales in Japan were just above 100,000 in 2025. Japan is important as hybrid systems still need refined regenerative braking control. Local automakers can use hybrid expertise to build smooth brake blending across new EV models.
- Toyota and Honda hybrid programs keep brake energy management expertise active across Japanese platforms.
- Apartment parking limits slow BEV uptake, which gives hybrid calibration more near-term weight.
- Japan’s engineering base keeps demand focused on pedal smoothness and battery protection across compact vehicles.
In-depth Analysis of Energy-Optimized Regenerative Brake Algorithms Market in the United Kingdom
The UK energy-optimized regenerative brake algorithms industry is expected to expand at 12.5% CAGR through 2036. IEA reported in May 2026 nearly half a million UK electric car sales in 2025 were battery electric. This favors demand for UK energy-optimized regenerative brake algorithms as automakers refine efficiency under ZEV targets. Software and validation firms can gain from local engineering services linked to EV launches.
- The UK Vehicle Emissions Trading Schemes set a zero-emission car target for new registrations.
- Midlands engineering centers increase demand for brake calibration and vehicle software validation services.
- UK EV programs use software defined vehicle tools to refine braking maps after launch.
Company Positioning and Strategic Context
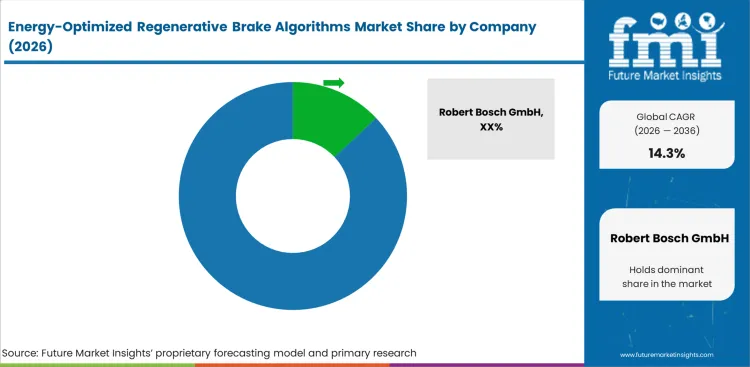
- Bosch holds a leading position through brake-by-wire road testing depth and embedded brake control software for safety-sensitive EV programs.
- Continental and ZF compete through global brake hardware reach and electronic chassis control systems used across electric platforms.
- Specialist software firms focus on calibration services and simulation tools used to verify regenerative braking behavior before production release.
Supplier rivalry in this market is shaped by how effectively companies connect energy recovery software with real brake hardware during vehicle validation. Bosch brings braking control depth and road-test capability across safety-critical platforms used in modern EV programs. Continental offers brake-by-wire systems with control software designed for electric vehicle braking and chassis integration needs. ZF competes through Electro-Mechanical Braking and chassis systems planned for volume production across global OEM programs. Hyundai Mobis and Denso add regional strength through OEM relationships and Automotive ECU expertise in Asian vehicle programs.
Safety validation cost and brake actuator data access create entry barriers across vehicle programs. Strategic priorities include recovery yield and pedal feel control across long vehicle development cycles. Battery charge protection influences supplier selection as automakers balance range value with safe braking behavior. Manufacturers prefer suppliers combining software maps and hardware knowledge under one validation plan. Supplier selection will favor companies able to prove braking performance on real vehicles before software reaches production release.
Key Companies in the Energy-Optimized Regenerative Brake Algorithms Market
Key global companies leading the energy-optimized regenerative brake algorithms market include:
- Robert Bosch GmbH, Continental AG, and ZF Friedrichshafen AG have strong brake control infrastructure for regenerative braking and by-wire systems.
- Denso Corporation, Hyundai Mobis, and Hitachi Astemo serve manufacturers through chassis electronics and high-volume vehicle control platforms.
- ADVICS Co. Ltd. and Brembo N.V. hold specialist positions across brake control systems and intelligent braking platforms.
Company Benchmarking: Energy-Optimized Regenerative Brake Algorithms Market
| Company | Regen Control Depth | Brake Hardware Access | Validation Coverage | Geographic Footprint |
|---|---|---|---|---|
| Robert Bosch GmbH | High | High | Strong | Germany-led global footprint across Europe, North America, China, India, Japan, and South Korea |
| Continental AG | High | High | Strong | Germany-led global footprint across Europe, North America, China, India, Japan, and South Korea |
| ZF Friedrichshafen AG | High | High | Strong | Germany-led global footprint across Europe, North America, China, India, Japan, South Korea, and Southeast Asia |
| Denso Corporation | Medium | Medium | Strong | Japan-led global footprint across Asia Pacific, North America, Europe, South America, and Africa |
| Hyundai Mobis | Medium | High | Strong | South Korea-led footprint across Asia, North America, Europe, India, and China |
| Hitachi Astemo Ltd. | Medium | High | Moderate | Japan-led footprint across Asia, North America, Europe, and major global vehicle production hubs |
| ADVICS Co. Ltd. | Medium | High | Moderate | Japan-led footprint across North America, South America, China, Southeast Asia, and Europe |
| Brembo N.V. | Medium | High | Moderate | Italy-led footprint across Europe, North America, South America, China, India, and Japan |
Source: Future Market Insights, 2026.
Key Developments in Energy-Optimized Regenerative Brake Algorithms Market
- In August 2024, ZF highlighted its Braking and e-Drive Synergy Program, which harmonizes electric driveline and braking control software to optimize recuperation while maintaining stability control. The company presented a Software Brake Resistor function using location data and charge-management logic to reserve battery capacity before downhill operation, allowing more braking energy to be stored instead of wasted through hardware resistors. The development directly links regenerative braking, route intelligence, battery-state control, and efficiency software in commercial electric vehicle platforms.
- In January 2025, Hyundai Motor India announced the CRETA Electric with an ADAS-linked regenerative braking system designed to sense the distance from the vehicle ahead and adjust regenerative braking levels accordingly. The model includes single-pedal drive technology, allowing acceleration, deceleration, and full stop control through the accelerator pedal. The development shows regenerative braking moving from fixed driver-selectable levels toward sensor-informed, adaptive energy recovery logic in mass-market electric SUVs.
Key Players in the Energy-Optimized Regenerative Brake Algorithms Market
Major Global Players:
- Robert Bosch GmbH
- Continental AG
- ZF Friedrichshafen AG
- Denso Corporation
- Hyundai Mobis
- Hitachi Astemo Ltd.
- ADVICS Co. Ltd.
Specialist Players:
- Brembo N.V.
Report Scope and Coverage
| Parameter | Details |
|---|---|
| Quantitative Units | USD 434.3 million to USD 1,652.9 million, at a CAGR of 14.3% |
| Market Definition | The energy-optimized regenerative brake algorithms market encompasses embedded software used to optimize braking energy recovery and brake blending. |
| Regions Covered | North America, Latin America, Europe, East Asia, South Asia and Pacific, Middle East and Africa |
| Countries Covered | USA, UK, Germany, China, India, Japan, South Korea, and 30 plus countries |
| Key Companies Profiled | Robert Bosch GmbH, Continental AG, ZF Friedrichshafen AG, Denso Corporation, Hyundai Mobis, Hitachi Astemo Ltd., ADVICS Co. Ltd., Brembo N.V. |
| Forecast Period | 2026 to 2036 |
| Approach | Hybrid bottom-up and top-down methodology starting with vehicle software demand and verified EV adoption patterns. |
Energy-Optimized Regenerative Brake Algorithms Market by Segments
Energy-Optimized Regenerative Brake Algorithms Market Segmented by Optimization Focus:
- Energy Recovery
- Torque Blending
- Battery Protection
- Low-Speed Handover
- Pedal Feel
Energy-Optimized Regenerative Brake Algorithms Market Segmented by Propulsion Type:
- Battery Electric
- Plug-in Hybrid
- Hybrid Electric
- Fuel Cell
Energy-Optimized Regenerative Brake Algorithms Market Segmented by Vehicle Type:
- Passenger Cars
- Light Commercial
- Electric Buses
- Heavy Trucks
- Two-Wheelers
Energy-Optimized Regenerative Brake Algorithms Market Segmented by Control Architecture:
- Distributed ECU
- Centralized Domain
- Zonal Gateway
- Cloud-Calibrated
- Edge AI
Energy-Optimized Regenerative Brake Algorithms Market Segmented by Sales Channel:
- OEM Fitment
- Software Updates
- Calibration Services
- Aftermarket Retrofit
- Simulation Licenses
Energy-Optimized Regenerative Brake Algorithms Market Segmented by Region:
- North America
- USA
- Canada
- Mexico
- Latin America
- Brazil
- Chile
- Rest of Latin America
- Europe
- Germany
- UK
- Italy
- Spain
- France
- Rest of Europe
- East Asia
- China
- Japan
- South Korea
- South Asia and Pacific
- India
- ASEAN
- Australia & New Zealand
- Rest of South Asia and Pacific
- Middle East and Africa
- Saudi Arabia
- Other GCC Countries
- South Africa
- Rest of Middle East and Africa
Research Sources and Bibliography
- International Energy Agency. (2026, May). Global EV Outlook 2026: Trends in electric cars. IEA.
- International Energy Agency. (2026, May 20). Global EV Data Explorer. IEA.
- National Highway Traffic Safety Administration. (2024, April 29). NHTSA finalizes key safety rule to reduce crashes and save lives. USA Department of Transportation.
- National Highway Traffic Safety Administration. (2024, November 26). Federal Motor Vehicle Safety Standards; Automatic Emergency Braking Systems for Light Vehicles. Federal Register.
- Bureau of Transportation Statistics. (2026, March 25). Hybrid-electric, plug-in hybrid-electric and electric vehicle sales. USA Department of Transportation.
- Society of Motor Manufacturers and Traders. (2026, January 6). UK new car market breaches two million as almost one in four buyers go electric. SMMT.
- Department for Transport. (2025, November 19). The vehicle emissions trading schemes: How to comply. GOV.UK.
- Federation of Automobile Dealers Associations. (2026, April 6). FADA releases FY 2026 and March 2026 vehicle retail data. FADA.
- Ministry of Climate, Energy and Environment. (2026, January 4). Launch of support for hydrogen vehicle and hydrogen refueling station deployment programs. Government of the Republic of Korea. MCEE official press release
- Japan Automobile Manufacturers Association. (2025, September 26). The motor industry of Japan 2025. JAMA.
- International Council on Clean Transportation. (2025, September). Global electric vehicle market monitor for light-duty vehicles in key markets, 2025 H1. ICCT. Global electric vehicle market monitor for light-duty vehicles in key markets, 2025 H1 - International Council on Clean Transportation
- International Energy Agency. (2026, May). Global EV Outlook 2026: Trends in electric cars. IEA.
- National Highway Traffic Safety Administration. (2024, April 29). NHTSA finalizes key safety rule to reduce crashes and save lives. USA Department of Transportation.
- Bosch. (2025, January 30). With brake-by-wire from Bosch to the Arctic Circle. Bosch Press.
- USA Department of Energy. (2025, January). 2025 Incremental Purchase Cost Methodology and Results for Clean Vehicles. Vehicle Technologies Office. 2025 Incremental Purchase Cost Methodology and Results for Clean Vehicles
- International Energy Agency. (2025, May 14). Trends in electric car markets. In Global EV Outlook 2025. IEA. Trends in electric car markets - Global EV Outlook 2025 - Analysis - IEA
- Hyundai Motor India Limited. (2025, January 6). Hyundai CRETA Electric technology, safety, and performance [Press release]. Hyundai CRETA Electric press release.
- ZF Group. (2024, June 27). ZF highlights intelligent software solutions for smarter, more connected commercial vehicles [Press release]. ZF Presseinformation
This bibliography is provided for reader reference and is not exhaustive. The full report contains the complete reference list and detailed citations.
This Report Answers
- What is the current and future size of the energy-optimized regenerative brake algorithms market?
- How fast is the energy-optimized regenerative brake algorithms market expected to expand between 2026 and 2036?
- Which optimization focus segment is expected to lead the market by 2026?
- Which sales channel segment is expected to account for the leading demand by 2026?
- What factors are driving demand for energy-optimized regenerative brake algorithms globally?
- How are brake-by-wire systems influencing algorithm demand across electric vehicles?
- Why is OEM fitment the main demand base for regenerative brake algorithms?
- How are battery electric vehicles creating demand for specialized regenerative braking control?
- Which countries are projected to record faster expansion through 2036?
- What is driving market expansion in China and India?
- Who are the key companies active in the energy-optimized regenerative brake algorithms market?
- How does FMI estimate and validate the market forecast?
Frequently Asked Questions
What is the global market demand for Energy-Optimized Regenerative Brake Algorithms in 2026?
In 2026, the global market for energy-optimized regenerative brake algorithms is estimated at USD 434.3 million.
How big will the market for Energy-Optimized Regenerative Brake Algorithms be in 2036?
By 2036, the market for energy-optimized regenerative brake algorithms is projected to reach USD 1,652.9 million.
How much is demand for Energy-Optimized Regenerative Brake Algorithms expected to expand between 2026 and 2036?
Between 2026 and 2036, demand for energy-optimized regenerative brake algorithms is expected to expand at a CAGR of 14.3%.
Which optimization focus segment is expected to lead globally by 2026?
Energy recovery is expected to contribute 34.0% of the optimization focus segment in 2026.
What is causing demand to rise in China?
The China energy-optimized regenerative brake algorithms market is projected to record 16.8% CAGR through 2036, supported by EV platform scale and local software demand.
What is causing demand to rise in India?
The India energy-optimized regenerative brake algorithms market is projected to expand at 16.0% CAGR through 2036, supported by local EV production and calibration needs.
What does this report mean by Energy-Optimized Regenerative Brake Algorithms Market definition?
The energy-optimized regenerative brake algorithms market includes embedded software used to optimize energy recovery during braking in EV and hybrid vehicles.
How does FMI make the Energy-Optimized Regenerative Brake Algorithms forecast and check it?
Forecasting models use a hybrid bottom-up and top-down approach, starting with software demand and checking it against EV platform adoption patterns.
Preview the report firsthand - request a free sample
Get SampleGet the brochure for pricing and purchase details.
Get PDFTable of Content
- Key Takeaways
- Market Size and CAGR
- Top Growth Driver
- Fastest Growing Segment
- Leading Region
- Key Companies
- Emerging Opportunities
- Executive Summary
- Global Market Outlook
- Demand-side Trends
- Supply-side Trends
- Technology Roadmap Analysis
- Analysis and Recommendations
- Analyst Perspective (What is happening? Why now? What should investors know?)
- Key Questions Answered
- How large is the market?
- What is the CAGR?
- What are key trends?
- Which region dominates?
- Who are the leaders?
- Market Overview
- Market Coverage / Taxonomy
- Market Definition / Scope / Limitations
- Research Methodology
- Chapter Orientation
- Analytical Lens and Working Hypotheses
- Market Structure, Signals, and Trend Drivers
- Benchmarking and Cross-market Comparability
- Market Sizing, Forecasting, and Opportunity Mapping
- Research Design and Evidence Framework
- Desk Research Programme (Secondary Evidence)
- Expert Input and Fieldwork (Primary Evidence)
- Tooling, Models, and Reference Databases
- Data Engineering and Model Build
- Quality Assurance and Audit Trail
- Market Background
- Market Dynamics (Drivers, Restraints, Opportunity, Trends)
- Scenario Forecast (Optimistic, Likely, Conservative)
- Impact Analysis
- AI Impact
- Sustainability Impact
- Regulatory Impact
- Technology Impact
- Consumer / Buyer Analysis
- Purchase Drivers
- Adoption Barriers
- Buyer Journey
- Opportunity Map Analysis
- Product Life Cycle Analysis
- Supply Chain Analysis
- Investment Feasibility Matrix
- Value Chain Analysis
- PESTLE and Porter's Analysis
- Regulatory Landscape
- Regional Parent Market Outlook
- Production and Consumption Statistics
- Import and Export Statistics
- Global Market Analysis and Forecast, 2021 to 2036
- Historical Market Size Value (USD Million) & Volume (Unit) Analysis, 2021 to 2025
- Current and Future Market Size Value (USD Million) & Volume (Unit) Projections, 2026 to 2036
- Y-o-Y Growth Trend Analysis
- Absolute $ Opportunity Analysis
- Global Market Pricing Analysis, 2021 to 2036
- Global Market Analysis and Forecast, By Optimization Focus, 2021 to 2036
- Introduction / Key Findings
- Historical Market Size Value (USD Million) & Volume (Unit) Analysis By Optimization Focus, 2021 to 2025
- Current and Future Market Size Value (USD Million) & Volume (Unit) Analysis and Forecast By Optimization Focus, 2026 to 2036
- Energy Recovery
- Torque Blending
- Battery Protection
- Low-Speed Handover
- Pedal Feel
- Energy Recovery
- Y-o-Y Growth Trend Analysis By Optimization Focus, 2021 to 2025
- Absolute $ Opportunity Analysis By Optimization Focus, 2026 to 2036
- Global Market Analysis and Forecast, By Propulsion Type, 2021 to 2036
- Introduction / Key Findings
- Historical Market Size Value (USD Million) & Volume (Unit) Analysis By Propulsion Type, 2021 to 2025
- Current and Future Market Size Value (USD Million) & Volume (Unit) Analysis and Forecast By Propulsion Type, 2026 to 2036
- Battery Electric
- Plug-in Hybrid
- Hybrid Electric
- Fuel Cell
- Battery Electric
- Y-o-Y Growth Trend Analysis By Propulsion Type, 2021 to 2025
- Absolute $ Opportunity Analysis By Propulsion Type, 2026 to 2036
- Global Market Analysis and Forecast, By Vehicle Type, 2021 to 2036
- Introduction / Key Findings
- Historical Market Size Value (USD Million) & Volume (Unit) Analysis By Vehicle Type, 2021 to 2025
- Current and Future Market Size Value (USD Million) & Volume (Unit) Analysis and Forecast By Vehicle Type, 2026 to 2036
- Passenger Cars
- Light Commercial
- Electric Buses
- Heavy Trucks
- Two-Wheelers
- Passenger Cars
- Y-o-Y Growth Trend Analysis By Vehicle Type, 2021 to 2025
- Absolute $ Opportunity Analysis By Vehicle Type, 2026 to 2036
- Global Market Analysis and Forecast, By Control Architecture, 2021 to 2036
- Introduction / Key Findings
- Historical Market Size Value (USD Million) & Volume (Unit) Analysis By Control Architecture, 2021 to 2025
- Current and Future Market Size Value (USD Million) & Volume (Unit) Analysis and Forecast By Control Architecture, 2026 to 2036
- Distributed ECU
- Centralized Domain
- Zonal Gateway
- Cloud-Calibrated
- Edge AI
- Distributed ECU
- Y-o-Y Growth Trend Analysis By Control Architecture, 2021 to 2025
- Absolute $ Opportunity Analysis By Control Architecture, 2026 to 2036
- Global Market Analysis and Forecast, By Sales Channel, 2021 to 2036
- Introduction / Key Findings
- Historical Market Size Value (USD Million) & Volume (Unit) Analysis By Sales Channel, 2021 to 2025
- Current and Future Market Size Value (USD Million) & Volume (Unit) Analysis and Forecast By Sales Channel, 2026 to 2036
- OEM Fitment
- Software Updates
- Calibration Services
- Aftermarket Retrofit
- Simulation Licenses
- OEM Fitment
- Y-o-Y Growth Trend Analysis By Sales Channel, 2021 to 2025
- Absolute $ Opportunity Analysis By Sales Channel, 2026 to 2036
- Global Market Analysis and Forecast, By Region, 2021 to 2036
- Introduction
- Historical Market Size Value (USD Million) & Volume (Unit) Analysis By Region, 2021 to 2025
- Current Market Size Value (USD Million) & Volume (Unit) Analysis and Forecast By Region, 2026 to 2036
- North America
- Latin America
- Western Europe
- Eastern Europe
- East Asia
- South Asia and Pacific
- Middle East & Africa
- Market Attractiveness Analysis By Region
- North America Market Analysis and Forecast, By Country, 2021 to 2036
- Historical Market Size Value (USD Million) & Volume (Unit) Trend Analysis By Market Taxonomy, 2021 to 2025
- Market Size Value (USD Million) & Volume (Unit) Forecast By Market Taxonomy, 2026 to 2036
- By Country
- USA
- Canada
- Mexico
- By Optimization Focus
- By Propulsion Type
- By Vehicle Type
- By Control Architecture
- By Sales Channel
- By Country
- Market Attractiveness Analysis
- By Country
- By Optimization Focus
- By Propulsion Type
- By Vehicle Type
- By Control Architecture
- By Sales Channel
- Key Takeaways
- Latin America Market Analysis and Forecast, By Country
- Historical Market Size Value (USD Million) & Volume (Unit) Trend Analysis By Market Taxonomy, 2021 to 2025
- Market Size Value (USD Million) & Volume (Unit) Forecast By Market Taxonomy, 2026 to 2036
- By Country
- Brazil
- Chile
- Rest of Latin America
- By Optimization Focus
- By Propulsion Type
- By Vehicle Type
- By Control Architecture
- By Sales Channel
- By Country
- Market Attractiveness Analysis
- By Country
- By Optimization Focus
- By Propulsion Type
- By Vehicle Type
- By Control Architecture
- By Sales Channel
- Key Takeaways
- Western Europe Market Analysis and Forecast, By Country
- Historical Market Size Value (USD Million) & Volume (Unit) Trend Analysis By Market Taxonomy, 2021 to 2025
- Market Size Value (USD Million) & Volume (Unit) Forecast By Market Taxonomy, 2026 to 2036
- By Country
- Germany
- UK
- Italy
- Spain
- France
- Nordic
- BENELUX
- Rest of Western Europe
- By Optimization Focus
- By Propulsion Type
- By Vehicle Type
- By Control Architecture
- By Sales Channel
- By Country
- Market Attractiveness Analysis
- By Country
- By Optimization Focus
- By Propulsion Type
- By Vehicle Type
- By Control Architecture
- By Sales Channel
- Key Takeaways
- Eastern Europe Market Analysis and Forecast, By Country
- Historical Market Size Value (USD Million) & Volume (Unit) Trend Analysis By Market Taxonomy, 2021 to 2025
- Market Size Value (USD Million) & Volume (Unit) Forecast By Market Taxonomy, 2026 to 2036
- By Country
- Russia
- Poland
- Hungary
- Balkan & Baltic
- Rest of Eastern Europe
- By Optimization Focus
- By Propulsion Type
- By Vehicle Type
- By Control Architecture
- By Sales Channel
- By Country
- Market Attractiveness Analysis
- By Country
- By Optimization Focus
- By Propulsion Type
- By Vehicle Type
- By Control Architecture
- By Sales Channel
- Key Takeaways
- East Asia Market Analysis and Forecast, By Country
- Historical Market Size Value (USD Million) & Volume (Unit) Trend Analysis By Market Taxonomy, 2021 to 2025
- Market Size Value (USD Million) & Volume (Unit) Forecast By Market Taxonomy, 2026 to 2036
- By Country
- China
- Japan
- South Korea
- By Optimization Focus
- By Propulsion Type
- By Vehicle Type
- By Control Architecture
- By Sales Channel
- By Country
- Market Attractiveness Analysis
- By Country
- By Optimization Focus
- By Propulsion Type
- By Vehicle Type
- By Control Architecture
- By Sales Channel
- Key Takeaways
- South Asia and Pacific Market Analysis and Forecast, By Country
- Historical Market Size Value (USD Million) & Volume (Unit) Trend Analysis By Market Taxonomy, 2021 to 2025
- Market Size Value (USD Million) & Volume (Unit) Forecast By Market Taxonomy, 2026 to 2036
- By Country
- India
- ASEAN
- Australia & New Zealand
- Rest of South Asia and Pacific
- By Optimization Focus
- By Propulsion Type
- By Vehicle Type
- By Control Architecture
- By Sales Channel
- By Country
- Market Attractiveness Analysis
- By Country
- By Optimization Focus
- By Propulsion Type
- By Vehicle Type
- By Control Architecture
- By Sales Channel
- Key Takeaways
- Middle East & Africa Market Analysis and Forecast, By Country
- Historical Market Size Value (USD Million) & Volume (Unit) Trend Analysis By Market Taxonomy, 2021 to 2025
- Market Size Value (USD Million) & Volume (Unit) Forecast By Market Taxonomy, 2026 to 2036
- By Country
- Kingdom of Saudi Arabia
- Other GCC Countries
- Türkiye
- South Africa
- Other African Union
- Rest of Middle East & Africa
- By Optimization Focus
- By Propulsion Type
- By Vehicle Type
- By Control Architecture
- By Sales Channel
- By Country
- Market Attractiveness Analysis
- By Country
- By Optimization Focus
- By Propulsion Type
- By Vehicle Type
- By Control Architecture
- By Sales Channel
- Key Takeaways
- Key Countries Market Analysis
- USA
- Pricing Analysis
- Market Share Analysis, 2025
- By Optimization Focus
- By Propulsion Type
- By Vehicle Type
- By Control Architecture
- By Sales Channel
- Canada
- Pricing Analysis
- Market Share Analysis, 2025
- By Optimization Focus
- By Propulsion Type
- By Vehicle Type
- By Control Architecture
- By Sales Channel
- Mexico
- Pricing Analysis
- Market Share Analysis, 2025
- By Optimization Focus
- By Propulsion Type
- By Vehicle Type
- By Control Architecture
- By Sales Channel
- Brazil
- Pricing Analysis
- Market Share Analysis, 2025
- By Optimization Focus
- By Propulsion Type
- By Vehicle Type
- By Control Architecture
- By Sales Channel
- Chile
- Pricing Analysis
- Market Share Analysis, 2025
- By Optimization Focus
- By Propulsion Type
- By Vehicle Type
- By Control Architecture
- By Sales Channel
- Germany
- Pricing Analysis
- Market Share Analysis, 2025
- By Optimization Focus
- By Propulsion Type
- By Vehicle Type
- By Control Architecture
- By Sales Channel
- UK
- Pricing Analysis
- Market Share Analysis, 2025
- By Optimization Focus
- By Propulsion Type
- By Vehicle Type
- By Control Architecture
- By Sales Channel
- Italy
- Pricing Analysis
- Market Share Analysis, 2025
- By Optimization Focus
- By Propulsion Type
- By Vehicle Type
- By Control Architecture
- By Sales Channel
- Spain
- Pricing Analysis
- Market Share Analysis, 2025
- By Optimization Focus
- By Propulsion Type
- By Vehicle Type
- By Control Architecture
- By Sales Channel
- France
- Pricing Analysis
- Market Share Analysis, 2025
- By Optimization Focus
- By Propulsion Type
- By Vehicle Type
- By Control Architecture
- By Sales Channel
- India
- Pricing Analysis
- Market Share Analysis, 2025
- By Optimization Focus
- By Propulsion Type
- By Vehicle Type
- By Control Architecture
- By Sales Channel
- ASEAN
- Pricing Analysis
- Market Share Analysis, 2025
- By Optimization Focus
- By Propulsion Type
- By Vehicle Type
- By Control Architecture
- By Sales Channel
- Australia & New Zealand
- Pricing Analysis
- Market Share Analysis, 2025
- By Optimization Focus
- By Propulsion Type
- By Vehicle Type
- By Control Architecture
- By Sales Channel
- China
- Pricing Analysis
- Market Share Analysis, 2025
- By Optimization Focus
- By Propulsion Type
- By Vehicle Type
- By Control Architecture
- By Sales Channel
- Japan
- Pricing Analysis
- Market Share Analysis, 2025
- By Optimization Focus
- By Propulsion Type
- By Vehicle Type
- By Control Architecture
- By Sales Channel
- South Korea
- Pricing Analysis
- Market Share Analysis, 2025
- By Optimization Focus
- By Propulsion Type
- By Vehicle Type
- By Control Architecture
- By Sales Channel
- Russia
- Pricing Analysis
- Market Share Analysis, 2025
- By Optimization Focus
- By Propulsion Type
- By Vehicle Type
- By Control Architecture
- By Sales Channel
- Poland
- Pricing Analysis
- Market Share Analysis, 2025
- By Optimization Focus
- By Propulsion Type
- By Vehicle Type
- By Control Architecture
- By Sales Channel
- Hungary
- Pricing Analysis
- Market Share Analysis, 2025
- By Optimization Focus
- By Propulsion Type
- By Vehicle Type
- By Control Architecture
- By Sales Channel
- Kingdom of Saudi Arabia
- Pricing Analysis
- Market Share Analysis, 2025
- By Optimization Focus
- By Propulsion Type
- By Vehicle Type
- By Control Architecture
- By Sales Channel
- Türkiye
- Pricing Analysis
- Market Share Analysis, 2025
- By Optimization Focus
- By Propulsion Type
- By Vehicle Type
- By Control Architecture
- By Sales Channel
- South Africa
- Pricing Analysis
- Market Share Analysis, 2025
- By Optimization Focus
- By Propulsion Type
- By Vehicle Type
- By Control Architecture
- By Sales Channel
- USA
- Market Structure Analysis
- Competition Dashboard
- Competition Benchmarking
- Market Share Analysis of Top Players
- By Regional
- By Optimization Focus
- By Propulsion Type
- By Vehicle Type
- By Control Architecture
- By Sales Channel
- Emerging Startups
- Innovation Benchmarking
- Competition Analysis
- Competition Deep Dive
- Robert Bosch GmbH
- Overview
- Product Portfolio
- Profitability by Market Segments (Product/Region/Sales Channel)
- Sales Footprint
- Strategy Overview
- Marketing Strategy
- Product Strategy
- Channel Strategy
- Continental AG
- ZF Friedrichshafen AG
- Denso Corporation
- Hyundai Mobis
- Hitachi Astemo Ltd.
- ADVICS Co. Ltd.
- Brembo N.V.
- Robert Bosch GmbH
- Case Studies
- Success Stories
- Recent Developments
- Competition Deep Dive
- Assumptions & Acronyms Used


